Statistiche di base
| Proprietari istituzionali | 603 total, 572 long only, 12 short only, 19 long/short - change of -7,52% MRQ |
| Prezzo dell'azione | 14,30 |
| Allocazione media del portafoglio | 0.3071 % - change of -19,85% MRQ |
| Azioni istituzionali (Long) | 582.546.717 (ex 13D/G) - change of -4,32MM shares -0,74% MRQ |
| Valore istituzionale (Long) | $ 8.942.865 USD ($1000) |
Proprietà istituzionale e azionisti
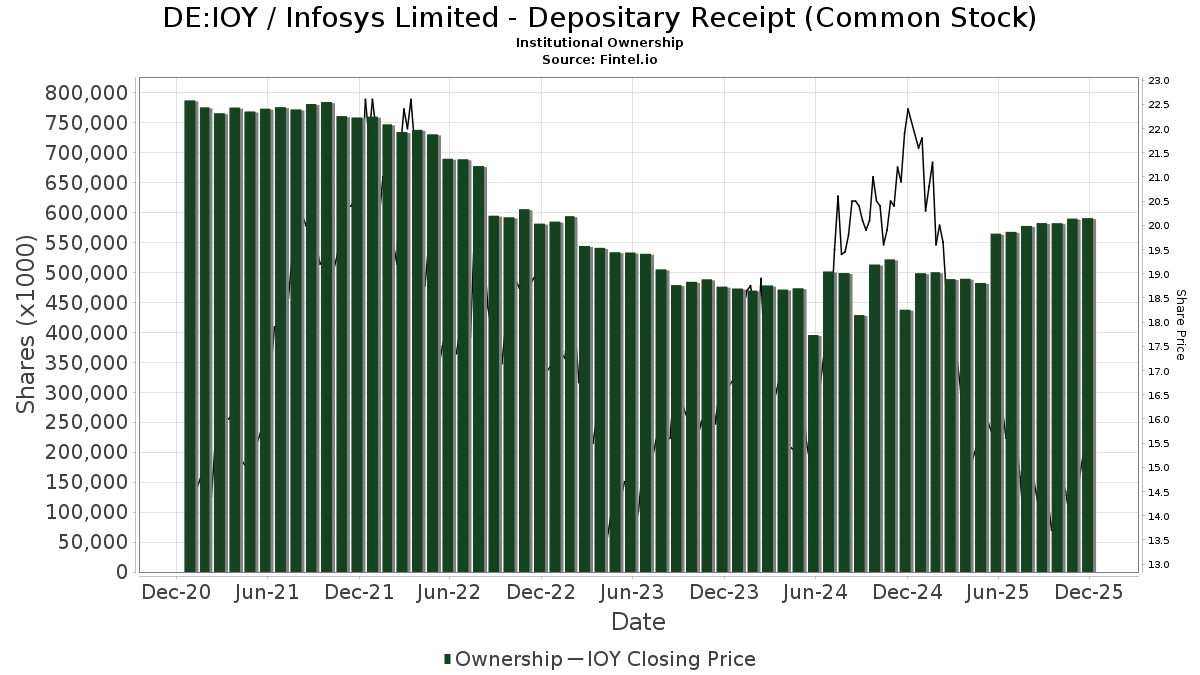
Infosys Limited - Depositary Receipt (Common Stock) (DE:IOY) ha 603 proprietari istituzionali e azionisti che hanno presentato i moduli 13D/G o 13F alla Securities Exchange Commission (SEC). Queste istituzioni detengono un totale di 584,254,410 azioni. I maggiori azionisti includono First Trust Advisors Lp, CIBR - First Trust NASDAQ Cybersecurity ETF, Morgan Stanley, Jpmorgan Chase & Co, Robeco Institutional Asset Management B.V., Acadian Asset Management Llc, GQG Partners LLC, Lazard Asset Management Llc, UBS Group AG, and BlackRock, Inc. .
(Infosys Limited - Depositary Receipt (Common Stock) (DB:IOY) la struttura proprietaria istituzionale mostra le attuali posizioni nella società da parte di istituzioni e fondi, nonché le ultime variazioni nella dimensione della posizione. I principali azionisti possono essere singoli investitori, fondi comuni, hedge fund o istituzioni. L'allegato 13D indica che l'investitore detiene (o ha detenuto) più del 5% della società e intende (o intendeva) perseguire attivamente un cambiamento nella strategia aziendale. L'allegato 13G indica un investimento passivo superiore al 5%.
The share price as of February 4, 2026 is 14,30 / share. Previously, on February 5, 2025, the share price was 21,30 / share. This represents a decline of 32,86% over that period.
Indice del sentiment dei fondi
L'indice del sentiment dei fondi (anche noto come "indice di accumulo di proprietà") individua i titoli più acquistati dai fondi. È il risultato di un sofisticato modello quantitativo multi-fattore che identifica le società con i più alti livelli di accumulo istituzionale. Il modello utilizza una combinazione dell'aumento totale dei proprietari dichiarati, delle variazioni nelle allocazioni di portafoglio di tali proprietari e di altre metriche. Il punteggio varia da 0 a 100: i numeri più alti indicano un livello di accumulo superiore ad altre società, mentre 50 rappresenta la media.
Frequenza di aggiornamento: giornaliera
Consulta Ownership Explorer per visualizzare l'elenco delle aziende con il ranking più alto.
AI+ Ask Fintel’s AI assistant about Infosys Limited - Depositary Receipt (Common Stock).
Select a question to share a public post with an AI-crafted answer.
Thinking of good questions…
Depositi 13F e NPORT
Le informazioni relative ai depositi 13F sono gratuite. Per accedere alle informazioni relative ai depositi NP è necessario un'abbonamento premium. Le righe verdi indicano le nuove posizioni. Le righe rosse indicano le posizioni chiuse. Fai clic sull'icona del link per visualizzare la cronologia completa delle transazioni.
Esegui l'upgrade
per sbloccare i dati premium ed esportarli in Excel ![]() .
.
Important Note
In an effort to reduce load times for our mobile users, we are testing some ways to deliver lighter pages.
In this first test, we will deliver only the most recent 750 transactions (out of 765 for this stock). If you are interested in loading *all* the transactions for this company, click the "load all" button below. This is just a test and if you don't like it, please let us know by submitting some gentle feedback via the link at the bottom of this page.
Load All| Data di deposito | Fonte | Investitore | Tipo | Prezzo medio (Stima) |
Azioni | Δ Azioni (%) |
Valore dichiarato ($ 1000) |
Δ Valore (%) |
Allocazione del portafoglio (%) |
|
|---|---|---|---|---|---|---|---|---|---|---|
| 2025-11-12 | 13F | Harbour Investments, Inc. | 56 | 0,00 | 1 | -100,00 | ||||
| 2025-11-19 | 13F | Captrust Financial Advisors | 18.788 | 11,46 | 306 | -2,24 | ||||
| 2026-02-04 | 13F | Naples Global Advisors, Llc | 427.707 | 1,80 | 7.622 | 11,48 | ||||
| 2025-11-10 | 13F | Rossby Financial, LCC | 58 | 1 | ||||||
| 2026-02-03 | 13F | Sageworth Trust Co | 0 | -100,00 | 0 | |||||
| 2025-09-25 | NP | abrdn Funds - abrdn Emerging Markets Dividend Active ETF | 81.588 | 2,03 | 1.364 | -3,06 | ||||
| 2025-11-20 | 13F/A | BRYN MAWR TRUST Co | 100 | -74,55 | 2 | -85,71 | ||||
| 2025-09-26 | NP | BLACKROCK FUNDS - BlackRock Advantage ESG Emerging Markets Equity Fund Institutional This fund is a listed as child fund of BlackRock, Inc. and if that institution has disclosed ownership in this security, then these positions will not be double counted when calculating total shares and total value | 2.465 | -42,61 | 41 | -45,33 | ||||
| 2025-11-13 | 13F | Natixis Advisors, L.p. | 272.051 | -28,08 | 4 | -42,86 | ||||
| 2025-08-07 | 13F | DJE Kapital AG | 0 | -100,00 | 0 | |||||
| 2025-11-14 | 13F | Flow Traders U.s. Llc | 0 | -100,00 | 0 | |||||
| 2025-11-14 | 13F | Mariner, LLC | 119.125 | -5,62 | 1.938 | -17,11 | ||||
| 2025-09-29 | NP | CRLSX - CATHOLIC RESPONSIBLE INVESTMENTS INTERNATIONAL EQUITY FUND Institutional Shares | 0 | -100,00 | 0 | -100,00 | ||||
| 2025-11-10 | 13F | Cozad Asset Management Inc | 14.065 | 2,40 | 229 | -10,24 | ||||
| 2025-11-14 | 13F | Warren Averett Asset Management, LLC | 310.912 | 7,10 | 5.059 | -5,97 | ||||
| 2025-11-13 | 13F | Johnson Financial Group, Inc. | 1.320 | 0,00 | 21 | -12,50 | ||||
| 2025-08-14 | 13F | Horizon Investments, LLC | 0 | -100,00 | 0 | |||||
| 2025-08-13 | 13F | Financial & Tax Architects, LLC | 0 | -100,00 | 0 | -100,00 | ||||
| 2025-11-13 | 13F | Brown Brothers Harriman & Co | 10.280 | 2,59 | 167 | -9,73 | ||||
| 2025-08-20 | NP | REMG - Emerging Markets Equity Active ETF | 15.224 | 282 | ||||||
| 2025-08-27 | NP | Jnl Series Trust - Jnl/jpmorgan Global Allocation Fund (a) | 32.677 | 10,06 | 606 | 11,83 | ||||
| 2025-11-10 | 13F | Beverly Hills Private Wealth, LLC | 0 | -100,00 | 0 | |||||
| 2025-11-13 | 13F | Schroder Investment Management Group | 4.361.468 | -20,28 | 71.179 | -29,79 | ||||
| 2026-01-05 | 13F | Rosenberg Matthew Hamilton | 7.507 | 0,00 | 134 | 9,02 | ||||
| 2026-01-12 | 13F | Daymark Wealth Partners, Llc | 12.800 | 0,00 | 228 | 9,62 | ||||
| 2025-11-13 | 13F | Banque Cantonale Vaudoise | 132.890 | 2.795,84 | 2 | |||||
| 2025-11-13 | 13F | Hsbc Holdings Plc | 9.116.592 | 4,11 | 150.788 | -8,68 | ||||
| 2025-11-13 | 13F | Invesco Ltd. | 5.859.958 | 37,78 | 95.342 | 20,97 | ||||
| 2025-11-13 | 13F | Hsbc Holdings Plc | Call | 18.500 | -38,33 | 301 | -45,16 | |||
| 2025-11-12 | 13F | West Family Investments, Inc. | 84.488 | 9,99 | 1.375 | -3,44 | ||||
| 2025-11-14 | 13F | Trexquant Investment LP | 667.983 | -11,89 | 10.868 | -22,64 | ||||
| 2026-02-03 | 13F/A | Bank Of America Corp /de/ | 13.335.120 | -13,77 | 216.962 | -24,29 | ||||
| 2025-09-26 | NP | SUNAMERICA SERIES TRUST - SA JPMorgan Diversified Balanced Portfolio Class 1 | 0 | -100,00 | 0 | -100,00 | ||||
| 2025-11-14 | 13F | Glen Eagle Advisors, LLC | 35 | -42,62 | 1 | -100,00 | ||||
| 2025-11-17 | 13F | Morningstar Investment Management LLC | 90.192 | 1 | ||||||
| 2025-09-25 | NP | VEU - Vanguard FTSE All-World ex-US Index Fund ETF Shares | 3.206.963 | 0,00 | 53.620 | -5,00 | ||||
| 2026-01-20 | 13F | Perpetual Ltd | 1.096.289 | -14,73 | 19.536 | -6,61 | ||||
| 2026-01-09 | 13F | SG Americas Securities, LLC | 213.137 | -75,87 | 4 | -78,57 | ||||
| 2025-11-12 | 13F | First Trust Advisors Lp | 59.328.844 | 17,88 | 965.280 | 3,50 | ||||
| 2025-11-14 | 13F | Goldman Sachs Group Inc | 11.325.945 | -37,65 | 184.273 | -45,26 | ||||
| 2025-09-23 | NP | VVIFX - Voya VACS Series EME Fund | 246.239 | 30,15 | 4.117 | 23,67 | ||||
| 2025-11-14 | 13F | Strategic Wealth Partners, Ltd. | 403 | 0,00 | 7 | -14,29 | ||||
| 2025-08-28 | NP | QEMM - SPDR MSCI Emerging Markets StrategicFactors ETF | 19.138 | -3,96 | 355 | -2,48 | ||||
| 2026-01-26 | 13F | KBC Group NV | 171.119 | 28,24 | 3 | 50,00 | ||||
| 2025-11-13 | 13F | Farringdon Capital, Ltd. | 49.845 | 811 | ||||||
| 2025-11-14 | 13F | Goldman Sachs Group Inc | Call | 200.000 | 3.254 | |||||
| 2026-01-30 | 13F/A | M&t Bank Corp | 97.573 | 1.739 | ||||||
| 2025-11-14 | 13F | D. E. Shaw & Co., Inc. | 0 | -100,00 | 0 | |||||
| 2025-08-12 | 13F | Proequities, Inc. | Put | 0 | 0 | |||||
| 2025-11-14 | 13F | Saturna Capital CORP | 211.318 | 10,45 | 3.438 | -3,02 | ||||
| 2025-11-13 | 13F | Macquarie Group Ltd | 680.255 | 4,96 | 11.068 | -7,84 | ||||
| 2025-11-14 | 13F | Cetera Investment Advisers | 107.060 | 72,80 | 1.742 | 51,66 | ||||
| 2025-11-13 | 13F | Guggenheim Capital Llc | 96.979 | -17,65 | 1.578 | -27,73 | ||||
| 2025-10-21 | 13F | Simon Quick Advisors, Llc | 0 | -100,00 | 0 | -100,00 | ||||
| 2025-10-29 | 13F | Americana Partners, LLC | 21.587 | -0,58 | 351 | -12,69 | ||||
| 2025-11-07 | 13F | Atticus Wealth Management, Llc | 0 | -100,00 | 0 | |||||
| 2025-11-13 | 13F | GQG Partners LLC | 21.547.039 | 350.570 | ||||||
| 2025-11-14 | 13F | Qtron Investments LLC | 49.793 | 148,10 | 810 | 118,33 | ||||
| 2025-09-25 | NP | JETIX - abrdn Global Equity Impact Fund Institutional Class | 58.320 | 0,00 | 975 | -4,97 | ||||
| 2026-01-22 | 13F | Pinnacle Bancorp, Inc. | 0 | -100,00 | 0 | |||||
| 2025-09-29 | NP | EELV - Invesco S&P Emerging Markets Low Volatility ETF This fund is a listed as child fund of Invesco Ltd. and if that institution has disclosed ownership in this security, then these positions will not be double counted when calculating total shares and total value | 81.225 | -4,25 | 1.358 | -8,98 | ||||
| 2025-08-27 | NP | OAIEX - Optimum International Fund Class A | 4.522 | 0,00 | 84 | 1,22 | ||||
| 2025-12-02 | 13F | Allworth Financial LP | 4.859 | 59,52 | 79 | 41,07 | ||||
| 2025-11-12 | 13F | Quantbot Technologies LP | 162.902 | -29,10 | 2.650 | -37,75 | ||||
| 2025-09-25 | NP | DAADX - Emerging Markets ex China Core Equity Portfolio Institutional Class | 50.694 | -44,21 | 848 | -47,03 | ||||
| 2026-01-20 | 13F | Arta Finance Wealth Management LLC | 35.429 | 631 | ||||||
| 2025-11-14 | 13F | Qube Research & Technologies Ltd | 0 | -100,00 | 0 | -100,00 | ||||
| 2026-01-27 | 13F | Evergreen Capital Management Llc | 67.747 | 36,75 | 1.207 | 49,75 | ||||
| 2026-01-15 | 13F | Highline Wealth Partners Llc | 224 | -61,25 | 4 | -66,67 | ||||
| 2025-11-13 | 13F | Van Eck Associates Corp | 439.043 | 12,09 | 7 | 0,00 | ||||
| 2025-08-08 | 13F | Avantax Advisory Services, Inc. | 35.266 | 9,83 | 653 | 11,62 | ||||
| 2026-01-23 | 13F | Robeco Institutional Asset Management B.V. | 34.372.927 | 1,51 | 612.526 | 11,18 | ||||
| 2026-02-02 | 13F | Principal Financial Group Inc | 141.125 | 0,00 | 2.515 | 9,49 | ||||
| 2025-08-22 | NP | FEMR - Fidelity Enhanced Emerging Markets ETF | 11.322 | 0,00 | 210 | 1,46 | ||||
| 2025-11-14 | 13F | Peak6 Llc | 25.130 | -28,47 | 409 | -37,33 | ||||
| 2025-09-26 | NP | SUNAMERICA SERIES TRUST - SA JPMorgan Emerging Markets Portfolio Class 1 | 102.860 | -32,22 | 1.720 | -35,62 | ||||
| 2026-01-08 | 13F | Armstrong Advisory Group, Inc | 58 | 0,00 | 1 | |||||
| 2025-08-08 | 13F | Jupiter Asset Management Ltd | 0 | -100,00 | 0 | -100,00 | ||||
| 2025-08-14 | 13F | Quantitative Investment Management, LLC | 0 | -100,00 | 0 | |||||
| 2025-11-07 | 13F | Abn Amro Investment Solutions | 181.692 | -38,79 | 2.956 | -46,25 | ||||
| 2025-09-25 | NP | DEHP - Dimensional Emerging Markets High Profitability ETF | 57.738 | 30,12 | 965 | 23,72 | ||||
| 2025-11-03 | 13F | Bank of New York Mellon Corp | 880.402 | -8,08 | 14.324 | -19,29 | ||||
| 2025-11-14 | 13F | Tcw Group Inc | 28.570 | -9,69 | 465 | -20,82 | ||||
| 2025-08-27 | NP | RYTIX - Technology Fund Investor Class | 17.748 | 40,87 | 329 | 43,23 | ||||
| 2025-11-14 | 13F | Wetherby Asset Management Inc | 208.099 | -4,35 | 3.386 | -16,03 | ||||
| 2025-10-27 | 13F | Henry James International Management Inc. | 86.367 | -3,95 | 1.405 | -15,67 | ||||
| 2025-10-27 | 13F | First Horizon Corp | 0 | -100,00 | 0 | |||||
| 2025-08-28 | NP | NZAC - SPDR MSCI ACWI Low Carbon Target ETF | 8.233 | 2,46 | 153 | 4,11 | ||||
| 2025-11-10 | 13F | Krane Funds Advisors LLC | 49.424 | 0,00 | 805 | -12,13 | ||||
| 2025-11-24 | 13F | CIBC Private Wealth Group, LLC | 5.135 | 15,78 | 84 | 1,22 | ||||
| 2025-11-14 | 13F | Squarepoint Ops LLC | 394.838 | -58,19 | 6.424 | -63,29 | ||||
| 2026-02-03 | 13F | Ballentine Partners, LLC | 99.635 | 3,07 | 1.775 | 12,91 | ||||
| 2025-11-07 | 13F | Mondrian Investment Partners LTD | 4.908.302 | 3.700,23 | 79.858 | 3.288,12 | ||||
| 2025-11-14 | 13F | Wexford Capital Lp | 0 | -100,00 | 0 | |||||
| 2025-11-12 | 13F | Principal Securities, Inc. | 1.944 | -25,89 | 32 | -35,42 | ||||
| 2025-08-12 | 13F | Martin Currie Ltd | 343.767 | -58,63 | 6.370 | -57,99 | ||||
| 2025-11-10 | 13F | Td Asset Management Inc | 61.469 | 1,60 | 1.000 | -10,79 | ||||
| 2025-11-06 | 13F | Guardcap Asset Management Ltd | 124.400 | -4,67 | 2.024 | -16,34 | ||||
| 2025-08-14 | 13F | Manufacturers Life Insurance Company, The | 0 | -100,00 | 0 | |||||
| 2026-01-16 | 13F | Crowley Wealth Management, Inc. | 0 | -100,00 | 0 | |||||
| 2025-11-12 | 13F | Simplex Trading, Llc | Call | 311.600 | 119,13 | 5 | 150,00 | |||
| 2025-08-14 | 13F | Hudson Bay Capital Management LP | 0 | -100,00 | 0 | |||||
| 2026-02-02 | 13F | Aikya Investment Management Ltd | 483.104 | -14,51 | 8.609 | -6,37 | ||||
| 2025-09-25 | NP | ROAM - Hartford Multifactor Emerging Markets ETF | 15.615 | 25,59 | 261 | 15,49 | ||||
| 2025-11-12 | 13F | Simplex Trading, Llc | Put | 118.300 | 776,30 | 2 | ||||
| 2025-09-26 | NP | HAOSX - Harbor Overseas Fund Institutional Class | 164.885 | 137,71 | 2.757 | 125,90 | ||||
| 2025-11-14 | 13F | SRS Capital Advisors, Inc. | 1.379 | 45,01 | 22 | 29,41 | ||||
| 2025-11-06 | 13F | Wealthstream Advisors, Inc. | 13.055 | -4,16 | 212 | -15,87 | ||||
| 2025-11-14 | 13F | Laidlaw Wealth Management LLC | 11.200 | 0,00 | 182 | -12,08 | ||||
| 2025-11-14 | 13F | Ariel Investments, Llc | 11.637 | 189 | ||||||
| 2026-01-13 | 13F | Mather Group, Llc. | 0 | -100,00 | 0 | |||||
| 2025-11-05 | 13F | Key FInancial Inc | 979 | 0,00 | 16 | -11,11 | ||||
| 2025-08-26 | NP | MASTER INVESTMENT PORTFOLIO - Total International ex U.S. Index Master Portfolio | 97.713 | 0,00 | 1.811 | 1,51 | ||||
| 2025-11-14 | 13F | Scientech Research LLC | 35.196 | 573 | ||||||
| 2025-11-14 | 13F | Tower Research Capital LLC (TRC) | 5.527 | -13,17 | 90 | -23,93 | ||||
| 2025-08-29 | NP | MPLAX - Praxis International Index Fund Class A | 305.124 | 4,43 | 5.654 | 6,02 | ||||
| 2026-01-09 | 13F | Park Place Capital Corp | 948 | 0,00 | 17 | 6,67 | ||||
| 2025-11-07 | 13F | May Hill Capital, LLC | 0 | -100,00 | 0 | |||||
| 2025-11-05 | 13F | Alps Advisors Inc | 81.787 | 15,38 | 1.331 | 1,29 | ||||
| 2025-10-16 | 13F | Regent Peak Wealth Advisors LLC | 0 | -100,00 | 0 | |||||
| 2025-11-07 | 13F | Sierra Ocean, Llc | 0 | -100,00 | 0 | |||||
| 2026-01-29 | 13F | Sanctuary Advisors, LLC | 36.080 | 23,12 | 643 | 34,87 | ||||
| 2026-02-02 | 13F | Mutual Advisors, LLC | 16.725 | 58,95 | 298 | 61,96 | ||||
| 2025-08-27 | NP | Brighthouse Funds Trust I - JPMorgan Global Active Allocation Portfolio Class B | 136.995 | 0,00 | 2.539 | 1,52 | ||||
| 2026-01-27 | 13F | TD Waterhouse Canada Inc. | 369 | -65,83 | 7 | -64,71 | ||||
| 2025-11-12 | 13F | Dimensional Fund Advisors Lp | 7.572.337 | 7,47 | 123.204 | -5,63 | ||||
| 2025-11-06 | 13F | Ameritas Advisory Services, LLC | 0 | -100,00 | 0 | -100,00 | ||||
| 2025-08-13 | 13F | Grantham, Mayo, Van Otterloo & Co. LLC | 0 | -100,00 | 0 | |||||
| 2026-01-28 | 13F | Klp Kapitalforvaltning As | 54.800 | 552,38 | 977 | 617,65 | ||||
| 2025-11-14 | 13F | National Bank Of Canada /fi/ | 12.413 | -12,39 | 202 | -23,28 | ||||
| 2025-08-28 | NP | SPGM - SPDR(R) Portfolio MSCI Global Stock Market ETF | 75.210 | 2,96 | 1.394 | 4,50 | ||||
| 2025-09-25 | NP | PRASX - T. Rowe Price New Asia Fund This fund is a listed as child fund of Price T Rowe Associates Inc /md/ and if that institution has disclosed ownership in this security, then these positions will not be double counted when calculating total shares and total value | 799.326 | -21,43 | 13.365 | -25,36 | ||||
| 2025-09-26 | NP | UUPIX - Ultraemerging Markets Profund Investor Class | 17.637 | 21,33 | 295 | 15,29 | ||||
| 2025-11-14 | 13F | Royal Bank Of Canada | 439.312 | -34,83 | 7.147 | -42,78 | ||||
| 2025-09-25 | NP | DFCEX - Emerging Markets Core Equity Portfolio - Institutional Class This fund is a listed as child fund of Dimensional Fund Advisors Lp and if that institution has disclosed ownership in this security, then these positions will not be double counted when calculating total shares and total value | 2.423.448 | 0,00 | 40.520 | -5,00 | ||||
| 2025-11-10 | 13F | D'Orazio & Associates, Inc. | 0 | -100,00 | 0 | -100,00 | ||||
| 2025-11-14 | 13F | Voloridge Investment Management, Llc | 466.902 | 7.596 | ||||||
| 2025-08-26 | NP | MASTER INVESTMENT PORTFOLIO - Active Stock Master Portfolio Active Stock Portfolio | 22.270 | -78,86 | 413 | -78,56 | ||||
| 2025-11-13 | 13F | Russell Investments Group, Ltd. | 2.815.732 | -9,04 | 45.929 | -19,89 | ||||
| 2025-09-25 | NP | EMRSX - JPMorgan Emerging Markets Research Enhanced Equity Fund Class R6 | 889.162 | -15,40 | 14.867 | -19,63 | ||||
| 2026-01-30 | 13F | R Squared Ltd | 35.025 | -65,70 | 624 | -62,43 | ||||
| 2026-01-23 | 13F | Ritholtz Wealth Management | 53.554 | 9,73 | 954 | 20,15 | ||||
| 2026-01-30 | 13F | Flossbach Von Storch Ag | 0 | -100,00 | 0 | |||||
| 2025-10-30 | 13F | CBOE Vest Financial, LLC | 0 | -100,00 | 0 | |||||
| 2025-08-22 | NP | XCEM - Columbia EM Core ex-China ETF | 876.773 | -3,49 | 16.247 | -2,01 | ||||
| 2026-02-04 | 13F | LRI Investments, LLC | 235 | 0,00 | 4 | 33,33 | ||||
| 2025-11-14 | 13F | Walleye Capital LLC | 0 | -100,00 | 0 | -100,00 | ||||
| 2025-08-21 | NP | MEMSX - Mercer Emerging Markets Equity Fund Class I | 301.433 | 0,00 | 5.586 | 1,53 | ||||
| 2026-01-09 | 13F | Somerset Trust Co | 16.515 | -1,04 | 294 | 8,49 | ||||
| 2026-01-23 | 13F | LOM Asset Management Ltd | 1.000 | 0,00 | 18 | 6,25 | ||||
| 2026-01-29 | 13F | IMC-Chicago, LLC | Put | 138.600 | -45,88 | 2.470 | -40,73 | |||
| 2026-01-29 | 13F | IMC-Chicago, LLC | Call | 52.800 | -39,79 | 941 | -34,08 | |||
| 2025-08-20 | NP | QTELX - AQR TM Emerging Multi-Style Fund Class I | 184.254 | -49,83 | 3.414 | -49,06 | ||||
| 2026-01-14 | 13F | Generali Investments CEE, investicni spolecnost, a.s. | 289.921 | 4,86 | 5.166 | 14,85 | ||||
| 2025-10-31 | 13F | First Citizens Bank & Trust Co | 30.501 | -3,47 | 496 | -15,21 | ||||
| 2025-11-07 | 13F | Synovus Financial Corp | 16.479 | -10,72 | 268 | -21,64 | ||||
| 2025-11-10 | 13F | Baldwin Investment Management, LLC | 74.840 | 0,00 | 1.218 | -12,19 | ||||
| 2025-11-03 | 13F | Federated Hermes, Inc. | 98.902 | 0,00 | 1.609 | -12,17 | ||||
| 2026-01-27 | 13F | WealthCollab, LLC | 3.239 | 4,55 | 58 | 14,00 | ||||
| 2025-11-14 | 13F | Tudor Financial Inc. | 22.270 | 0,00 | 362 | -12,14 | ||||
| 2025-11-14 | 13F | Peapack Gladstone Financial Corp | 39.026 | 5,98 | 1 | |||||
| 2026-01-15 | 13F | Foster & Motley Inc | 158.112 | -10,26 | 3 | 0,00 | ||||
| 2025-08-26 | NP | Profunds - Profund Vp Emerging Markets | 61.708 | 13,84 | 1.143 | 15,57 | ||||
| 2025-11-13 | 13F | Pinpoint Asset Management (Singapore) Pte. Ltd. | 935.797 | 47,23 | 15.225 | 29,28 | ||||
| 2026-01-26 | 13F | Haven Global Partners, LLC | 306.827 | 69,57 | 5.468 | 85,70 | ||||
| 2025-11-14 | 13F | Squarepoint Ops LLC | Call | 10.000 | 163 | |||||
| 2025-11-13 | 13F | Renaissance Technologies Llc | 53.200 | -98,30 | 866 | -98,51 | ||||
| 2025-09-29 | NP | TRFM - AAM Transformers ETF | 0 | -100,00 | 0 | -100,00 | ||||
| 2025-11-12 | 13F | Handelsbanken Fonder AB | 60.000 | -33,33 | 1 | -100,00 | ||||
| 2025-09-25 | NP | DEXC - Dimensional Emerging Markets ex China Core Equity ETF | 103.669 | 16,12 | 1.733 | 10,31 | ||||
| 2025-08-28 | NP | CWI - SPDR(R) MSCI ACWI EX-US ETF | 241.805 | -0,32 | 4.481 | 1,20 | ||||
| 2025-11-19 | 13F | Caitong International Asset Management Co., Ltd | 2.348 | 38 | ||||||
| 2025-09-24 | NP | NLSAX - Neuberger Berman Long Short Fund Class A | Short | -404.913 | -6.770 | |||||
| 2025-09-25 | NP | DFA INVESTMENT DIMENSIONS GROUP INC - Emerging Markets Social Core Equity Portfolio Shares | 87.126 | 0,00 | 1.457 | -5,02 | ||||
| 2025-09-24 | NP | CDAZX - Multi-Manager Directional Alternative Strategies Fund Institutional Class | Short | -18.298 | 5,96 | -306 | 0,66 | |||
| 2025-09-26 | NP | RTNAX - Tax-Managed International Equity Fund Class A | 63.951 | 0,00 | 1.069 | -4,98 | ||||
| 2026-02-04 | 13F | C WorldWide Group Holding A/S | 513.217 | -13,79 | 9 | 0,00 | ||||
| 2025-11-13 | 13F | Bnp Paribas Arbitrage, Sa | 3.684.257 | -21,39 | 59.943 | -30,98 | ||||
| 2025-11-14 | 13F | Moore Capital Management, Lp | 0 | -100,00 | 0 | |||||
| 2025-11-14 | 13F | Creative Planning | 858.810 | 22,33 | 13.973 | 7,40 | ||||
| 2025-11-06 | 13F | Freemont Capital Pte Ltd | 48.000 | 781 | ||||||
| 2025-09-25 | NP | PQEMX - PGIM QMA Emerging Markets Equity Fund Class R6 | 8.600 | 0,00 | 144 | -5,30 | ||||
| 2025-11-17 | 13F | GWM Advisors LLC | 49.563 | -30,09 | 806 | -38,61 | ||||
| 2025-11-14 | 13F | Goldman Sachs Group Inc | Put | 3.173.900 | 51.639 | |||||
| 2026-02-04 | 13F | ABN AMRO Bank N.V. | 36.000 | 0,00 | 639 | 9,61 | ||||
| 2025-09-25 | NP | DFA INVESTMENT DIMENSIONS GROUP INC - Emerging Markets Sustainability Core 1 Portfolio Institutional Class This fund is a listed as child fund of Dimensional Fund Advisors Lp and if that institution has disclosed ownership in this security, then these positions will not be double counted when calculating total shares and total value | 235.252 | -5,64 | 3.933 | -10,35 | ||||
| 2025-11-14 | 13F | Mercer Global Advisors Inc /adv | 19.146 | -4,95 | 312 | -16,62 | ||||
| 2025-08-21 | NP | IEQ - Lazard International Dynamic Equity ETF | 5.305 | 98 | ||||||
| 2025-11-14 | 13F | Rockefeller Capital Management L.P. | 8.940 | 145 | ||||||
| 2025-08-29 | NP | XSOE - WisdomTree Emerging Markets ex-State-Owned Enterprises Fund N/A | 818.993 | 4,80 | 15.176 | 6,41 | ||||
| 2026-01-29 | 13F | Resonant Capital Advisors, LLC | 0 | -100,00 | 0 | |||||
| 2026-01-29 | 13F | Deltec Asset Management Llc | 51.500 | -10,43 | 918 | -1,93 | ||||
| 2025-11-17 | 13F | Parvin Asset Management, LLC | 900 | 0,00 | 15 | -12,50 | ||||
| 2026-01-23 | 13F | Steigerwald, Gordon & Koch Inc. | 408 | 0,00 | 7 | 16,67 | ||||
| 2025-11-04 | 13F | Pineridge Advisors LLC | 300 | 0,00 | 5 | -20,00 | ||||
| 2025-11-14 | 13F | CI Private Wealth, LLC | 155.089 | 28,28 | 2.523 | 12,63 | ||||
| 2025-08-26 | NP | EQ ADVISORS TRUST - EQ/Global Equity Managed Volatility Portfolio Class IB | 169.482 | -3,30 | 3.141 | -1,81 | ||||
| 2025-11-14 | 13F | Quantinno Capital Management LP | 179.886 | -4,56 | 2.927 | -16,21 | ||||
| 2025-10-30 | 13F | Canopy Partners, LLC | 18.302 | 0,90 | 298 | -11,61 | ||||
| 2025-11-14 | 13F | Jain Global LLC | 186.984 | 112,83 | 3.042 | 86,97 | ||||
| 2026-01-16 | 13F | Banque Pictet & Cie Sa | 164.821 | -24,76 | 2.937 | -17,57 | ||||
| 2025-09-25 | NP | DFAX - Dimensional World ex U.S. Core Equity 2 ETF | 183.080 | 0,46 | 3.061 | -4,55 | ||||
| 2026-01-14 | 13F | Spire Wealth Management | 245 | 75,00 | 4 | 100,00 | ||||
| 2026-01-16 | 13F | Empirical Financial Services, LLC d.b.a. Empirical Wealth Management | 28.948 | 516 | ||||||
| 2025-10-31 | 13F | Nicola Wealth Management Ltd. | 822.000 | 20,88 | 13.373 | 6,13 | ||||
| 2025-09-29 | NP | SPWO - SP Funds S&P World (ex-US) ETF | 46.954 | 49,17 | 785 | 41,95 | ||||
| 2026-02-04 | 13F | Boyd Watterson Asset Management Llc/oh | 754 | 0,00 | 13 | 8,33 | ||||
| 2025-11-13 | 13F | Legal & General Group Plc | 934.923 | 4,05 | 15.207 | -8,65 | ||||
| 2025-10-15 | 13F | Vontobel Holding Ltd. | 393.392 | -35,50 | 6.400 | -43,37 | ||||
| 2025-10-21 | 13F | Rexford Capital Inc | 1.500 | 0,00 | 24 | -11,11 | ||||
| 2026-02-03 | 13F | Sumitomo Mitsui DS Asset Management Company, Ltd | 21.000 | 79,49 | 374 | 96,84 | ||||
| 2025-11-04 | 13F | Thrivent Financial For Lutherans | 438.607 | 7 | ||||||
| 2025-08-22 | NP | MGEMX - Emerging Markets Portfolio Class I | 388.915 | -1,94 | 7.207 | -0,44 | ||||
| 2025-11-03 | 13F | New York State Common Retirement Fund | 1.650.427 | -2,93 | 26.852 | -14,77 | ||||
| 2025-12-01 | 13F/A | Cantor Fitzgerald, L. P. | 0 | -100,00 | 0 | -100,00 | ||||
| 2025-11-06 | 13F | Profund Advisors Llc | 123.911 | 5,28 | 2.016 | -7,52 | ||||
| 2026-01-29 | 13F | UMA Financial Services, Inc. | 888 | 104,14 | 16 | 114,29 | ||||
| 2025-10-23 | 13F | Benjamin Edwards Inc | 0 | -100,00 | 0 | |||||
| 2025-11-14 | 13F | Centiva Capital, LP | 49.307 | 44,54 | 802 | 26,90 | ||||
| 2025-11-13 | 13F | FORA Capital, LLC | 59.407 | -52,13 | 967 | -57,98 | ||||
| 2026-02-03 | 13F | Maxi Investments CY Ltd | 31.000 | 1 | ||||||
| 2026-01-27 | 13F | Bayforest Capital Ltd | 26.355 | 470 | ||||||
| 2025-11-12 | 13F | Longfellow Investment Management Co Llc | 141.638 | 0,00 | 2.304 | -12,20 | ||||
| 2025-10-20 | 13F | Sivia Capital Partners, LLC | 21.812 | 7,44 | 355 | -5,85 | ||||
| 2025-11-10 | 13F | Hartland & Co., LLC | 800 | 13 | ||||||
| 2026-01-06 | 13F | Tucker Asset Management Llc | 0 | -100,00 | 0 | |||||
| 2025-11-05 | 13F | Smartleaf Asset Management LLC | 1.255 | 3.821,88 | 20 | |||||
| 2025-10-09 | 13F | Harbour Capital Advisors, LLC | 0 | -100,00 | 0 | |||||
| 2025-11-14 | 13F | Altrinsic Global Advisors Llc | 18.880 | -0,86 | 307 | -12,78 | ||||
| 2026-01-29 | 13F | Kestra Private Wealth Services, Llc | 42.686 | -3,71 | 761 | 5,41 | ||||
| 2025-11-05 | 13F | Envestnet Asset Management Inc | 704.769 | 8,06 | 11.467 | -5,12 | ||||
| 2026-01-27 | 13F | Novem Group | 64.083 | 11,66 | 1.142 | 22,29 | ||||
| 2026-02-03 | 13F | Mitsubishi UFJ Kokusai Asset Management Co., Ltd. | 0 | -100,00 | 0 | |||||
| 2025-11-06 | 13F | Haven Private, LLC | 51.785 | -4,69 | 843 | -16,30 | ||||
| 2026-01-28 | 13F | B. Metzler seel. Sohn & Co. AG | 482.863 | 109,24 | 8.620 | 129,60 | ||||
| 2025-11-13 | 13F | Bank Julius Baer & Co. Ltd, Zurich | 2.627.180 | -29,67 | 42.744 | -38,25 | ||||
| 2026-01-12 | 13F | E. Ohman J:or Asset Management AB | 260.300 | 14,02 | 4.639 | 24,88 | ||||
| 2025-11-13 | 13F | Vise Technologies, Inc. | 96.940 | -32,26 | 1.577 | -40,51 | ||||
| 2025-08-27 | NP | Advanced Series Trust - Ast J.p. Morgan Strategic Opportunities Portfolio | 168.064 | -2,28 | 3.114 | -0,76 | ||||
| 2025-11-14 | 13F | Lazard Asset Management Llc | 19.240.608 | 340,18 | 313.045 | 391.205,00 | ||||
| 2025-11-14 | 13F | Wahed Invest LLC | 63.437 | 6,08 | 1.032 | -6,86 | ||||
| 2025-11-14 | 13F | Earnest Partners Llc | 136.032 | 1,43 | 2.213 | -10,95 | ||||
| 2025-11-12 | 13F | Group One Trading, L.p. | Put | 16.700 | -40,78 | 272 | -48,08 | |||
| 2026-01-22 | 13F | Trinity Street Asset Management LLP | 10.263.804 | -1,98 | 182.901 | 7,35 | ||||
| 2025-11-07 | 13F | HighTower Advisors, LLC | 155.367 | 29,72 | 2.528 | 13,88 | ||||
| 2026-02-03 | 13F | Birch Capital Management, LLC | 265.532 | -4,04 | 4.732 | 5,09 | ||||
| 2025-11-12 | 13F | IAG Wealth Partners, LLC | 496 | 0,00 | 8 | -11,11 | ||||
| 2025-11-14 | 13F | Prudential Plc | 149.000 | -89,24 | 2.424 | -90,55 | ||||
| 2025-10-22 | 13F | Commonwealth Equity Services, Llc | 43.214 | -1,93 | 1 | |||||
| 2025-11-12 | 13F | Group One Trading, L.p. | Call | 308.800 | 36,70 | 5.024 | 20,05 | |||
| 2025-08-14 | 13F | Graham Capital Management, L.P. | 0 | -100,00 | 0 | |||||
| 2026-01-16 | 13F | Perigon Wealth Management, LLC | 12.961 | 231 | ||||||
| 2026-01-15 | 13F | J. Safra Sarasin Holding AG | 10.470 | 0,00 | 183 | 5,20 | ||||
| 2025-08-26 | NP | GEMYX - Emerging Markets Equity Fund Institutional | 264.347 | 6,32 | 4.898 | 7,96 | ||||
| 2025-11-14 | 13F | DRW Securities, LLC | 109.664 | 1.750 | ||||||
| 2025-11-14 | 13F | XTX Topco Ltd | 123.715 | -36,78 | 2.013 | -44,50 | ||||
| 2025-11-14 | 13F | DRW Securities, LLC | Put | 135.000 | 2.155 | |||||
| 2025-08-25 | NP | CIBR - First Trust NASDAQ Cybersecurity ETF This fund is a listed as child fund of First Trust Advisors Lp and if that institution has disclosed ownership in this security, then these positions will not be double counted when calculating total shares and total value | 41.706.836 | 27,54 | 772.828 | 29,49 | ||||
| 2025-11-14 | 13F | Axa S.a. | 0 | -100,00 | 0 | |||||
| 2025-11-12 | 13F | American Century Companies Inc | 4.688.779 | 5,54 | 76.286 | -7,33 | ||||
| 2025-11-10 | 13F | Vestmark Advisory Solutions, Inc. | 13.757 | -19,88 | 224 | -29,87 | ||||
| 2025-11-13 | 13F | Quadrant Capital Group Llc | 286.211 | 32,13 | 4.657 | 16,02 | ||||
| 2025-11-14 | 13F | Engineers Gate Manager LP | 87.702 | 309,46 | 1.427 | 260,10 | ||||
| 2025-11-21 | 13F | Ovata Capital Management Ltd | 145.069 | -87,50 | 2.361 | -89,11 | ||||
| 2025-08-07 | 13F | Campbell & CO Investment Adviser LLC | 0 | -100,00 | 0 | |||||
| 2025-08-14 | 13F | CoreCap Advisors, LLC | 0 | -100,00 | 0 | |||||
| 2025-11-26 | 13F/A | Jpmorgan Chase & Co | 35.236.432 | -12,58 | 573.297 | -23,24 | ||||
| 2025-09-25 | NP | VMNVX - Vanguard Global Minimum Volatility Fund Admiral Shares | 648.502 | -35,16 | 10.843 | -38,40 | ||||
| 2025-09-26 | NP | AEMGX - Acadian Emerging Markets Portfolio Investor Class Shares | 726.047 | 23,62 | 12.140 | 17,43 | ||||
| 2026-01-14 | 13F | Centurion Wealth Management LLC | 13.000 | 0,00 | 232 | 9,48 | ||||
| 2025-11-04 | 13F | Allianz Asset Management GmbH | 514.053 | -30,93 | 8.364 | -39,35 | ||||
| 2025-11-21 | 13F | Bell Investment Advisors, Inc | 663 | -15,65 | 11 | -28,57 | ||||
| 2025-10-27 | 13F | Td Private Client Wealth Llc | 7.266 | -43,77 | 118 | -50,63 | ||||
| 2025-11-10 | 13F | Citigroup Inc | 1.072.217 | 10,43 | 17.445 | -3,04 | ||||
| 2025-11-12 | 13F | Fisher Asset Management, LLC | 8.954.374 | -0,38 | 145.688 | -12,53 | ||||
| 2025-08-13 | 13F | Townsquare Capital Llc | 0 | -100,00 | 0 | |||||
| 2025-11-14 | 13F | Jane Street Group, Llc | Call | 97.400 | 532,47 | 1.585 | 455,79 | |||
| 2025-11-13 | 13F | Parallel Advisors, LLC | 54.127 | -7,29 | 881 | -18,59 | ||||
| 2026-01-08 | 13F | Wealth Enhancement Advisory Services, Llc | 95.776 | 1,09 | 1.734 | 11,66 | ||||
| 2025-11-14 | 13F | Jane Street Group, Llc | 86.216 | -94,45 | 1.403 | -95,13 | ||||
| 2026-01-08 | 13F | Tuttle Tactical Management LLC | 14.959 | 267 | ||||||
| 2025-08-27 | NP | TPIAX - Timothy Plan International Fund Class A | 86.000 | 0,00 | 1.594 | 1,53 | ||||
| 2025-08-28 | NP | SPEM - SPDR(R) Portfolio Emerging Markets ETF | 4.647.644 | 8,77 | 86.121 | 10,44 | ||||
| 2025-11-12 | 13F | Erste Asset Management GmbH | 100.000 | -26,85 | 1.632 | -35,57 | ||||
| 2025-08-14 | 13F | SummitTX Capital, L.P. | 0 | -100,00 | 0 | |||||
| 2025-11-13 | 13F | FIL Ltd | 7.547.537 | -2,73 | 122.798 | -14,59 | ||||
| 2025-11-13 | 13F | Panagora Asset Management Inc | 1.792.918 | 8,52 | 29.171 | -4,71 | ||||
| 2025-11-14 | 13F | Jane Street Group, Llc | Put | 329.000 | 119,04 | 5.353 | 92,31 | |||
| 2025-11-14 | 13F | Millennium Management Llc | Put | 15.000 | 244 | |||||
| 2025-11-14 | 13F | Chevy Chase Trust Holdings, Inc. | 0 | -100,00 | 0 | |||||
| 2025-11-14 | 13F | Millennium Management Llc | 9.692.263 | -30,89 | 157.693 | -39,32 | ||||
| 2025-10-20 | 13F | HighMark Wealth Management LLC | 0 | -100,00 | 0 | |||||
| 2025-08-14 | 13F | Bayesian Capital Management, LP | 0 | -100,00 | 0 | |||||
| 2025-10-31 | 13F | Whittier Trust Co | 0 | -100,00 | 0 | -100,00 | ||||
| 2025-11-13 | 13F | Infini Capital Management Ltd | 0 | -100,00 | 0 | -100,00 | ||||
| 2025-11-14 | 13F | Advisor Group Holdings, Inc. | 127.998 | 19,70 | 2.136 | 7,88 | ||||
| 2025-08-21 | NP | GLIN - VanEck Vectors India Small-Cap Index ETF | 301.533 | -6,53 | 5.587 | -5,10 | ||||
| 2026-01-23 | 13F | Farther Finance Advisors, LLC | 15.596 | 36,17 | 278 | 48,92 | ||||
| 2025-11-14 | 13F | Virtu Financial LLC | 32.398 | 1 | ||||||
| 2025-11-14 | 13F | MIRAE ASSET GLOBAL ETFS HOLDINGS Ltd. | 155.509 | 20,42 | 2.530 | 5,77 | ||||
| 2025-11-05 | 13F | Savant Capital, LLC | 13.217 | -24,00 | 215 | -33,23 | ||||
| 2025-08-22 | NP | MSDMX - Sustainable Emerging Markets Portfolio Class R6 | 3.149 | 0,00 | 58 | 1,75 | ||||
| 2025-11-12 | 13F | Redwood Financial Network Corp | 10.151 | 165 | ||||||
| 2025-11-03 | 13F | Hollencrest Capital Management | 304 | 0,00 | 5 | -20,00 | ||||
| 2025-08-26 | NP | VIRTUS VARIABLE INSURANCE TRUST - Virtus SGA International Growth Series Class A | 169.590 | 0,00 | 3.143 | 1,52 | ||||
| 2026-01-21 | 13F | Runnymede Capital Advisors, Inc. | 50.061 | 892 | ||||||
| 2025-11-14 | 13F | Ardsley Advisory Partners Lp | Put | 140.000 | 2.278 | |||||
| 2025-09-25 | NP | HFIGX - Hartford Schroders Diversified Growth Fund Class I | 4.010 | -1,98 | 67 | -6,94 | ||||
| 2025-09-26 | NP | PID - Invesco International Dividend Achievers ETF This fund is a listed as child fund of Invesco Ltd. and if that institution has disclosed ownership in this security, then these positions will not be double counted when calculating total shares and total value | 845.238 | 14,03 | 14.132 | 8,33 | ||||
| 2025-08-27 | NP | ADVANCED SERIES TRUST - AST T. Rowe Price Growth Opportunities Portfolio | 225.524 | -12,08 | 4.179 | -10,75 | ||||
| 2025-11-06 | 13F | Whipplewood Advisors, LLC | 0 | -100,00 | 0 | |||||
| 2025-10-30 | 13F | Covestor Ltd | Put | 4 | 0,00 | 0 | ||||
| 2025-11-13 | 13F | Blueshift Asset Management, LLC | 0 | -100,00 | 0 | -100,00 | ||||
| 2025-08-27 | NP | RMEAX - Aspiriant Risk-Managed Equity Allocation Fund Advisor Shares | 23.304 | -55,10 | 432 | -54,49 | ||||
| 2025-11-14 | 13F | Aspen Grove Capital, LLC | 23.331 | 380 | ||||||
| 2026-01-23 | 13F | BSW Wealth Partners | 35.632 | 28,92 | 635 | 41,20 | ||||
| 2025-11-14 | 13F/A | Skopos Labs, Inc. | 40.486 | 0,17 | 750 | 0,13 | ||||
| 2025-09-24 | NP | BLACKROCK FUNDS - BlackRock Advantage Emerging Markets Fund Investor A Shares | 2.306 | -86,12 | 39 | -86,99 | ||||
| 2025-11-05 | 13F | Bessemer Group Inc | 959.370 | 24,40 | 16 | 7,14 | ||||
| 2026-01-15 | 13F | Range Financial Group LLC | 32.768 | 3,05 | 584 | 12,77 | ||||
| 2025-11-13 | 13F | Bank Of Montreal /can/ | 7.602.825 | 32.129,02 | 123.698 | 28.205,95 | ||||
| 2026-01-27 | 13F | Human Investing LLC | 18.119 | -4,05 | 323 | 4,89 | ||||
| 2025-11-10 | 13F | Raiffeisen Bank International AG | 239.464 | -5,06 | 3.908 | -16,28 | ||||
| 2025-08-28 | NP | SSGVX - State Street Global Equity ex-U.S. Index Portfolio State Street Global All Cap Equity ex-U.S. Index Portfolio This fund is a listed as child fund of State Street Corp and if that institution has disclosed ownership in this security, then these positions will not be double counted when calculating total shares and total value | 82.199 | -14,34 | 1.523 | -13,02 | ||||
| 2025-11-06 | 13F | Westover Capital Advisors, LLC | 0 | -100,00 | 0 | |||||
| 2025-08-14 | 13F | Hrt Financial Lp | 0 | -100,00 | 0 | |||||
| 2026-01-15 | 13F | LeConte Wealth Management, LLC | 22.066 | 9,75 | 393 | 20,18 | ||||
| 2025-08-13 | 13F | Congress Wealth Management LLC / DE / | 42.294 | 94,07 | 784 | 97,23 | ||||
| 2025-11-13 | 13F | Deutsche Bank Ag\ | 14.914.722 | -5,95 | 242.663 | -17,42 | ||||
| 2025-10-30 | 13F | Outlook Wealth Advisors, LLC | 18.505 | 0,21 | 301 | -11,99 | ||||
| 2025-11-10 | 13F | EverSource Wealth Advisors, LLC | 5.298 | -13,09 | 86 | -23,21 | ||||
| 2025-11-14 | 13F | Sculptor Capital LP | Call | 194.000 | 3.156 | |||||
| 2026-02-03 | 13F | McIlrath & Eck, LLC | 0 | -100,00 | 0 | |||||
| 2025-09-25 | NP | MFWTX - MFS Global Total Return Fund A | 72.306 | -1,24 | 1.209 | -6,21 | ||||
| 2025-08-27 | NP | RYDEX VARIABLE TRUST - Technology Fund Variable Annuity | 8.791 | 61,69 | 163 | 63,64 | ||||
| 2025-08-28 | NP | GMF - SPDR(R) S&P(R) EMERGING ASIA PACIFIC ETF | 169.505 | -6,51 | 3.141 | -5,08 | ||||
| 2026-02-03 | 13F | Ethic Inc. | 252.179 | 17,69 | 4.494 | 28,89 | ||||
| 2025-11-14 | 13F | Sculptor Capital LP | Put | 268.900 | 4.375 | |||||
| 2025-11-13 | 13F | Fmr Llc | 158.424 | -87,59 | 2.578 | -89,10 | ||||
| 2025-08-29 | NP | FRDM - Freedom 100 Emerging Markets ETF | 131.908 | 16,69 | 2.444 | 18,53 | ||||
| 2025-11-14 | 13F | Sculptor Capital LP | 269.900 | 4.391 | ||||||
| 2025-11-13 | 13F | Aviva Plc | 109.560 | -22,78 | 1.783 | -32,22 | ||||
| 2025-11-14 | 13F | Verition Fund Management LLC | 148.168 | -79,86 | 2.411 | -82,32 | ||||
| 2025-11-12 | 13F | Group One Trading, L.p. | 0 | -100,00 | 0 | -100,00 | ||||
| 2025-11-12 | 13F | Itau Unibanco Holding S.A. | 30.382 | 22,60 | 494 | 7,63 | ||||
| 2025-11-20 | 13F | Ariadne Wealth Management, LP | 0 | -100,00 | 0 | |||||
| 2025-11-14 | 13F | Colony Group, LLC | 39.736 | -7,24 | 647 | -18,54 | ||||
| 2026-02-03 | 13F | Crossmark Global Holdings, Inc. | 1.018.790 | 1,59 | 18.155 | 11,27 | ||||
| 2025-11-03 | 13F | Private Wealth Asset Management, LLC | 3.375 | 0,00 | 55 | -12,90 | ||||
| 2025-11-19 | 13F | Coldstream Capital Management Inc | 16.897 | 275 | ||||||
| 2025-11-12 | 13F | Artisan Partners Limited Partnership | 75.386 | 0,00 | 1.227 | -12,18 | ||||
| 2025-11-14 | 13F | Voleon Capital Management Lp | 74.011 | 1.204 | ||||||
| 2025-11-14 | 13F | Vident Advisory, LLC | 156.938 | -2,92 | 2.553 | -14,76 | ||||
| 2025-08-14 | 13F | Old Mission Capital Llc | 0 | -100,00 | 0 | -100,00 | ||||
| 2025-11-05 | 13F | Triglav Skladi, D.o.o. | 53.130 | -39,71 | 864 | -47,09 | ||||
| 2025-11-13 | 13F | Acadian Asset Management Llc | 32.360.853 | 11,71 | 526 | -1,87 | ||||
| 2025-08-28 | NP | DGT - SPDR(R) Global Dow ETF This fund is a listed as child fund of State Street Corp and if that institution has disclosed ownership in this security, then these positions will not be double counted when calculating total shares and total value | 100.715 | 20,84 | 1.866 | 22,68 | ||||
| 2026-01-05 | 13F | GAMMA Investing LLC | 7.199 | 19,29 | 128 | 30,61 | ||||
| 2025-11-14 | 13F | Ieq Capital, Llc | 88.071 | 62,59 | 1.433 | 42,77 | ||||
| 2026-01-29 | 13F | Rakuten Securities, Inc. | 778 | 40,43 | 14 | 44,44 | ||||
| 2026-01-26 | 13F | Merit Financial Group, LLC | 34.506 | 6,97 | 615 | 17,18 | ||||
| 2025-08-13 | 13F | Continuum Advisory, LLC | 0 | -100,00 | 0 | |||||
| 2025-09-25 | NP | JADE - JPMorgan Active Developing Markets Equity ETF | 4.106 | 0,00 | 69 | -5,56 | ||||
| 2026-01-21 | 13F | Seed Wealth Management, Inc. | 13.950 | 0,00 | 249 | 9,73 | ||||
| 2026-01-21 | 13F | Carolina Wealth Advisors, LLC | 332.726 | -1,74 | 5.929 | 7,62 | ||||
| 2025-11-10 | 13F | Nkcfo Llc | 0 | -100,00 | 0 | |||||
| 2025-11-14 | 13F | Larson Financial Group LLC | 167 | 28,46 | 3 | 0,00 | ||||
| 2025-09-25 | NP | VT - Vanguard Total World Stock Index Fund ETF Shares | 453.806 | 0,00 | 7.588 | -5,00 | ||||
| 2025-11-13 | 13F/A | Peak6 Llc | Put | 0 | -100,00 | 0 | -100,00 | |||
| 2026-01-26 | 13F | Clean Yield Group | 254 | 0,00 | 5 | 0,00 | ||||
| 2025-11-12 | 13F | Cambridge Investment Research Advisors, Inc. | 0 | -100,00 | 0 | |||||
| 2025-09-25 | NP | VEIEX - Vanguard Emerging Markets Stock Index Fund Investor Shares | 15.996 | -94,54 | 267 | -90,49 | ||||
| 2026-01-27 | 13F | Hgk Asset Management Inc | 2.845.690 | 1,32 | 50.710 | 10,98 | ||||
| 2025-10-20 | 13F | Hennessy Advisors Inc | 0 | -100,00 | 0 | |||||
| 2025-10-27 | 13F | RWC Asset Management LLP | 0 | -100,00 | 0 | |||||
| 2025-08-22 | NP | Fidelity Central Investment Portfolios LLC - Fidelity Emerging Markets Equity Central Fund This fund is a listed as child fund of Fmr Llc and if that institution has disclosed ownership in this security, then these positions will not be double counted when calculating total shares and total value | 90.664 | -63,04 | 1.680 | -62,47 | ||||
| 2025-11-04 | 13F | Umb Bank N A/mo | 3.061 | 5,92 | 50 | -7,55 | ||||
| 2026-01-29 | 13F | Sava Infond d.o.o. | 40.000 | 0,00 | 713 | 9,54 | ||||
| 2025-08-06 | 13F | First Horizon Advisors, Inc. | 537 | -21,72 | 10 | -25,00 | ||||
| 2026-01-07 | 13F | Harbor Investment Advisory, Llc | 17.737 | 275,70 | 316 | 315,79 | ||||
| 2025-10-17 | 13F | Matthews International Capital Management Llc | 0 | -100,00 | 0 | |||||
| 2025-11-14 | 13F | LMR Partners LLP | 587.054 | -89,76 | 9.551 | -91,01 | ||||
| 2025-08-28 | NP | CEMVX - Causeway Emerging Markets Fund Investor Class | 0 | -100,00 | 0 | -100,00 | ||||
| 2025-10-30 | 13F | Twin Peaks Wealth Advisors, LLC | 0 | -100,00 | 0 | |||||
| 2025-11-14 | 13F | Snowden Capital Advisors LLC | 20.303 | -0,49 | 330 | -13,84 | ||||
| 2025-08-26 | NP | HEMZX - Virtus Vontobel Emerging Markets Opportunities Fund Class A | 1.548.349 | 22,37 | 28.691 | 24,24 | ||||
| 2026-01-23 | 13F | Westside Investment Management, Inc. | 2.108 | 0,00 | 38 | 11,76 | ||||
| 2026-01-30 | 13F | North Star Investment Management Corp. | 610 | 1.933,33 | 11 | |||||
| 2025-08-20 | NP | NATIONWIDE VARIABLE INSURANCE TRUST - NVIT GS Emerging Markets Equity Insights Fund Class Y | 424.425 | -11,31 | 7.865 | -9,95 | ||||
| 2025-11-12 | 13F | Huntington National Bank | 547 | -89,94 | 9 | -92,00 | ||||
| 2025-11-10 | 13F | MAI Capital Management | 27.454 | -24,88 | 447 | -34,12 | ||||
| 2026-01-16 | 13F | Ronald Blue Trust, Inc. | 36.098 | 28,08 | 643 | 40,39 | ||||
| 2025-11-14 | 13F | StoneX Group Inc. | 14.961 | -16,17 | 243 | -26,36 | ||||
| 2025-08-26 | NP | JOEMX - JOHCM Emerging Markets Opportunities Fund Class Z Shares | 233.519 | 0,00 | 4.327 | 1,55 | ||||
| 2025-11-13 | 13F | Sei Investments Co | 3.153.271 | 36,03 | 51.304 | 19,44 | ||||
| 2025-09-25 | NP | GAOAX - JPMorgan Global Allocation Fund Class A | 66.592 | -57,42 | 1.113 | -59,56 | ||||
| 2026-01-21 | 13F | Yousif Capital Management, Llc | 32.614 | 0,00 | 594 | 11,89 | ||||
| 2025-11-12 | 13F | Northwest & Ethical Investments L.P. | 0 | -100,00 | 0 | -100,00 | ||||
| 2025-08-11 | 13F | Synergy Investment Management, LLC | 0 | -100,00 | 0 | |||||
| 2025-11-12 | 13F | Victory Capital Management Inc | 0 | -100,00 | 0 | |||||
| 2025-11-14 | 13F | Sandler Capital Management | Put | 32.800 | 534 | |||||
| 2025-08-25 | NP | EMSQX - Shelton Emerging Markets Fund Institutional Shares | 10.400 | 0,00 | 193 | 1,59 | ||||
| 2025-11-13 | 13F | Baird Financial Group, Inc. | 131.762 | 3,11 | 2.144 | -9,46 | ||||
| 2025-08-29 | NP | JVANX - International Equity Index Trust NAV | 114.159 | 3,23 | 2.115 | 4,81 | ||||
| 2025-11-14 | 13F | Evelyn Partners Investment Management LLP | 12.600 | 0,00 | 205 | -12,02 | ||||
| 2025-11-13 | 13F | Employees Retirement System of Texas | 176.151 | -6,68 | 3 | -33,33 | ||||
| 2025-08-14 | 13F | XY Capital Ltd | 0 | -100,00 | 0 | |||||
| 2025-11-14 | 13F | Man Group plc | 7.014.907 | 1,60 | 114.133 | -10,79 | ||||
| 2025-11-14 | 13F | Mml Investors Services, Llc | 14.085 | -11,44 | 229 | |||||
| 2025-11-14 | 13F | Northwestern Mutual Wealth Management Co | 24.636 | 1,97 | 401 | -10,51 | ||||
| 2025-08-26 | NP | SBHEX - Segall Bryant & Hamill Emerging Markets Fund Retail Class | 46.600 | 0,00 | 863 | 1,53 | ||||
| 2026-01-09 | 13F | Marshall Financial Group LLC | 63.540 | -6,97 | 1.132 | 1,89 | ||||
| 2026-01-14 | 13F | Jfs Wealth Advisors, Llc | 1.762 | 17,62 | 31 | 29,17 | ||||
| 2025-11-14 | 13F | Northern Trust Corp | 3.602.075 | 0,84 | 58.606 | -11,46 | ||||
| 2025-08-19 | 13F | Asset Dedication, LLC | 0 | -100,00 | 0 | |||||
| 2025-08-26 | NP | FVD - First Trust Value Line Dividend Index Fund This fund is a listed as child fund of First Trust Advisors Lp and if that institution has disclosed ownership in this security, then these positions will not be double counted when calculating total shares and total value | 2.084.321 | -5,07 | 38.622 | -3,61 | ||||
| 2025-11-12 | 13F | Xponance, Inc. | 13.750 | 6,45 | 224 | -6,69 | ||||
| 2025-11-14 | 13F | Sustainable Growth Advisers, LP | 10.889.185 | -25,15 | 177.167 | -34,27 | ||||
| 2025-11-13 | 13F | O'shaughnessy Asset Management, Llc | 375.846 | -9,84 | 6.115 | -20,83 | ||||
| 2025-08-25 | NP | MML SERIES INVESTMENT FUND - MML International Equity Fund Class II | 35.417 | 1,18 | 656 | 2,82 | ||||
| 2026-02-02 | 13F | Strs Ohio | 147.000 | -26,74 | 2.620 | -19,76 | ||||
| 2025-11-14 | 13F | Susquehanna International Group, Llp | Call | 295.900 | -27,15 | 4.814 | -36,04 | |||
| 2025-11-14 | 13F | Susquehanna International Group, Llp | Put | 1.352.300 | 2.297,70 | 22.002 | 2.005,36 | |||
| 2025-09-26 | NP | FEMSX - Fidelity Series Emerging Markets Opportunities Fund This fund is a listed as child fund of Fmr Llc and if that institution has disclosed ownership in this security, then these positions will not be double counted when calculating total shares and total value | 0 | -100,00 | 0 | -100,00 | ||||
| 2025-08-12 | 13F | Wayfinding Financial, LLC | 0 | -100,00 | 0 | |||||
| 2025-08-25 | 13F/A | Kovitz Investment Group Partners, LLC | 10.467 | 5,86 | 229 | 11,17 | ||||
| 2025-11-12 | 13F | Brinker Capital Investments, LLC | 33.959 | 84,11 | 553 | 61,88 | ||||
| 2025-10-10 | 13F | Sound Income Strategies, LLC | 0 | -100,00 | 0 | -100,00 | ||||
| 2025-11-13 | 13F | Jump Financial, LLC | 15.496 | -94,87 | 252 | -95,50 | ||||
| 2025-10-17 | 13F | Bard Financial Services, Inc. | 124.340 | 0,00 | 2.023 | -12,20 | ||||
| 2026-01-26 | 13F | Private Trust Co Na | 0 | -100,00 | 0 | |||||
| 2025-11-10 | 13F | AMJ Financial Wealth Management | 0 | -100,00 | 0 | -100,00 | ||||
| 2025-11-18 | 13F | Advisory Services Network, LLC | 2.768 | 45 | ||||||
| 2026-01-12 | 13F | CVA Family Office, LLC | 13.000 | 0,00 | 232 | 9,48 | ||||
| 2025-09-26 | NP | TDVI - FT Vest Technology Dividend Target Income ETF | 24.154 | 35,13 | 404 | 28,34 | ||||
| 2026-01-12 | 13F | Foster Group, Inc. | 13.642 | 15,05 | 243 | 26,56 | ||||
| 2025-08-14 | 13F | Janus Henderson Group Plc | 0 | -100,00 | 0 | |||||
| 2026-01-29 | 13F | Munich Reinsurance Co Stock Corp in Munich | 525.854 | 408,56 | 9.486 | 463,97 | ||||
| 2025-11-12 | 13F | HAP Trading, LLC | Put | 140.700 | 113 | |||||
| 2025-11-14 | 13F | Bridgefront Capital, LLC | 20.451 | -26,25 | 333 | -35,28 | ||||
| 2025-11-14 | 13F | Aigen Investment Management, Lp | 57.283 | 101,10 | 932 | 76,66 | ||||
| 2025-09-25 | NP | Thrivent Core Funds - Thrivent Core Emerging Markets Equity Fund | 293.906 | 192,53 | 4.914 | 177,94 | ||||
| 2026-01-29 | 13F | UBS Group AG | Put | 292.500 | 5.212 | |||||
| 2025-09-10 | NP | Putnam ETF Trust - Putnam PanAgora ESG Emerging Markets Equity ETF - | 54.216 | 9,37 | 906 | 3,90 | ||||
| 2026-01-29 | 13F | UBS Group AG | Call | 193.167 | -45,17 | 3.442 | -39,95 | |||
| 2025-11-12 | 13F | HAP Trading, LLC | 18.878 | 307 | ||||||
| 2026-01-08 | 13F | Adirondack Trust Co | 300 | 0,00 | 5 | 25,00 | ||||
| 2026-01-29 | 13F | UBS Group AG | 17.782.859 | -12,80 | 316.891 | -4,50 | ||||
| 2025-08-25 | NP | ASIA - Matthews Pacific Tiger Active ETF | 3.738 | -37,44 | 69 | -36,70 | ||||
| 2025-08-25 | NP | LEGR - First Trust Indxx Innovative Transaction & Process ETF This fund is a listed as child fund of First Trust Advisors Lp and if that institution has disclosed ownership in this security, then these positions will not be double counted when calculating total shares and total value | 71.035 | 5,38 | 1.316 | 6,99 | ||||
| 2025-11-14 | 13F | Toronto Dominion Bank | 500.000 | 8.135 | ||||||
| 2026-01-15 | 13F | Nisa Investment Advisors, Llc | 2.454 | 44 | ||||||
| 2026-01-26 | 13F | Cwm, Llc | 315.463 | -0,20 | 6 | 0,00 | ||||
| 2025-11-13 | 13F | Rehmann Capital Advisory Group | 10.051 | -6,52 | 164 | -18,09 | ||||
| 2025-11-12 | 13F | BlackRock, Inc. | 17.487.925 | 22,97 | 284.529 | 7,97 | ||||
| 2026-02-02 | 13F | Farmers & Merchants Trust Co of Chambersburg PA | 700 | 0,00 | 0 | |||||
| 2025-11-14 | 13F | Ameriprise Financial Inc | 2.012.458 | -6,79 | 32.729 | -18,20 | ||||
| 2025-11-14 | 13F | Toroso Investments, LLC | 36.034 | 0,31 | 586 | -11,88 | ||||
| 2026-01-22 | 13F | Financial Consulate, Inc | 95 | 2 | ||||||
| 2026-02-03 | 13F | BHK Investment Advisors, LLC | 0 | -100,00 | 0 | |||||
| 2025-11-14 | 13F | Genus Capital Management Inc. | 27.000 | 28,57 | 439 | 12,85 | ||||
| 2025-11-03 | 13F | Summit Global Investments | 0 | -100,00 | 0 | |||||
| 2026-01-23 | 13F | Assetmark, Inc | 31.404 | -33,96 | 560 | -27,68 | ||||
| 2026-01-30 | 13F | Us Bancorp \de\ | 142.687 | -50,27 | 2.543 | -45,54 | ||||
| 2025-08-05 | 13F | Burney Co/ | 0 | -100,00 | 0 | |||||
| 2025-08-28 | NP | JINTX - Johnson International Fund | 17.800 | 0,00 | 330 | 1,54 | ||||
| 2025-11-13 | 13F | Marshall Wace, Llp | 2.085.961 | -54,00 | 33.939 | -59,61 | ||||
| 2026-01-29 | 13F | Vanguard Group Inc | 3.745.869 | -4,71 | 66.751 | 4,37 | ||||
| 2025-11-13 | 13F | Capital Fund Management S.a. | 55.187 | -94,19 | 898 | -94,90 | ||||
| 2025-08-26 | NP | JDVSX - JPMorgan Diversified Fund Class I | 27.924 | -33,28 | 517 | -32,24 | ||||
| 2026-01-21 | 13F | Naviter Wealth, LLC | 73.080 | -13,50 | 1.302 | -5,24 | ||||
| 2025-11-12 | 13F | Neuberger Berman Group LLC | 247.781 | 2,55 | 4.031 | -9,96 | ||||
| 2026-02-02 | 13F | Fifth Third Bancorp | 2.000 | 0,00 | 36 | 9,38 | ||||
| 2025-11-13 | 13F | Causeway Capital Management Llc | 283.927 | 0,00 | 4.619 | -12,20 | ||||
| 2026-01-15 | 13F | Allspring Global Investments Holdings, LLC | 1.459.899 | 4,04 | 26.497 | 15,35 | ||||
| 2025-11-07 | 13F | Beacon Capital Management, LLC | 0 | -100,00 | 0 | |||||
| 2025-11-07 | 13F | Comgest Global Investors S.a.s. | 61.229 | -37,45 | 996 | -45,06 | ||||
| 2025-11-14 | 13F | New Vernon Capital Holdings II LLC | 336.718 | -50,18 | 5.478 | -56,26 | ||||
| 2025-11-14 | 13F | Capula Management Ltd | Call | 1.000 | 16 | |||||
| 2025-09-18 | NP | ABLG - TrimTabs All Cap International Free-Cash-Flow ETF | 50.252 | -15,50 | 840 | -19,69 | ||||
| 2025-11-14 | 13F | Capula Management Ltd | 100.402 | 88,40 | 1.634 | 65,45 | ||||
| 2025-10-22 | 13F | InTrack Investment Management Inc | 0 | -100,00 | 0 | |||||
| 2025-11-12 | 13F | Corient IA LLC | 15.000 | 0,00 | 244 | -11,91 | ||||
| 2026-01-27 | 13F | GHP Investment Advisors, Inc. | 12.600 | 0,00 | 225 | 9,27 | ||||
| 2025-11-05 | 13F | Hantz Financial Services, Inc. | 45.459 | 138,33 | 1 | |||||
| 2025-11-13 | 13F | Capital Fund Management S.a. | Put | 42.500 | -64,79 | 691 | -69,10 | |||
| 2025-11-13 | 13F | Capital Fund Management S.a. | Call | 84.100 | 23,68 | 1.368 | 8,57 | |||
| 2026-01-26 | 13F | Mirae Asset Global Investments Co., Ltd. | 124.990 | -16,16 | 2.227 | -8,16 | ||||
| 2025-09-25 | NP | TWAAX - Thrivent International Allocation Fund Class A | 39.857 | 192,83 | 666 | 178,66 | ||||
| 2026-01-20 | 13F | Signaturefd, Llc | 95.366 | 4,63 | 1.699 | 14,64 | ||||
| 2025-11-13 | 13F | Private Advisor Group, LLC | 22.751 | 11,43 | 370 | -2,12 | ||||
| 2026-01-21 | 13F | Prime Capital Investment Advisors, LLC | 0 | -100,00 | 0 | |||||
| 2026-01-05 | 13F | Confluence Investment Management Llc | 14.139 | 0,00 | 252 | 9,13 | ||||
| 2025-11-14 | 13F | OMERS ADMINISTRATION Corp | 144.727 | 13,18 | 2.355 | -0,63 | ||||
| 2025-09-26 | NP | FSSGX - Fidelity SAI Sustainable Emerging Markets Equity Fund | 11.007 | -24,09 | 184 | -27,84 | ||||
| 2025-08-26 | NP | Profunds - Profund Vp Asia 30 | 33.011 | -7,23 | 612 | -5,86 | ||||
| 2025-10-31 | 13F | Sagespring Wealth Partners, Llc | 0 | -100,00 | 0 | |||||
| 2025-08-14 | 13F | Balyasny Asset Management Llc | 0 | -100,00 | 0 | |||||
| 2025-08-28 | NP | SIEMX - SIT EMERGING MARKETS EQUITY FUND - CLASS F, effective 1-31-2017 (formerly Class A) | 429.594 | -28,94 | 7.960 | -27,85 | ||||
| 2025-11-12 | 13F | AIMZ Investment Advisors, LLC | 305.471 | 0,02 | 4.970 | -12,18 | ||||
| 2025-11-14 | 13F | Raymond James Financial Inc | 64.457 | 10,29 | 1.049 | -3,14 | ||||
| 2025-11-12 | 13F | Integrated Quantitative Investments LLC | 142.553 | 16,75 | 2.319 | 2,52 | ||||
| 2025-08-27 | NP | THRIVENT SERIES FUND INC - Thrivent International Allocation Portfolio Class A | 57.539 | 128,28 | 1.066 | 132,24 | ||||
| 2025-08-21 | NP | DGIN - VanEck Digital India ETF | 81.446 | -19,19 | 1.509 | -17,94 | ||||
| 2025-11-04 | 13F | OneAscent Investment Solutions LLC | 43.196 | 0,00 | 703 | |||||
| 2025-11-14 | 13F | Bennbridge Ltd | 0 | -100,00 | 0 | |||||
| 2026-01-30 | 13F | State of New Jersey Common Pension Fund D | 2.883.342 | -6,27 | 51.381 | 2,66 | ||||
| 2025-11-12 | 13F | NewSquare Capital LLC | 0 | -100,00 | 0 | |||||
| 2025-11-14 | 13F | Transamerica Financial Advisors, Inc. | 95 | 2 | ||||||
| 2025-11-14 | 13F | JPL Wealth Management, LLC | 40 | 1 | ||||||
| 2025-09-25 | NP | TIER - T. Rowe Price International Equity Research ETF | 2.271 | 38 | ||||||
| 2025-11-14 | 13F | Walleye Trading LLC | Call | 61.700 | -6,94 | 1.004 | -18,32 | |||
| 2025-11-14 | 13F | Daiwa Securities Group Inc. | 3.791.116 | -31,22 | 87 | -14,71 | ||||
| 2025-11-14 | 13F | Walleye Trading LLC | Put | 7.600 | -18,28 | 124 | -28,49 | |||
| 2025-11-14 | 13F | Gts Securities Llc | 78.776 | 53,92 | 1.282 | 35,13 | ||||
| 2025-11-12 | 13F | Modern Wealth Management, LLC | 15.515 | -13,63 | 252 | -24,10 | ||||
| 2025-11-13 | 13F | Arrowstreet Capital, Limited Partnership | 2.128.946 | -83,25 | 34.638 | -85,29 | ||||
| 2026-01-30 | 13F | Exencial Wealth Advisors, Llc | 30.483 | 1,42 | 543 | 11,27 | ||||
| 2026-01-28 | 13F | Migdal Insurance & Financial Holdings Ltd. | 90.179 | 0,00 | 2 | 0,00 | ||||
| 2026-02-04 | 13F | Nwam Llc | 10.470 | -0,10 | 189 | 9,88 | ||||
| 2026-01-26 | 13F | La Banque Postale Asset Management SA | 105.100 | 0,00 | 1.873 | 9,54 | ||||
| 2026-02-04 | 13F | Atlantic Union Bankshares Corp | 50 | -33,33 | 1 | -100,00 | ||||
| 2026-01-15 | 13F | Frank, Rimerman Advisors LLC | 133.624 | 63,57 | 2.381 | 79,16 | ||||
| 2025-11-13 | 13F | LGT Group Foundation | 21.170 | 0,00 | 347 | -11,73 | ||||
| 2025-11-14 | 13F | Wealthspire Advisors, LLC | 1.647 | 27 | ||||||
| 2025-08-06 | 13F | BNP Paribas Asset Management Holding S.A. | 0 | -100,00 | 0 | |||||
| 2025-09-23 | NP | IEMGX - Voya Multi-Manager Emerging Markets Equity Fund Class I | 192.788 | 11,88 | 3.223 | 6,30 | ||||
| 2025-11-14 | 13F | Susquehanna International Group, Llp | 40.822 | 188,17 | 664 | 153,44 | ||||
| 2025-10-21 | 13F | Jarislowsky, Fraser Ltd | 238.197 | -23,40 | 3.875 | -32,75 | ||||
| 2025-11-14 | 13F | Hudson Portfolio Management LLC | 134.465 | -1,68 | 2.188 | -13,69 | ||||
| 2026-01-23 | 13F | Ti-trust, Inc | 22.753 | 0,00 | 405 | 9,46 | ||||
| 2025-09-25 | NP | IUAEX - JPMorgan International Unconstrained Equity Fund Class A | 0 | -100,00 | 0 | -100,00 | ||||
| 2025-08-28 | NP | KEMX - KraneShares MSCI Emerging Markets ex China Index ETF | 49.424 | -17,06 | 916 | -15,82 | ||||
| 2026-01-29 | 13F | Pictet Asset Management Holding SA | 0 | -100,00 | 0 | |||||
| 2026-01-30 | 13F | Mitsubishi UFJ Trust & Banking Corp | 59.067 | 6,27 | 1.053 | 16,37 | ||||
| 2025-11-14 | 13F | Aquatic Capital Management LLC | 33.991 | 553 | ||||||
| 2025-08-28 | NP | CIOIX - Causeway International Opportunities Fund Institutional Class | 0 | -100,00 | 0 | -100,00 | ||||
| 2026-01-16 | 13F | FNY Investment Advisers, LLC | 0 | -100,00 | 0 | |||||
| 2025-11-13 | 13F | Glenmede Investment Management, LP | 17.604 | -7,23 | 286 | -18,52 | ||||
| 2025-08-13 | 13F | Kilter Group LLC | 63 | 1 | ||||||
| 2025-09-23 | NP | GEBAX - Goldman Sachs ESG Emerging Markets Equity Fund Class A Shares | 16.858 | -6,20 | 282 | -11,08 | ||||
| 2026-02-04 | 13F | Madison Asset Management, LLC | 117.830 | -4,05 | 2.100 | 5,06 | ||||
| 2025-10-30 | 13F | Parkside Financial Bank & Trust | 811 | 0,00 | 13 | -13,33 | ||||
| 2025-08-25 | NP | MEGMX - Matthews Emerging Markets Equity Fund Investor Class Shares | 121.287 | -46,76 | 2.247 | -45,95 | ||||
| 2025-11-14 | 13F | DZ BANK AG Deutsche Zentral Genossenschafts Bank, Frankfurt am Main | 754.900 | 1,57 | 12.282 | -10,81 | ||||
| 2025-11-05 | 13F | BI Asset Management Fondsmaeglerselskab A/S | 68.291 | 1 | ||||||
| 2026-02-02 | 13F | Oppenheimer Asset Management Inc. | 487.221 | 0,63 | 8.682 | 10,22 | ||||
| 2026-01-30 | 13F | Ares Financial Consulting, LLC | 68 | 1 | ||||||
| 2025-11-14 | 13F | Strategic Global Advisors, LLC | 13.810 | -49,56 | 225 | -55,82 | ||||
| 2026-01-16 | 13F | CogentBlue Wealth Advisors, LLC | 21.195 | 9,91 | 378 | 20,45 | ||||
| 2026-01-21 | 13F | Trivant Custom Portfolio Group, LLC | 50.061 | -1,73 | 892 | 7,73 | ||||
| 2025-11-12 | 13F | Stifel Financial Corp | 154.468 | 195,60 | 2.513 | 159,61 | ||||
| 2025-11-05 | 13F | Flagship Harbor Advisors, Llc | 0 | -100,00 | 0 | -100,00 | ||||
| 2025-11-12 | 13F | Steward Partners Investment Advisory, Llc | 5.260 | 203,34 | 86 | 165,63 | ||||
| 2025-11-14 | 13F | Wiley Bros.-aintree Capital, Llc | 71.137 | 32,23 | 1.158 | 16,27 | ||||
| 2025-11-07 | 13F | Wealth Alliance | 30.593 | -4,69 | 498 | -16,33 | ||||
| 2026-01-20 | 13F | Thurston, Springer, Miller, Herd & Titak, Inc. | 1.200 | 500,00 | 21 | 600,00 | ||||
| 2025-11-06 | 13F | CIBC World Markets Inc. | 21.895 | -4,14 | 356 | -15,84 | ||||
| 2025-11-12 | 13F | William Blair Investment Management, Llc | 0 | -100,00 | 0 | -100,00 | ||||
| 2025-11-17 | 13F | Fwl Investment Management, Llc | 1.003 | 0,00 | 16 | -11,11 | ||||
| 2025-09-25 | NP | DFEM - Dimensional Emerging Markets Core Equity 2 ETF | 881.148 | -0,01 | 14.733 | -5,02 | ||||
| 2026-01-28 | 13F | CAPROCK Group, Inc. | 61.160 | -18,85 | 1.090 | -14,05 | ||||
| 2025-11-10 | 13F | Lansforsakringar Fondforvaltning AB (publ) | 29.064 | -1,09 | 473 | -13,24 | ||||
| 2025-11-13 | 13F | Mackenzie Financial Corp | 904.407 | -21,45 | 14.715 | -31,03 | ||||
| 2025-11-12 | 13F | Geode Capital Management, Llc | 410.976 | 0,00 | 6.687 | -12,20 | ||||
| 2025-10-22 | 13F | Advisory Resource Group | 74.876 | 11,67 | 1.218 | -1,93 | ||||
| 2026-01-16 | 13F | Pictet & Cie (Europe) SA | 109.231 | 30,62 | 1.946 | 43,09 | ||||
| 2025-11-14 | 13F | Ubs Asset Management Americas Inc | 156.874 | -21,41 | 2.552 | -30,99 | ||||
| 2026-01-28 | 13F | Davis Capital Management | 32.378 | -12,69 | 577 | -4,48 | ||||
| 2025-09-26 | NP | FEMYX - Fidelity Series Sustainable Emerging Markets Fund | 12.649 | 29,99 | 211 | 23,39 | ||||
| 2026-02-02 | 13F | Qrg Capital Management, Inc. | 22.833 | -23,38 | 407 | -16,12 | ||||
| 2025-09-26 | NP | FSYNX - Fidelity Sustainable Emerging Markets Equity Fund Fidelity Advisor Sustainable Emerging Markets Equity Fund: Class M | 1.325 | -30,34 | 22 | -33,33 | ||||
| 2025-08-22 | NP | DEUTSCHE DWS VARIABLE SERIES II - DWS Global Income Builder VIP Class A | 18.470 | 19,39 | 342 | 21,28 | ||||
| 2026-01-23 | 13F | Rsm Us Wealth Management Llc | 13.713 | 5,68 | 247 | 17,06 | ||||
| 2026-01-26 | 13F | PFG Investments, LLC | 17.932 | -11,90 | 320 | -3,63 | ||||
| 2025-08-26 | NP | SCIIX - Virtus SGA International Growth Fund Class A | 563.589 | 2,08 | 10.443 | 3,64 | ||||
| 2025-11-14 | 13F | Mount Yale Investment Advisors, LLC | 0 | -100,00 | 0 | -100,00 | ||||
| 2026-01-09 | 13F | Diversified Trust Co | 170.472 | 28,28 | 3.038 | 40,47 | ||||
| 2025-09-25 | NP | Dfa Investment Trust Co - The Emerging Markets Series This fund is a listed as child fund of Dimensional Fund Advisors Lp and if that institution has disclosed ownership in this security, then these positions will not be double counted when calculating total shares and total value | 331.357 | 0,00 | 5.540 | -4,99 | ||||
| 2025-11-13 | 13F | Clearbridge Investments, LLC | 262.722 | 4.274 | ||||||
| 2025-10-31 | 13F | JustInvest LLC | 179.059 | 14,97 | 2.913 | 0,97 | ||||
| 2025-10-29 | 13F | Arkadios Wealth Advisors | 12.493 | 203 | ||||||
| 2025-09-23 | NP | GERIX - Goldman Sachs Emerging Markets Equity Insights Fund Institutional | 2.128.921 | -21,60 | 35.596 | -25,52 | ||||
| 2026-01-22 | 13F | Massachusetts Financial Services Co /ma/ | 3.036.308 | 5,45 | 54.107 | 15,50 | ||||
| 2025-11-14 | 13F | Crawford Investment Counsel Inc | 28.000 | 0,00 | 456 | -12,16 | ||||
| 2026-01-21 | 13F | Greenleaf Trust | 20.971 | 16,03 | 374 | 26,87 | ||||
| 2025-11-14 | 13F | Parallax Volatility Advisers, L.P. | Put | 60.000 | 976 | |||||
| 2026-01-22 | 13F | Maseco Llp | 440 | 8 | ||||||
| 2026-02-03 | 13F | NewEdge Wealth, LLC | 35.169 | 28,72 | 627 | 39,73 | ||||
| 2025-11-14 | 13F | Parallax Volatility Advisers, L.P. | 32.548 | 530 | ||||||
| 2025-11-12 | 13F | Fox Run Management, L.l.c. | 0 | -100,00 | 0 | |||||
| 2025-11-07 | 13F | Pnc Financial Services Group, Inc. | 112.122 | 25,40 | 1.824 | 10,14 | ||||
| 2025-10-21 | 13F | Global Retirement Partners, LLC | 10.084 | -29,59 | 164 | -38,11 | ||||
| 2025-11-04 | 13F | Agf Management Ltd | 0 | -100,00 | 0 | |||||
| 2026-02-03 | 13F | Sequoia Financial Advisors, LLC | 164.991 | 9,33 | 2.940 | 19,76 | ||||
| 2025-11-10 | 13F | Bleakley Financial Group, LLC | 34.414 | 10,24 | 560 | -3,29 | ||||
| 2026-01-22 | 13F | Bartlett & Co. Wealth Management Llc | 4.380 | 0,00 | 78 | 9,86 | ||||
| 2025-08-18 | NP | Advantage Advisers Xanthus Fund, L.l.c. | Short | -215.356 | -3.991 | |||||
| 2026-01-20 | 13F | Ascent Group, LLC | 14.912 | 16,32 | 266 | 27,40 | ||||
| 2025-11-14 | 13F | United Capital Financial Advisers, Llc | 12.772 | 2,21 | 208 | -10,39 | ||||
| 2025-12-02 | 13F | IFP Advisors, Inc | 208 | 0,00 | 3 | 0,00 | ||||
| 2025-11-12 | 13F | LPL Financial LLC | 270.379 | -14,92 | 4.399 | -25,29 | ||||
| 2025-08-25 | NP | NXTG - First Trust Indxx NextG ETF This fund is a listed as child fund of First Trust Advisors Lp and if that institution has disclosed ownership in this security, then these positions will not be double counted when calculating total shares and total value | 249.084 | 31,05 | 4.616 | 33,07 | ||||
| 2026-01-28 | 13F | Eagle Global Advisors Llc | 70.000 | 0,00 | 1.247 | 9,58 | ||||
| 2025-11-14 | 13F | Federation des caisses Desjardins du Quebec | 192.956 | -81,69 | 3.139 | -83,92 | ||||
| 2026-01-08 | 13F | Value Partners Investments Inc. | 0 | -100,00 | 0 | |||||
| 2025-11-13 | 13F | LGT Fund Management Co Ltd. | 75.142 | 89,85 | 1.230 | 67,80 | ||||
| 2025-08-12 | 13F | Dynamic Technology Lab Private Ltd | 0 | -100,00 | 0 | |||||
| 2026-01-26 | 13F | PDS Planning, Inc | 52.223 | 16,56 | 931 | 27,75 | ||||
| 2025-11-14 | 13F | Credit Agricole S A | 340.473 | -1,20 | 5.539 | -11,91 | ||||
| 2025-11-14 | 13F | Wellington Management Group Llp | 1.648.565 | 14,48 | 26.822 | 0,51 | ||||
| 2025-08-13 | 13F | Oribel Capital Management, LP | Call | 0 | -100,00 | 0 | ||||
| 2025-08-25 | NP | MEMX - Matthews Emerging Markets ex China Active ETF | 9.563 | -58,48 | 177 | -57,86 | ||||
| 2025-08-28 | NP | Acap Strategic Fund | Short | -741.167 | -13.734 | |||||
| 2025-11-14 | 13F | Integrated Wealth Concepts LLC | 24.461 | 78,60 | 398 | 56,92 | ||||
| 2026-01-29 | 13F | Camelot Portfolios, LLC | 6.000 | 107 | ||||||
| 2025-11-03 | 13F | Knights of Columbus Asset Advisors LLC | 0 | -100,00 | 0 | -100,00 | ||||
| 2025-11-06 | 13F | OPTIMAS CAPITAL Ltd | 0 | -100,00 | 0 | -100,00 | ||||
| 2025-11-12 | 13F | Segall Bryant & Hamill, Llc | 65.600 | 0,00 | 1.067 | -12,18 | ||||
| 2025-11-13 | 13F | Prudential Financial Inc | 296.000 | 1,96 | 4.816 | -22,66 | ||||
| 2025-09-26 | NP | BLACKROCK FUNDS - BlackRock Emerging Markets ex-China Fund Investor A This fund is a listed as child fund of BlackRock, Inc. and if that institution has disclosed ownership in this security, then these positions will not be double counted when calculating total shares and total value | 0 | -100,00 | 0 | -100,00 | ||||
| 2025-11-14 | 13F | Logan Capital Management Inc | 98.192 | 50,14 | 1.598 | 31,87 | ||||
| 2025-11-14 | 13F | Public Employees Retirement System Of Ohio | 2.280.001 | -6,63 | 37.096 | -18,02 | ||||
| 2026-01-23 | 13F | Baillie Gifford & Co | 2.107.125 | -23,22 | 37.549 | -15,90 | ||||
| 2025-10-22 | 13F | Cerity Partners LLC | 153.953 | -0,85 | 2.505 | -12,96 | ||||
| 2025-09-24 | NP | SNTKX - Steward International Enhanced Index Fund Class A | 179.816 | 0,00 | 3.007 | -4,99 | ||||
| 2025-08-27 | NP | BCEMX - Boston Common ESG Impact Emerging Markets Fund | 92.898 | 3,06 | 1.721 | 4,62 | ||||
| 2025-09-26 | NP | FSGEX - Fidelity Series Global ex U.S. Index Fund This fund is a listed as child fund of Fmr Llc and if that institution has disclosed ownership in this security, then these positions will not be double counted when calculating total shares and total value | 12.736 | -81,94 | 213 | -82,92 | ||||
| 2026-01-26 | 13F | Harbor Asset Planning, Inc. | 511 | 0,00 | 9 | 12,50 | ||||
| 2025-11-14 | 13F | Sustainable Insight Capital Management, LLC | 11.435 | 186 | ||||||
| 2025-10-21 | 13F | GAM Holding AG | 337.709 | -9,11 | 5.495 | -20,19 | ||||
| 2025-09-26 | NP | INVESCO ACTIVELY MANAGED EXCHANGE-TRADED FUND TRUST - Invesco Global Equity Net Zero ETF | 28.394 | 475 | ||||||
| 2025-10-31 | 13F | Whittier Trust Co Of Nevada Inc | 0 | -100,00 | 0 | |||||
| 2025-11-10 | 13F | Barings Llc | 0 | -100,00 | 0 | |||||
| 2025-11-04 | 13F | Gitterman Wealth Management, LLC | 0 | -100,00 | 0 | |||||
| 2025-11-12 | 13F | Foster Dykema Cabot & Partners, Llc | 2.136 | 0,00 | 35 | -15,00 | ||||
| 2026-02-04 | 13F | White Oak Capital Partners Pte. Ltd. | 814.500 | 53,68 | 14.617 | -13,44 | ||||
| 2025-11-13 | 13F | Wells Fargo & Company/mn | 360.076 | 151,18 | 5.858 | 120,56 | ||||
| 2025-11-13 | 13F | Royal London Asset Management Ltd | 50.063 | -93,03 | 815 | -93,88 | ||||
| 2025-12-09 | 13F/A | Tudor Investment Corp Et Al | 0 | -100,00 | 0 | -100,00 | ||||
| 2025-09-24 | NP | BLACKROCK FUNDS - BlackRock Defensive Advantage Emerging Markets Fund Institutional This fund is a listed as child fund of BlackRock, Inc. and if that institution has disclosed ownership in this security, then these positions will not be double counted when calculating total shares and total value | 5.489 | -43,37 | 92 | -46,47 | ||||
| 2025-09-26 | NP | EPASX - EP Emerging Markets Small Companies Fund Class A | 55.000 | 0,00 | 920 | -5,06 | ||||
| 2026-01-28 | 13F | Geneos Wealth Management Inc. | 52.751 | -35,38 | 940 | -29,22 | ||||
| 2025-11-13 | 13F | Franklin Resources Inc | 10.655.900 | 1,35 | 173.371 | -11,01 | ||||
| 2025-08-26 | NP | SGAPX - Virtus SGA Global Growth Fund Class I | 377.896 | 0,00 | 7.002 | 1,54 | ||||
| 2025-08-26 | NP | JLPSX - JPMorgan U.S. Large Cap Core Plus Fund Class I | Short | -204.217 | 1,92 | -3.784 | 3,50 | |||
| 2026-01-23 | 13F | Lester Murray Antman dba SimplyRich | 46.453 | 2,27 | 1 | |||||
| 2025-11-14 | 13F | State Street Corp | 16.450.132 | 3,75 | 267.644 | -9,99 | ||||
| 2025-12-18 | 13F | AIA Group Ltd | 0 | -100,00 | 0 | |||||
| 2025-11-12 | 13F | Buckingham Strategic Partners | 26.646 | 0,04 | 436 | -11,56 | ||||
| 2026-01-28 | 13F | DekaBank Deutsche Girozentrale | 1.119.802 | 0,00 | 21 | 11,11 | ||||
| 2025-11-13 | 13F | Pathstone Holdings, LLC | 124.079 | -1,13 | 2.019 | -13,61 | ||||
| 2025-11-13 | 13F | Connor, Clark & Lunn Investment Management Ltd. | 944.896 | -84,08 | 15.373 | -86,02 | ||||
| 2025-09-25 | NP | WINAX - Wilmington International Fund Class A Shares | 75.809 | -4,92 | 1.268 | -9,69 | ||||
| 2026-02-04 | 13F | Mirabaud Asset Management Ltd | 160.550 | 55,50 | 3.527 | 109,44 | ||||
| 2026-01-08 | 13F | True Wealth Design, LLC | 309 | 11,96 | 6 | 25,00 | ||||
| 2025-11-14 | 13F | Wolverine Trading, Llc | Call | 47.900 | 46,48 | 782 | 29,09 | |||
| 2025-11-14 | 13F | Wolverine Trading, Llc | Put | 32.500 | 200,93 | 530 | 165,00 | |||
| 2025-11-14 | 13F | Walleye Capital LLC | Call | 15.700 | 153,23 | 255 | 123,68 | |||
| 2025-11-14 | 13F | Walleye Capital LLC | Put | 22.600 | -19,86 | 368 | -29,69 | |||
| 2026-01-21 | 13F | Modera Wealth Management, LLC | 158.516 | -2,94 | 2.825 | 6,29 | ||||
| 2025-11-14 | 13F | Citadel Advisors Llc | Call | 265.000 | 888,81 | 4.312 | 769,15 | |||
| 2026-01-28 | 13F | Oversea-Chinese Banking CORP Ltd | 105.357 | -22,00 | 1.877 | -14,57 | ||||
| 2025-11-14 | 13F | Citadel Advisors Llc | Put | 211.800 | 129,72 | 3.446 | 101,70 | |||
| 2025-09-25 | NP | JNBAX - JPMorgan Income Builder Fund Class A | 169.332 | 0,00 | 2.831 | -5,00 | ||||
| 2025-09-26 | NP | REMSX - Emerging Markets Fund Class S | 88.787 | -33,72 | 1.485 | -37,04 | ||||
| 2026-01-23 | 13F | Diversify Advisory Services, LLC | 0 | -100,00 | 0 | |||||
| 2025-11-14 | 13F | Citadel Advisors Llc | 1.521.867 | -73,22 | 24.761 | -76,48 | ||||
| 2025-09-25 | NP | DFSE - Dimensional Emerging Markets Sustainability Core 1 ETF | 105.618 | 0,00 | 1.766 | -5,01 | ||||
| 2025-11-13 | 13F | Chesapeake Capital Corp /il/ | 0 | -100,00 | 0 | |||||
| 2025-08-22 | NP | MSMBX - Emerging Markets Equity Portfolio Class II | 111.123 | -3,61 | 2.059 | -2,09 | ||||
| 2026-02-04 | 13F | Community Bank, N.A. | 2.552 | 0,00 | 45 | 9,76 | ||||
| 2025-11-14 | 13F | Price T Rowe Associates Inc /md/ | 1.604.269 | 24,48 | 26 | 13,04 | ||||
| 2025-11-14 | 13F | Empower Advisory Group, LLC | 14.080 | 0,00 | 229 | -11,92 | ||||
| 2025-09-25 | NP | BBHLX - BBH Partner Fund - International Equity Class I Shares | 2.030.400 | 33.948 | ||||||
| 2025-08-25 | NP | MFS VARIABLE INSURANCE TRUST II - MFS Global Tactical Allocation Portfolio Initial Class | 11.331 | 97,23 | 210 | 100,96 | ||||
| 2025-09-25 | NP | VMMSX - Vanguard Emerging Markets Select Stock Fund Investor Shares | 50.909 | -2,66 | 851 | -7,50 | ||||
| 2025-11-14 | 13F | Natixis | 44.975 | 157,74 | 732 | 126,32 | ||||
| 2026-01-23 | 13F | Clear Creek Financial Management, LLC | 31.934 | 1,34 | 569 | 11,13 | ||||
| 2025-11-14 | 13F | Fullerton Fund Management Co Ltd | 0 | -100,00 | 0 | -100,00 | ||||
| 2026-01-26 | 13F | Moran Wealth Management, LLC | 0 | -100,00 | 0 | |||||
| 2025-10-27 | 13F | Janney Montgomery Scott LLC | 633.626 | -0,70 | 10 | -9,09 | ||||
| 2025-11-12 | 13F | Thornburg Investment Management Inc | 24.667 | -14,29 | 401 | -24,77 | ||||
| 2025-08-20 | NP | NATIONWIDE VARIABLE INSURANCE TRUST - NVIT J.P. Morgan Digital Evolution Strategy Fund Class Y | 6.134 | 28,11 | 114 | 28,41 | ||||
| 2025-11-12 | 13F | Headlands Technologies LLC | 19.141 | 311 | ||||||
| 2025-11-04 | 13F | Jones Financial Companies Lllp | 6.205 | 11,64 | 103 | 0,00 | ||||
| 2025-11-14 | 13F | Caption Management, LLC | 88.600 | 1.442 | ||||||
| 2026-01-29 | 13F | Aprio Wealth Management, LLC | 12.728 | 227 | ||||||
| 2026-01-27 | 13F | Meritage Portfolio Management | 167.372 | 1,26 | 2.983 | 10,90 | ||||
| 2025-11-14 | 13F | Caption Management, LLC | Put | 70.000 | 1.139 | |||||
| 2025-11-14 | 13F | Amundi | 1.148.714 | -11,11 | 19.172 | -21,42 | ||||
| 2025-11-12 | 13F | Barclays Plc | 2.737.317 | -9,05 | 44.536 | 80.874,55 | ||||
| 2026-01-16 | 13F | Standard Life Aberdeen plc | 163.675 | -47,23 | 2.917 | -42,36 | ||||
| 2026-01-23 | 13F | Deprince Race & Zollo Inc | 423.904 | 8,71 | 7.554 | 19,06 | ||||
| 2025-11-05 | 13F | Moloney Securities Asset Management, LLC | 34.129 | -23,70 | 555 | -32,97 | ||||
| 2025-11-14 | 13F | Morgan Stanley | 37.952.320 | 21,52 | 617.484 | 6,70 | ||||
| 2026-01-09 | 13F | Oldfield Partners LLP | 37.633 | -59,11 | 671 | -55,24 | ||||
| 2026-01-12 | 13F | Abound Wealth Management | 99 | -6,60 | 2 | 0,00 | ||||
| 2025-10-24 | 13F | Evergreen Private Wealth LLC | 0 | -100,00 | 0 | -100,00 | ||||
| 2025-08-27 | NP | ADVANCED SERIES TRUST - AST J.P. Morgan Global Thematic Portfolio | 127.477 | -4,21 | 2.362 | -2,72 | ||||
| 2026-01-23 | 13F | Bridgewater Advisors Inc. | 33.350 | -7,37 | 611 | 4,81 | ||||
| 2025-09-26 | NP | Voya Prime Rate Trust | Short | -8.959 | -0,00 | -150 | -5,10 | |||
| 2025-09-25 | NP | JMNAX - JPMorgan Research Market Neutral Fund Class A | Short | -75.774 | 11,10 | -1.267 | 5,50 | |||
| 2025-11-14 | 13F | AXA Investment Managers S.A. | 898.224 | 14.614 | ||||||
| 2026-01-13 | 13F | Kathmere Capital Management, LLC | 65.527 | 33,36 | 1.168 | 46,06 | ||||
| 2025-11-14 | 13F | Aqr Capital Management Llc | 10.382.908 | -0,10 | 168.930 | -12,26 | ||||
| 2025-11-10 | 13F | Atomi Financial Group, Inc. | 27.868 | -6,94 | 453 | -18,23 | ||||
| 2025-08-26 | NP | FFALX - Franklin Founding Funds Allocation Fund Class A | 992.866 | 0,00 | 18.398 | 1,53 | ||||
| 2025-08-18 | NP | PACIFIC SELECT FUND - Emerging Markets Portfolio Class I | 492.168 | 9.120 | ||||||
| 2025-08-27 | NP | RYWTX - Emerging Markets 2x Strategy Fund Class A | 19.234 | 153,85 | 356 | 157,97 | ||||
| 2025-11-04 | 13F | High Note Wealth, LLC | 0 | -100,00 | 0 | |||||
| 2026-01-21 | 13F | Aaron Wealth Advisors LLC | 19.236 | 22,21 | 343 | 33,59 | ||||
| 2025-08-14 | 13F | Boothbay Fund Management, Llc | Call | 0 | -100,00 | 0 | ||||
| 2025-11-14 | 13F | Shelton Capital Management | 28.126 | 170,44 | 458 | 138,02 | ||||
| 2025-08-12 | 13F | Proequities, Inc. | Call | 0 | 0 | |||||
| 2025-08-12 | 13F | Proequities, Inc. | 0 | 0 | ||||||
| 2025-11-14 | 13F | Capstone Investment Advisors, Llc | 31.478 | -71,99 | 512 | -75,41 | ||||
| 2025-09-25 | NP | HTECX - Hennessy Technology Fund Investor Class | 6.744 | 19,15 | 113 | 13,13 | ||||
| 2025-11-13 | 13F | Pinnacle Wealth Planning Services, Inc. | 12.841 | -19,95 | 209 | -29,97 | ||||
| 2025-11-14 | 13F | Atom Investors LP | 0 | -100,00 | 0 | |||||
| 2025-11-12 | 13F | Fairtree Asset Management (Pty) Ltd | 26.967 | 31,08 | 439 | 14,96 | ||||
| 2025-11-06 | 13F | Financial Advocates Investment Management | 0 | -100,00 | 0 | |||||
| 2025-08-08 | 13F | M&G Plc | 0 | -100,00 | 0 | |||||
| 2025-11-14 | 13F | Two Sigma Investments, Lp | 0 | -100,00 | 0 | |||||
| 2025-11-14 | 13F | Nomura Holdings Inc | 281.440 | 11,46 | 4.579 | -2,12 | ||||
| 2025-11-14 | 13F | Nomura Holdings Inc | Put | 80.000 | 0,00 | 1.302 | -12,21 | |||
| 2025-08-13 | 13F | Arrowpoint Investment Partners (Singapore) Pte. Ltd. | Call | 0 | -100,00 | 0 | ||||
| 2025-10-30 | 13F | Ridgewood Investments LLC | 0 | -100,00 | 0 | |||||
| 2026-01-15 | 13F | Boston Common Asset Management, LLC | 643.224 | 64,14 | 11.462 | 79,80 | ||||
| 2026-01-21 | 13F/A | Euro Pacific Asset Management, LLC | 66.959 | 1,69 | 1 | 0,00 | ||||
| 2025-09-26 | NP | SPEDX - Alger Dynamic Opportunities Fund Class A | Short | -39.009 | -652 | |||||
| 2025-08-13 | 13F | Arrowpoint Investment Partners (Singapore) Pte. Ltd. | Put | 0 | -100,00 | 0 | ||||
| 2025-11-14 | 13F | Two Sigma Securities, Llc | 61.128 | 995 | ||||||
| 2025-08-14 | 13F | Canada Pension Plan Investment Board | 0 | -100,00 | 0 | -100,00 | ||||
| 2025-11-14 | 13F | Alliancebernstein L.p. | 16.482 | -8,90 | 268 | -20,00 | ||||
| 2026-01-27 | 13F | Zurcher Kantonalbank (Zurich Cantonalbank) | 144.864 | 2.581 | ||||||
| 2025-11-06 | 13F | Rhumbline Advisers | 544.133 | -2,61 | 8.853 | -14,49 | ||||
| 2025-11-12 | 13F | Nomura Asset Management Co Ltd | 675.012 | -3,23 | 10.982 | -15,03 | ||||
| 2025-11-12 | 13F | Abacus Wealth Partners, LLC | 0 | -100,00 | 0 | |||||
| 2026-01-08 | 13F | Nordea Investment Management Ab | 2.264.731 | -7,13 | 40.675 | 2,07 | ||||
| 2025-11-14 | 13F | Schonfeld Strategic Advisors LLC | Call | 50.000 | 814 | |||||
| 2025-11-06 | 13F | Johnson Investment Counsel Inc | 23.496 | -47,02 | 382 | -53,47 | ||||
| 2025-11-14 | 13F | Schonfeld Strategic Advisors LLC | 39.219 | -83,64 | 638 | -85,63 | ||||
| 2025-08-13 | 13F | Arrowpoint Investment Partners (Singapore) Pte. Ltd. | 0 | -100,00 | 0 | |||||
| 2025-08-25 | NP | TDIV - First Trust NASDAQ Technology Dividend Index Fund This fund is a listed as child fund of First Trust Advisors Lp and if that institution has disclosed ownership in this security, then these positions will not be double counted when calculating total shares and total value | 691.124 | 11,44 | 12.807 | 13,15 | ||||
| 2026-01-15 | 13F | Trust Co | 66 | 1 | ||||||
| 2025-11-14 | 13F | Two Sigma Advisers, Lp | 253.000 | -45,93 | 4.116 | -52,53 | ||||
| 2025-08-27 | NP | THRIVENT SERIES FUND INC - Thrivent Partner Emerging Markets Equity Portfolio Class A | 24.381 | 108,03 | 452 | 111,74 | ||||
| 2026-01-05 | 13F | Union Bancaire Privee, UBP SA | 151.767 | 24,80 | 2.517 | 37,09 | ||||
| 2026-02-02 | 13F | Montag A & Associates Inc | 3.400 | 0,00 | 61 | 9,09 |
Other Listings
| US:INFY | 16,74 USD |