Statistiche di base
| Proprietari istituzionali | 352 total, 349 long only, 0 short only, 3 long/short - change of -3,81% MRQ |
| Allocazione media del portafoglio | 0.3152 % - change of -1,82% MRQ |
| Azioni istituzionali (Long) | 114.079.554 (ex 13D/G) - change of -3,80MM shares -3,22% MRQ |
| Valore istituzionale (Long) | $ 1.635.648 USD ($1000) |
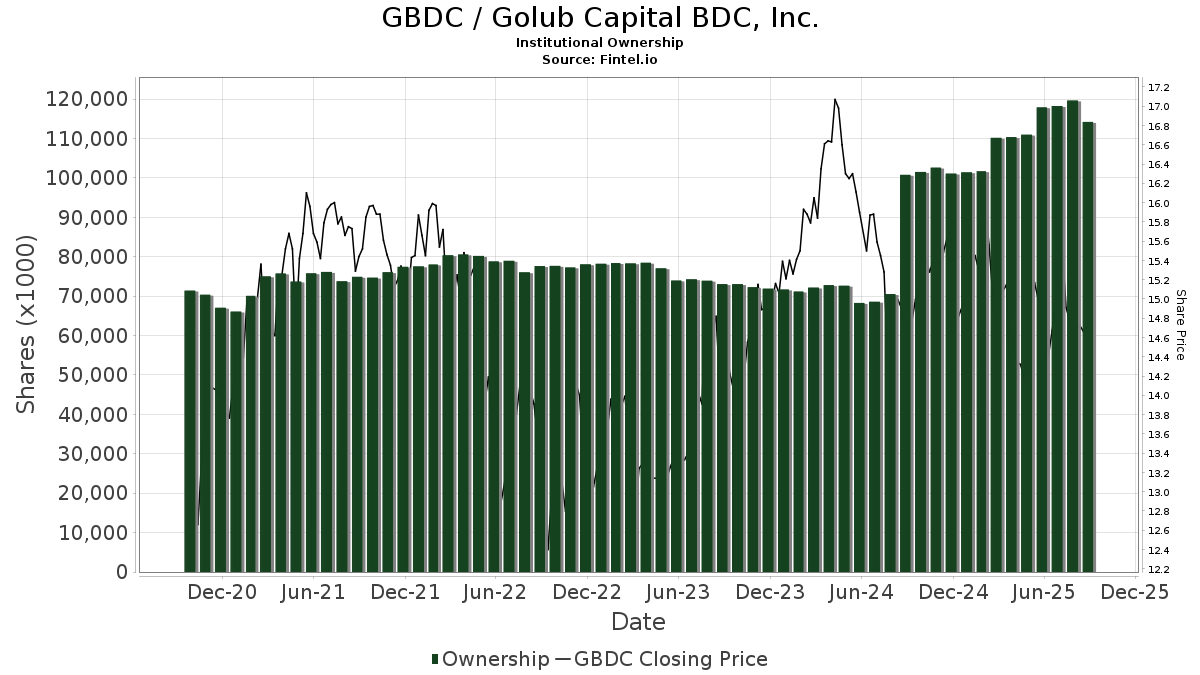
Proprietà istituzionale e azionisti
Golub Capital BDC, Inc. (US:GBDC) ha 352 proprietari istituzionali e azionisti che hanno presentato i moduli 13D/G o 13F alla Securities Exchange Commission (SEC). Queste istituzioni detengono un totale di 114,079,554 azioni. I maggiori azionisti includono Strs Ohio, Van Eck Associates Corp, Allen Investment Management LLC, BIZD - VanEck Vectors BDC Income ETF, Northeast Financial Consultants Inc, CI Private Wealth, LLC, Bank Of America Corp /de/, Sound Income Strategies, LLC, Sage Mountain Advisors LLC, and Lindbrook Capital, Llc .
(Golub Capital BDC, Inc. (NasdaqGS:GBDC) la struttura proprietaria istituzionale mostra le attuali posizioni nella società da parte di istituzioni e fondi, nonché le ultime variazioni nella dimensione della posizione. I principali azionisti possono essere singoli investitori, fondi comuni, hedge fund o istituzioni. L'allegato 13D indica che l'investitore detiene (o ha detenuto) più del 5% della società e intende (o intendeva) perseguire attivamente un cambiamento nella strategia aziendale. L'allegato 13G indica un investimento passivo superiore al 5%.
The share price as of September 5, 2025 is 14,75 / share. Previously, on September 6, 2024, the share price was 14,76 / share. This represents a decline of 0,07% over that period.
Indice del sentiment dei fondi
L'indice del sentiment dei fondi (anche noto come "indice di accumulo di proprietà") individua i titoli più acquistati dai fondi. È il risultato di un sofisticato modello quantitativo multi-fattore che identifica le società con i più alti livelli di accumulo istituzionale. Il modello utilizza una combinazione dell'aumento totale dei proprietari dichiarati, delle variazioni nelle allocazioni di portafoglio di tali proprietari e di altre metriche. Il punteggio varia da 0 a 100: i numeri più alti indicano un livello di accumulo superiore ad altre società, mentre 50 rappresenta la media.
Frequenza di aggiornamento: giornaliera
Consulta Ownership Explorer per visualizzare l'elenco delle aziende con il ranking più alto.
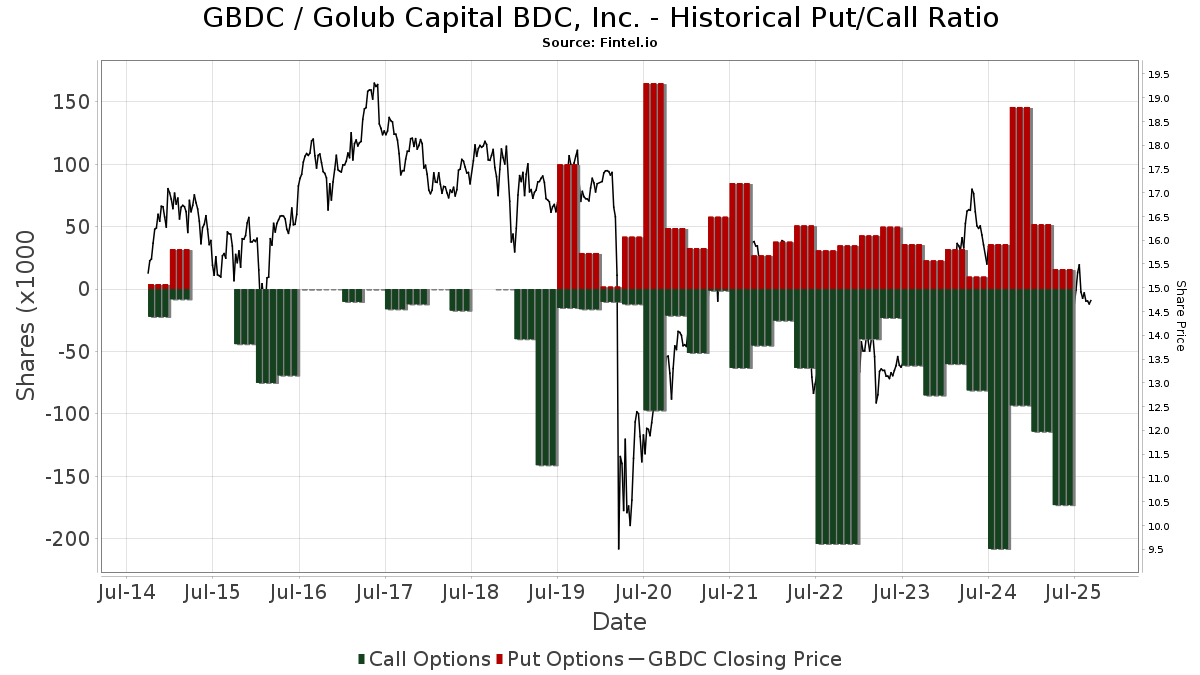
Rapporto put/call istituzionale
Oltre a segnalare le emissioni standard di titoli azionari e di debito, gli istituti con più di 100 milioni di asset in gestione devono anche dichiarare le loro partecipazioni in opzioni put e call. Poiché le opzioni put indicano generalmente un sentiment negativo e le opzioni call un sentiment positivo, possiamo avere un'idea del sentiment istituzionale complessivo attraverso il rapporto tra put e call. Il grafico a destra mostra il rapporto storico put/call per questo strumento.
L'utilizzo del rapporto put/call come indicatore del sentiment degli investitori consente di superare una delle principali lacune dell'utilizzo della proprietà istituzionale totale, ovvero il fatto che una quantità significativa di asset in gestione viene investita passivamente per seguire gli indici. Generalmente, i fondi a gestione passiva non acquistano opzioni, per cui il rapporto put/call riflette più fedelmente il sentiment dei fondi a gestione attiva.
Depositi 13D/G
Presentiamo i depositi 13D/G separatamente dai depositi 13F a causa del diverso trattamento da parte della SEC. I depositi 13D/G possono essere presentati da gruppi di investitori (con un unico leader), mentre i depositi 13F no. Ciò comporta situazioni in cui un investitore può depositare un documento 13D/G riportando un valore per il totale delle azioni (che rappresenta tutte le azioni possedute dal gruppo di investitori), e poi depositare un documento 13F riportando un valore diverso per il totale delle azioni (che rappresenta esclusivamente la propria proprietà). Ciò significa che la proprietà delle azioni nei depositi 13D/G e nei depositi 13F spesso non sono direttamente comparabili, pertanto le presentiamo separatamente.
Nota: a partire dal 16 maggio 2021, non mostriamo più i proprietari che non hanno depositato un documento 13D/G nellultimo anno. In precedenza, mostravamo lintero storico dei depositi 13D/G. In generale, le entità che sono tenute a depositare i documenti 13D/G devono farlo almeno una volta all'anno prima di presentare un deposito di chiusura. Tuttavia, a volte i fondi escono dalle posizioni senza presentare un deposito di chiusura (cioè, procedono a una liquidazione), per cui la visualizzazione dell'intero storico a volte generava confusione sull'attuale proprietà. Per evitare confusione, ora mostriamo solo i proprietari "attuali", ossia quelli che hanno effettuato un deposito nell'ultimo anno.
Upgrade to unlock premium data.
Depositi 13F e NPORT
Le informazioni relative ai depositi 13F sono gratuite. Per accedere alle informazioni relative ai depositi NP è necessario un'abbonamento premium. Le righe verdi indicano le nuove posizioni. Le righe rosse indicano le posizioni chiuse. Fai clic sull'icona del link per visualizzare la cronologia completa delle transazioni.
Esegui l'upgrade
per sbloccare i dati premium ed esportarli in Excel ![]() .
.
| Data di deposito | Fonte | Investitore | Tipo | Prezzo medio (Stima) |
Azioni | Δ Azioni (%) |
Valore dichiarato ($ 1000) |
Δ Valore (%) |
Allocazione del portafoglio (%) |
|
|---|---|---|---|---|---|---|---|---|---|---|
| 2025-07-16 | 13F | Beaumont Financial Advisors, LLC | 14.356 | 1,86 | 210 | -1,41 | ||||
| 2025-05-14 | 13F | Virtus ETF Advisers LLC | 0 | -100,00 | 0 | |||||
| 2025-07-29 | 13F | Arnhold LLC | 1.447.589 | 0,00 | 21.208 | -3,24 | ||||
| 2025-07-15 | 13F | Accurate Wealth Management, LLC | 55.590 | 11,20 | 839 | 22,69 | ||||
| 2025-07-31 | 13F | Cambridge Investment Research Advisors, Inc. | 24.584 | -39,79 | 0 | |||||
| 2025-08-07 | 13F | ProShare Advisors LLC | 37.876 | -5,02 | 555 | -8,13 | ||||
| 2025-07-24 | 13F | Ronald Blue Trust, Inc. | 7.908 | 31,78 | 116 | 27,78 | ||||
| 2025-08-11 | 13F | Nomura Asset Management Co Ltd | 12.716 | -20,66 | 186 | -23,14 | ||||
| 2025-07-09 | 13F | Dynamic Advisor Solutions LLC | 18.446 | -12,71 | 270 | -15,36 | ||||
| 2025-08-13 | 13F | Invesco Ltd. | 47.361 | -44,53 | 694 | -46,36 | ||||
| 2025-08-13 | 13F | First Trust Advisors Lp | 275.353 | -13,71 | 4.034 | -16,52 | ||||
| 2025-08-01 | 13F | Pasadena Private Wealth, LLC | 38.100 | 5,83 | 558 | 2,39 | ||||
| 2025-07-21 | 13F | Catalina Capital Group, LLC | 0 | -100,00 | 0 | -100,00 | ||||
| 2025-08-01 | 13F | First National Trust Co | 264.177 | 0,00 | 3.870 | -3,23 | ||||
| 2025-08-14 | 13F/A | Barclays Plc | 64.432 | 0,00 | 1 | |||||
| 2025-05-01 | 13F | Country Club Bank /gfn | 0 | -100,00 | 0 | |||||
| 2025-07-29 | 13F | Private Trust Co Na | 2.000 | 0,00 | 29 | -3,33 | ||||
| 2025-08-14 | 13F | Two Sigma Investments, Lp | 82.696 | -80,30 | 1.211 | -80,95 | ||||
| 2025-07-25 | 13F | Cwm, Llc | 25 | 0 | ||||||
| 2025-06-18 | NP | Putnam ETF Trust - Putnam BDC ETF - | 1.112.685 | 33,54 | 15.934 | 21,57 | ||||
| 2025-05-14 | 13F | Group One Trading, L.p. | 0 | -100,00 | 0 | -100,00 | ||||
| 2025-08-11 | 13F | Pin Oak Investment Advisors Inc | 460 | 0,00 | 0 | |||||
| 2025-07-25 | 13F | Tranquility Partners, LLC | 351.692 | -0,03 | 5.152 | -3,27 | ||||
| 2025-07-15 | 13F | Family Wealth Partners, Llc | 35.356 | 83,10 | 518 | 77,05 | ||||
| 2025-07-30 | 13F | Green Square Capital Advisors Llc | 166.740 | 2.443 | ||||||
| 2025-07-17 | 13F | Sound Income Strategies, LLC | 3.313.649 | 4,08 | 48.545 | 0,71 | ||||
| 2025-07-22 | 13F | MAS Advisors LLC | 17.279 | 3,91 | 253 | 0,80 | ||||
| 2025-08-14 | 13F | Smartleaf Asset Management LLC | 114 | 2 | ||||||
| 2025-05-15 | 13F | Aquatic Capital Management LLC | 0 | -100,00 | 0 | |||||
| 2025-08-04 | 13F | Assetmark, Inc | 193 | 3 | ||||||
| 2025-08-14 | 13F | Brinker Capital Investments, LLC | 0 | -100,00 | 0 | |||||
| 2025-08-14 | 13F | Optiver Holding B.V. | 3.087 | 0,00 | 45 | -2,17 | ||||
| 2025-08-12 | 13F | Jpmorgan Chase & Co | 2.422.672 | 3,35 | 35.492 | 0,01 | ||||
| 2025-08-11 | 13F | United Advisor Group, LLC | 214.488 | 4,38 | 3.142 | 1,03 | ||||
| 2025-07-25 | 13F | Concurrent Investment Advisors, LLC | 15.334 | 225 | ||||||
| 2025-05-02 | 13F | BluePointe Capital Management, LLC | 113.017 | 9,58 | 1.711 | 9,47 | ||||
| 2025-08-14 | 13F | Boston Private Wealth Llc | 0 | -100,00 | 0 | |||||
| 2025-07-28 | 13F/A | Penbrook Management LLC | 24.955 | -26,34 | 366 | -28,71 | ||||
| 2025-08-12 | 13F | Cornerstone Wealth Management, LLC | 11.777 | -10,04 | 173 | -13,13 | ||||
| 2025-08-11 | 13F | Hexagon Capital Partners LLC | 0 | -100,00 | 0 | |||||
| 2025-07-22 | 13F | Signature Wealth Management Partners, LLC | 12.920 | 15,65 | 189 | 11,83 | ||||
| 2025-08-12 | 13F | Blueprint Investment Partners LLC | 0 | -100,00 | 0 | |||||
| 2025-07-30 | 13F | Denali Advisors Llc | 542.148 | -2,23 | 7.942 | -5,40 | ||||
| 2025-08-14 | 13F | Susquehanna International Group, Llp | Call | 99.000 | 57,39 | 1.450 | 52,31 | |||
| 2025-08-11 | 13F | Private Advisor Group, LLC | 19.514 | -51,47 | 286 | -53,12 | ||||
| 2025-07-31 | 13F | CAP Partners, LLC | 10.215 | 150 | ||||||
| 2025-07-23 | 13F | Joel Isaacson & Co., LLC | 21.192 | 0,04 | 310 | -3,12 | ||||
| 2025-07-18 | 13F | Trust Co Of Vermont | 34.355 | 0,00 | 503 | -3,27 | ||||
| 2025-08-14 | 13F/A | Rockefeller Capital Management L.P. | 2.806.192 | -30,50 | 41.111 | -32,75 | ||||
| 2025-08-04 | 13F | Atria Investments Llc | 253.965 | -40,23 | 3.721 | -42,17 | ||||
| 2025-07-14 | 13F | Westend Capital Management LLC | 970 | 0,00 | 14 | 0,00 | ||||
| 2025-08-15 | 13F | Manhattan West Asset Management, LLC | 28.448 | 0,00 | 417 | -3,26 | ||||
| 2025-08-27 | NP | Advanced Series Trust - Ast Small-cap Growth Portfolio | 128.503 | 2,80 | 1.883 | -0,53 | ||||
| 2025-08-04 | 13F | Strs Ohio | 15.787.656 | 2,65 | 231.289 | -0,68 | ||||
| 2025-08-13 | 13F | Quadrant Capital Group Llc | 0 | -100,00 | 0 | |||||
| 2025-07-14 | 13F | AdvisorNet Financial, Inc | 18.636 | 12,02 | 273 | 8,76 | ||||
| 2025-07-28 | 13F | Harbour Investments, Inc. | 123 | 2 | ||||||
| 2025-07-24 | 13F | IFP Advisors, Inc | 2.829 | 1,29 | 41 | -2,38 | ||||
| 2025-08-07 | 13F | Allen Investment Management LLC | 4.238.538 | 2,49 | 62.095 | -0,83 | ||||
| 2025-08-05 | 13F | Bank Of Montreal /can/ | 726.187 | 211,85 | 10.639 | 201,79 | ||||
| 2025-08-08 | 13F | Foundations Investment Advisors, LLC | 21.461 | -24,28 | 314 | -26,81 | ||||
| 2025-05-16 | 13F | Coppell Advisory Solutions LLC | 0 | -100,00 | 0 | |||||
| 2025-08-06 | 13F | First Horizon Advisors, Inc. | 2.789 | 41 | ||||||
| 2025-08-12 | 13F | MAI Capital Management | 1.310.340 | -4,66 | 19.196 | -7,75 | ||||
| 2025-07-11 | 13F | Eagle Bay Advisors LLC | 261.033 | 0,27 | 3.824 | -2,97 | ||||
| 2025-07-24 | 13F | Us Bancorp \de\ | 10.382 | 0,41 | 152 | -2,56 | ||||
| 2025-08-14 | 13F | Group One Trading, L.p. | Put | 800 | -20,00 | 12 | -26,67 | |||
| 2025-06-26 | NP | LSVQX - LSV Small Cap Value Fund Institutional Class Shares | 187.200 | 0,00 | 2.681 | -8,97 | ||||
| 2025-08-07 | 13F | Navellier & Associates Inc | 18.030 | -0,81 | 264 | 3,13 | ||||
| 2025-08-14 | 13F | Group One Trading, L.p. | Call | 7.000 | 32,08 | 103 | 27,50 | |||
| 2025-08-07 | 13F | Evoke Wealth, Llc | 56.153 | 0,00 | 823 | -3,29 | ||||
| 2025-08-14 | 13F | Jain Global LLC | 0 | -100,00 | 0 | |||||
| 2025-08-13 | 13F | ExodusPoint Capital Management, LP | 0 | -100,00 | 0 | |||||
| 2025-06-25 | NP | FNK - First Trust Mid Cap Value AlphaDEX Fund This fund is a listed as child fund of First Trust Advisors Lp and if that institution has disclosed ownership in this security, then these positions will not be double counted when calculating total shares and total value | 57.407 | -12,81 | 822 | -20,58 | ||||
| 2025-04-28 | NP | HCYAX - HILTON TACTICAL INCOME FUND Investor Class | 40.090 | -3,07 | 628 | -3,09 | ||||
| 2025-08-11 | 13F | Promethium Advisors,llc | 22.600 | 2,26 | 331 | -0,90 | ||||
| 2025-08-13 | 13F | Cresset Asset Management, LLC | 75.025 | 2,23 | 1.099 | -1,08 | ||||
| 2025-08-14 | 13F | CIBC World Markets Inc. | 0 | -100,00 | 0 | |||||
| 2025-08-14 | 13F | EP Wealth Advisors, Inc. | 131.034 | -10,16 | 1.920 | -13,09 | ||||
| 2025-08-14 | 13F | Mariner, LLC | 121.320 | 41,01 | 1.777 | 36,48 | ||||
| 2025-05-12 | 13F | Basso Capital Management, L.p. | 0 | -100,00 | 0 | |||||
| 2025-07-09 | 13F | Bruce G. Allen Investments, LLC | 39 | 0,00 | 1 | |||||
| 2025-08-06 | 13F | Shade Tree Advisors LLC | 0 | -100,00 | 0 | |||||
| 2025-07-15 | 13F | Focused Wealth Management, Inc | 11.310 | 2,59 | 166 | -0,60 | ||||
| 2025-06-09 | NP | Bmc Fund Inc | 918 | 0,00 | 13 | -7,14 | ||||
| 2025-08-04 | 13F | AMG National Trust Bank | 67.139 | 0,00 | 984 | -3,25 | ||||
| 2025-08-05 | 13F | Castlekeep Investment Advisors Llc | 340.352 | -0,61 | 4.986 | -3,82 | ||||
| 2025-08-13 | 13F | Summit Financial, LLC | 26.409 | -3,82 | 387 | -6,99 | ||||
| 2025-08-06 | 13F | Wedbush Securities Inc | 45.381 | 5,83 | 1 | |||||
| 2025-07-29 | 13F | Harbor Asset Planning, Inc. | 1.599 | 23 | ||||||
| 2025-08-14 | 13F | Ubs Asset Management Americas Inc | 0 | -100,00 | 0 | |||||
| 2025-07-28 | 13F | IFC Advisors LLC | 50.417 | 4,13 | 739 | 0,68 | ||||
| 2025-08-11 | 13F | Empowered Funds, LLC | 25.127 | -8,33 | 368 | -11,33 | ||||
| 2025-08-07 | 13F | Legacy Advisors, LLC | 0 | -100,00 | 0 | |||||
| 2025-07-25 | NP | First Trust Specialty Finance & Financial Opportunities Fund This fund is a listed as child fund of First Trust Advisors Lp and if that institution has disclosed ownership in this security, then these positions will not be double counted when calculating total shares and total value | 360.000 | 38,46 | 5.476 | 34,39 | ||||
| 2025-08-04 | 13F | Creative Financial Designs Inc /adv | 6.936 | 0,00 | 102 | -3,81 | ||||
| 2025-08-14 | 13F | Millennium Management Llc | 1.317.151 | -13,83 | 19.296 | -16,62 | ||||
| 2025-08-12 | 13F | Manchester Capital Management LLC | 39.980 | 49,18 | 586 | 44,44 | ||||
| 2025-08-05 | 13F | 5T Wealth, LLC | 22.391 | -6,21 | 328 | -9,14 | ||||
| 2025-07-16 | 13F | Colton Groome Financial Advisors, Llc | 10.165 | 149 | ||||||
| 2025-08-14 | 13F | Mercer Global Advisors Inc /adv | 92.004 | 77,45 | 1.348 | 71,81 | ||||
| 2025-07-02 | 13F | Neville Rodie & Shaw Inc | 53.238 | -14,36 | 1 | |||||
| 2025-08-11 | 13F | Rothschild Investment Llc | 500 | 0,00 | 7 | 0,00 | ||||
| 2025-08-14 | 13F | State Street Corp | 254.131 | 257,75 | 3.723 | 246,33 | ||||
| 2025-08-13 | 13F | Wealthedge Investment Advisors, Llc | 72.995 | -39,28 | 1.069 | -41,26 | ||||
| 2025-08-14 | 13F | Colony Group, LLC | 13.538 | -59,41 | 198 | -60,71 | ||||
| 2025-08-06 | 13F | Modera Wealth Management, LLC | 19.690 | -6,15 | 288 | -9,15 | ||||
| 2025-08-13 | 13F | Guggenheim Capital Llc | 37.616 | 6,36 | 551 | 2,99 | ||||
| 2025-08-14 | 13F | Ameriprise Financial Inc | 64.186 | -7,48 | 928 | -11,71 | ||||
| 2025-08-25 | 13F/A | Neuberger Berman Group LLC | 468.678 | -2,38 | 6.866 | -5,53 | ||||
| 2025-08-11 | 13F | Greenland Capital Management LP | 79.421 | -25,07 | 1.164 | -27,49 | ||||
| 2025-07-28 | NP | FXED - Sound Enhanced Fixed Income ETF | 78.785 | 1,12 | 1.198 | -1,80 | ||||
| 2025-05-01 | 13F | Schechter Investment Advisors, LLC | 325.337 | 44,38 | 4.926 | 44,17 | ||||
| 2025-07-22 | 13F | Romano Brothers And Company | 12.125 | 0,00 | 178 | -3,28 | ||||
| 2025-07-29 | NP | SGMAX - SIIT Global Managed Volatility Fund Class A | 92.718 | 0,00 | 1.410 | -2,89 | ||||
| 2025-07-31 | 13F | Whipplewood Advisors, LLC | 67.149 | 14.788,91 | 984 | 14,44 | ||||
| 2025-08-14 | 13F | Tcw Group Inc | 0 | -100,00 | 0 | |||||
| 2025-08-14 | 13F | Stifel Financial Corp | 464.882 | 0,87 | 6.811 | -2,39 | ||||
| 2025-08-14 | 13F | Two Sigma Advisers, Lp | 134.500 | -74,64 | 1.970 | -75,46 | ||||
| 2025-08-12 | 13F | Franklin Resources Inc | 1.215.570 | 17,49 | 17.808 | 13,69 | ||||
| 2025-08-14 | 13F | BI Asset Management Fondsmaeglerselskab A/S | 2.494 | 0,00 | 0 | |||||
| 2025-06-25 | NP | FAB - First Trust Multi Cap Value AlphaDEX Fund This fund is a listed as child fund of First Trust Advisors Lp and if that institution has disclosed ownership in this security, then these positions will not be double counted when calculating total shares and total value | 10.172 | -12,33 | 146 | -20,33 | ||||
| 2025-08-11 | 13F | Strategic Wealth Partners, Ltd. | 7.457 | -29,44 | 109 | -35,12 | ||||
| 2025-07-23 | 13F | Nbt Bank N A /ny | 35.987 | -22,25 | 527 | -24,71 | ||||
| 2025-08-14 | 13F | Oxford Asset Management Llp | 26.201 | 1,46 | 384 | -5,43 | ||||
| 2025-08-13 | 13F | Cerity Partners LLC | 1.175.351 | -21,22 | 17.219 | -23,78 | ||||
| 2025-07-31 | 13F | Sage Mountain Advisors LLC | 3.033.453 | 10,47 | 44.440 | 6,89 | ||||
| 2025-08-14 | 13F | Family Management Corp | 63.833 | -9,67 | 935 | -12,54 | ||||
| 2025-05-07 | 13F | Pinnacle Wealth Management Advisory Group, LLC | 0 | -100,00 | 0 | |||||
| 2025-08-13 | 13F | M&t Bank Corp | 24.397 | 0,00 | 357 | -3,25 | ||||
| 2025-08-14 | 13F | Susquehanna International Group, Llp | 0 | -100,00 | 0 | |||||
| 2025-08-14 | 13F | Susquehanna International Group, Llp | Put | 0 | -100,00 | 0 | ||||
| 2025-08-13 | 13F | Cary Street Partners Financial Llc | 21.106 | 1,39 | 309 | -1,90 | ||||
| 2025-07-29 | 13F | TrueMark Investments, LLC | 0 | -100,00 | 0 | |||||
| 2025-08-12 | 13F | Coldstream Capital Management Inc | 0 | -100,00 | 0 | |||||
| 2025-07-07 | 13F | General Partner, Inc. | 123.041 | 0,00 | 1.803 | -3,22 | ||||
| 2025-05-06 | 13F | Proficio Capital Partners LLC | 0 | -100,00 | 0 | -100,00 | ||||
| 2025-08-14 | 13F | Hirtle Callaghan & Co LLC | 13.569 | 6,15 | ||||||
| 2025-05-28 | NP | LUSIX - Lazard US Systematic Small Cap Equity Portfolio Institutional Shares | 5.892 | -11,99 | 89 | -11,88 | ||||
| 2025-08-14 | 13F | Van Eck Associates Corp | 4.442.093 | 3,28 | 65 | 0,00 | ||||
| 2025-08-08 | 13F | CFO4Life Group, LLC | 12.451 | 2,26 | 182 | -1,09 | ||||
| 2025-08-14 | 13F | Headlands Technologies LLC | 252 | 4 | ||||||
| 2025-07-22 | 13F | Grimes & Company, Inc. | 19.005 | -27,81 | 278 | -30,15 | ||||
| 2025-08-05 | 13F | Simplex Trading, Llc | 472 | -94,57 | 0 | |||||
| 2025-08-13 | 13F | Serenus Wealth Advisors, LLC | 17.068 | 0,00 | 250 | -3,10 | ||||
| 2025-08-05 | 13F | Simplex Trading, Llc | Call | 3.100 | -53,03 | 0 | ||||
| 2025-08-05 | 13F | Simplex Trading, Llc | Put | 1.600 | -87,10 | 0 | ||||
| 2025-08-05 | 13F | Next Capital Management LLC | 279.444 | -18,52 | 4.094 | -21,17 | ||||
| 2025-04-11 | 13F | First Affirmative Financial Network | 0 | -100,00 | 0 | |||||
| 2025-08-25 | 13F/A | Promus Capital, LLC | 3.400 | 0,00 | 50 | -3,92 | ||||
| 2025-05-15 | 13F | Balyasny Asset Management Llc | 0 | -100,00 | 0 | |||||
| 2025-07-21 | 13F | Quent Capital, LLC | 15.311 | 0,00 | 224 | -3,03 | ||||
| 2025-08-07 | 13F | Hennion & Walsh Asset Management, Inc. | 402.458 | 22,05 | 5.896 | 18,11 | ||||
| 2025-08-14 | 13F | Douglass Winthrop Advisors, LLC | 35.987 | 0,00 | 527 | -3,12 | ||||
| 2025-07-11 | 13F/A | Umb Bank N A/mo | 8.826 | 0,00 | 129 | -3,01 | ||||
| 2025-08-14 | 13F | Cove Street Capital, LLC | 0 | -100,00 | 0 | |||||
| 2025-07-18 | 13F | Northstar Group, Inc. | 19.788 | 0,00 | 290 | -3,34 | ||||
| 2025-08-15 | 13F | Captrust Financial Advisors | 820.643 | -9,05 | 12.022 | -12,00 | ||||
| 2025-08-08 | 13F | Pnc Financial Services Group, Inc. | 0 | -100,00 | 0 | |||||
| 2025-08-14 | 13F | Manufacturers Life Insurance Company, The | 53.992 | 8,30 | 791 | 4,77 | ||||
| 2025-07-31 | 13F | Sumitomo Mitsui Trust Holdings, Inc. | 1.080.551 | 17,15 | 15.830 | 13,36 | ||||
| 2025-07-24 | 13F | Shikiar Asset Management Inc | 443.605 | -0,47 | 6 | 0,00 | ||||
| 2025-07-31 | 13F | Caitong International Asset Management Co., Ltd | 9 | -98,84 | 0 | -100,00 | ||||
| 2025-07-16 | 13F | Essex Financial Services, Inc. | 32.208 | 30,12 | 472 | 25,94 | ||||
| 2025-07-29 | 13F | International Assets Investment Management, Llc | 31.118 | 179,89 | 182 | 8,33 | ||||
| 2025-06-27 | NP | LBO - WHITEWOLF Publicly Listed Private Equity ETF | 27.411 | 14,28 | 393 | 3,98 | ||||
| 2025-07-09 | 13F | Massmutual Trust Co Fsb/adv | 0 | -100,00 | 0 | |||||
| 2025-08-11 | 13F | Core Wealth Partners LLC | 15.060 | 0,00 | 221 | -3,51 | ||||
| 2025-08-14 | 13F | Hrt Financial Lp | 37.164 | -71,55 | 1 | -100,00 | ||||
| 2025-08-12 | 13F | SRS Capital Advisors, Inc. | 325.200 | 4.764 | ||||||
| 2025-07-29 | 13F | Chicago Partners Investment Group LLC | 58.032 | 1,70 | 898 | 11,00 | ||||
| 2025-08-14 | 13F | Cura Wealth Advisors, Llc | 249.900 | -7,00 | 3.661 | -10,00 | ||||
| 2025-05-27 | NP | GAFCX - Virtus AlphaSimplex Global Alternatives Fund Class C | 3.482 | -1,08 | 53 | -1,89 | ||||
| 2025-08-14 | 13F | Raymond James Financial Inc | 381.458 | 0,12 | 5.588 | -3,12 | ||||
| 2025-07-17 | 13F | GraniteShares Advisors LLC | 184.735 | 6,67 | 2.706 | 3,20 | ||||
| 2025-05-15 | 13F/A | Orion Portfolio Solutions, LLC | 31.975 | -2,10 | 484 | -2,22 | ||||
| 2025-08-14 | 13F | Williams Jones Wealth Management, LLC. | 11.717 | 0,00 | 172 | -3,39 | ||||
| 2025-08-12 | 13F | CIBC Private Wealth Group, LLC | 20.997 | -47,13 | 308 | -40,62 | ||||
| 2025-04-22 | 13F | Synergy Financial Management, LLC | 0 | -100,00 | 0 | |||||
| 2025-08-05 | 13F | GHP Investment Advisors, Inc. | 322 | 2,88 | 5 | 0,00 | ||||
| 2025-08-14 | 13F | New England Asset Management Inc | 232.876 | 0,00 | 3.412 | -3,23 | ||||
| 2025-08-14 | 13F | Federation des caisses Desjardins du Quebec | 500 | 0,00 | 7 | 0,00 | ||||
| 2025-07-30 | 13F | Eqis Capital Management, Inc. | 23.164 | -0,09 | 339 | -3,42 | ||||
| 2025-08-08 | 13F | Lgt Capital Partners Ltd. | 696.000 | -22,67 | 10.196 | -25,17 | ||||
| 2025-07-01 | 13F | Confluence Investment Management Llc | 451.191 | 28,97 | 6.610 | 24,79 | ||||
| 2025-05-06 | 13F | Kovack Advisors, Inc. | 0 | -100,00 | 0 | |||||
| 2025-07-30 | 13F | Crewe Advisors LLC | 495 | 147,50 | 7 | 133,33 | ||||
| 2025-08-14 | 13F | GWM Advisors LLC | 59.194 | 35,97 | 867 | 31,56 | ||||
| 2025-05-08 | 13F | IFG Advisory, LLC | 0 | -100,00 | 0 | |||||
| 2025-08-13 | 13F | Lansforsakringar Fondforvaltning AB (publ) | 0 | -100,00 | 0 | |||||
| 2025-08-06 | 13F | Commonwealth Equity Services, Llc | 120.689 | 4,43 | 2 | 0,00 | ||||
| 2025-08-12 | 13F | New World Advisors LLC | 29.314 | 15,03 | 429 | 11,43 | ||||
| 2025-08-14 | 13F | Wiley Bros.-aintree Capital, Llc | 290.402 | 1,25 | 4.254 | -2,79 | ||||
| 2025-08-29 | 13F | Evolution Wealth Management Inc. | 1.218 | 18 | ||||||
| 2025-07-23 | 13F | Kingswood Wealth Advisors, Llc | 0 | -100,00 | 0 | -100,00 | ||||
| 2025-05-29 | NP | Partners Group Private Equity (master Fund), Llc | 686.115 | 34,48 | 10.381 | 34,39 | ||||
| 2025-08-14 | 13F | Brevan Howard Capital Management LP | 17.108 | 251 | ||||||
| 2025-08-08 | 13F | Creative Planning | 12.375 | -84,12 | 181 | -84,65 | ||||
| 2025-05-15 | 13F | AlphaQ Advisors LLC | 17.886 | 271 | ||||||
| 2025-07-30 | 13F | Onyx Bridge Wealth Group LLC | 115.949 | 2,03 | 1.699 | -1,28 | ||||
| 2025-08-12 | 13F | BlackRock, Inc. | 1.637.858 | 29,25 | 23.995 | 25,07 | ||||
| 2025-04-30 | 13F | Synergy Investment Management, LLC | 0 | -100,00 | 0 | |||||
| 2025-08-15 | 13F | Tower Research Capital LLC (TRC) | 1.002 | 240,82 | 15 | 250,00 | ||||
| 2025-07-29 | NP | BPSIX - Boston Partners Small Cap Value Fund II INSTITUTIONAL | 189.610 | 17,60 | 2.884 | 14,13 | ||||
| 2025-08-11 | 13F | Ironsides Asset Advisors, LLC | 14.642 | 13,07 | 215 | 9,18 | ||||
| 2025-07-16 | 13F | Plancorp, LLC | 20.076 | 0,00 | 294 | -2,97 | ||||
| 2025-08-14 | 13F | Bank Of America Corp /de/ | 3.621.790 | 5,78 | 53.059 | 2,36 | ||||
| 2025-08-14 | 13F | Evergreen Capital Management Llc | 24.847 | -1,77 | 364 | -4,71 | ||||
| 2025-08-29 | NP | GraniteShares ETF Trust - GraniteShares HIPS US High Income ETF | 184.735 | 6,67 | 2.706 | 3,20 | ||||
| 2025-08-14 | 13F | Toroso Investments, LLC | 79.660 | 2,25 | 1.167 | -1,02 | ||||
| 2025-08-14 | 13F | Citadel Advisors Llc | Put | 13.800 | -1,43 | 202 | -4,27 | |||
| 2025-08-01 | 13F | Envestnet Asset Management Inc | 146.434 | -51,57 | 2.145 | -53,15 | ||||
| 2025-08-14 | 13F | Citadel Advisors Llc | Call | 49.900 | 26,33 | 731 | 22,24 | |||
| 2025-07-16 | 13F | Pictet & Cie (Europe) SA | 13.847 | 2,57 | 203 | -0,98 | ||||
| 2025-07-16 | 13F | Prairiewood Capital, LLC | 341.092 | 6,17 | 4.997 | 2,73 | ||||
| 2025-07-25 | 13F | Allspring Global Investments Holdings, LLC | 0 | -100,00 | 0 | -100,00 | ||||
| 2025-07-21 | 13F | J. Safra Sarasin Holding AG | 80.000 | 0,00 | 1.172 | -3,22 | ||||
| 2025-07-15 | 13F | Riverbridge Partners Llc | 45.840 | 3,64 | 672 | 0,30 | ||||
| 2025-07-24 | 13F | Columbia Advisory Partners Llc | 15.348 | 0,00 | 225 | -3,45 | ||||
| 2025-08-07 | 13F | Allworth Financial LP | 2.192 | 116,82 | 32 | 128,57 | ||||
| 2025-08-08 | 13F | MTM Investment Management, LLC | 2.800 | 41 | ||||||
| 2025-08-14 | 13F | Benjamin Edwards Inc | 0 | -100,00 | 0 | |||||
| 2025-07-28 | 13F | Mowery & Schoenfeld Wealth Management, LLC | 0 | -100,00 | 0 | |||||
| 2025-08-14 | 13F | UBS Group AG | 2.408.886 | 90,76 | 35.290 | 84,58 | ||||
| 2025-07-22 | 13F | Gsa Capital Partners Llp | 11.116 | -70,15 | 0 | |||||
| 2025-07-18 | 13F | Union Bancaire Privee, UBP SA | 41.919 | 5,08 | 87.470 | 14.405,80 | ||||
| 2025-07-07 | 13F | Delphi Management Inc /ma/ | 29.898 | -1,82 | 0 | |||||
| 2025-08-15 | 13F | Great West Life Assurance Co /can/ | 265.077 | 4,09 | 4 | 0,00 | ||||
| 2025-08-06 | 13F | OneAscent Wealth Management LLC | 30.725 | -92,29 | 0 | -100,00 | ||||
| 2025-08-08 | 13F | Compass Wealth Management LLC | 0 | -100,00 | 0 | |||||
| 2025-08-14 | 13F | Bnp Paribas Arbitrage, Sa | 264.428 | 14,42 | 3.874 | 10,69 | ||||
| 2025-07-21 | 13F | Mirae Asset Global Investments Co., Ltd. | 8.000 | -44,19 | 117 | -46,33 | ||||
| 2025-08-07 | 13F | Parkside Financial Bank & Trust | 3.782 | -0,68 | 55 | -3,51 | ||||
| 2025-08-12 | 13F | Steward Partners Investment Advisory, Llc | 36.645 | 16,41 | 537 | 12,61 | ||||
| 2025-07-18 | 13F | Generali Investments CEE, investicni spolecnost, a.s. | 68.630 | 5,02 | 1.005 | 1,62 | ||||
| 2025-07-09 | 13F | Pallas Capital Advisors LLC | 45.346 | 2,97 | 664 | -0,30 | ||||
| 2025-07-17 | 13F | HB Wealth Management, LLC | 193.875 | -22,81 | 2.840 | -25,30 | ||||
| 2025-08-11 | 13F | Wealthspire Advisors, LLC | 19.287 | -1,15 | 283 | -4,41 | ||||
| 2025-08-13 | 13F | Lido Advisors, LLC | 452.735 | 67,44 | 6.633 | 62,03 | ||||
| 2025-08-14 | 13F | Advisor OS, LLC | 197.991 | 2,47 | 2.901 | -0,85 | ||||
| 2025-08-12 | 13F | Waterloo Capital, L.P. | 140.616 | 9,94 | 2.060 | 6,40 | ||||
| 2025-08-04 | 13F | Muzinich & Co., Inc. | 1.228.122 | 31,52 | 17.992 | 27,26 | ||||
| 2025-08-04 | 13F | Spire Wealth Management | 1.796 | 0,00 | 26 | -3,70 | ||||
| 2025-08-12 | 13F | OneAscent Financial Services LLC | 176.439 | -67,94 | 3 | -75,00 | ||||
| 2025-08-14 | 13F | D. E. Shaw & Co., Inc. | 15.264 | -75,10 | 224 | -75,97 | ||||
| 2025-08-05 | 13F | Bank of New York Mellon Corp | 148.900 | 0,08 | 2.181 | -3,15 | ||||
| 2025-08-11 | 13F | Delta Asset Management Llc/tn | 310 | 0,00 | 5 | 0,00 | ||||
| 2025-08-13 | 13F | Kilter Group LLC | 181 | 3 | ||||||
| 2025-07-22 | 13F | Iron Horse Wealth Management, LLC | 0 | -100,00 | 0 | |||||
| 2025-05-15 | 13F | Engineers Gate Manager LP | 0 | -100,00 | 0 | |||||
| 2025-08-12 | 13F | Pathstone Holdings, LLC | 335.053 | -0,37 | 4.909 | -3,59 | ||||
| 2025-08-14 | 13F | Qube Research & Technologies Ltd | 467.317 | -42,81 | 6.846 | -44,66 | ||||
| 2025-08-12 | 13F | LPL Financial LLC | 422.455 | -0,43 | 6.189 | -3,66 | ||||
| 2025-08-14 | 13F | Silvercrest Asset Management Group Llc | 0 | -100,00 | 0 | |||||
| 2025-05-09 | 13F | Hemington Wealth Management | 0 | -100,00 | 0 | |||||
| 2025-07-28 | 13F | Generali Asset Management SPA SGR | 2.512.705 | 39,59 | 36.811 | 35,08 | ||||
| 2025-08-12 | 13F | Dynamic Technology Lab Private Ltd | 15.830 | 232 | ||||||
| 2025-08-13 | 13F | OMERS ADMINISTRATION Corp | 2.354.112 | 2,65 | 34.488 | -0,68 | ||||
| 2025-07-18 | 13F | Truist Financial Corp | 18.568 | -46,48 | 272 | -48,19 | ||||
| 2025-07-25 | 13F | Atria Wealth Solutions, Inc. | 0 | -100,00 | 0 | -100,00 | ||||
| 2025-07-09 | 13F | Triumph Capital Management | 52.018 | 1,99 | 762 | -1,30 | ||||
| 2025-08-04 | 13F | Simon Quick Advisors, Llc | 83.357 | 2,10 | 1.221 | -1,21 | ||||
| 2025-07-16 | 13F | Eagle Global Advisors Llc | 11.010 | 0,00 | 161 | -3,01 | ||||
| 2025-07-10 | 13F | Redhawk Wealth Advisors, Inc. | 0 | -100,00 | 0 | |||||
| 2025-07-16 | 13F | Perigon Wealth Management, LLC | 11.894 | 9,01 | 174 | 5,45 | ||||
| 2025-07-17 | 13F | Beacon Capital Management, LLC | 604 | 2,72 | 9 | 0,00 | ||||
| 2025-07-31 | 13F/A | Avion Wealth | 13 | 0,00 | 0 | |||||
| 2025-05-09 | 13F | GeoWealth Management, LLC | 0 | -100,00 | 0 | |||||
| 2025-06-30 | NP | PSP - Invesco Global Listed Private Equity ETF This fund is a listed as child fund of Invesco Ltd. and if that institution has disclosed ownership in this security, then these positions will not be double counted when calculating total shares and total value | 80.995 | -16,30 | 1.160 | -23,85 | ||||
| 2025-08-14 | 13F | Ausdal Financial Partners, Inc. | 11.961 | 175 | ||||||
| 2025-08-14 | 13F | Two Sigma Securities, Llc | 12.560 | 184 | ||||||
| 2025-04-28 | 13F | Mutual Advisors, LLC | 0 | -100,00 | 0 | -100,00 | ||||
| 2025-08-14 | 13F | Ancora Advisors, LLC | 14.165 | 28,96 | 208 | 24,70 | ||||
| 2025-08-13 | 13F | SCS Capital Management LLC | 397.201 | -6,06 | 5.819 | -9,11 | ||||
| 2025-08-14 | 13F | Fmr Llc | 445 | 340,59 | 7 | 500,00 | ||||
| 2025-08-28 | NP | SMVIX - Simt Small Cap Value Fund Class I | 6.686 | -71,12 | 98 | -72,29 | ||||
| 2025-07-08 | 13F | Parallel Advisors, LLC | 241.741 | 10,54 | 3.542 | 6,95 | ||||
| 2025-08-06 | 13F | OneAscent Family Office, LLC | 0 | -100,00 | 0 | |||||
| 2025-08-04 | 13F | Haven Private, LLC | 0 | -100,00 | 0 | |||||
| 2025-04-23 | 13F | Embree Financial Group | 0 | -100,00 | 0 | |||||
| 2025-08-13 | 13F | Global Endowment Management, LP | 90.000 | 12,50 | 1.318 | 8,84 | ||||
| 2025-08-11 | 13F | Nations Financial Group Inc, /ia/ /adv | 43.167 | -2,32 | 632 | -5,53 | ||||
| 2025-08-08 | 13F | Advisors Capital Management, LLC | 330.628 | 1,33 | 4.844 | -1,96 | ||||
| 2025-04-29 | 13F | Raleigh Capital Management Inc. | 0 | -100,00 | 0 | |||||
| 2025-08-15 | 13F | Equitable Holdings, Inc. | 12.625 | -20,64 | 185 | -23,33 | ||||
| 2025-08-14 | 13F | Prelude Capital Management, Llc | 175.000 | -0,10 | 2.564 | -3,36 | ||||
| 2025-07-28 | 13F | Naviter Wealth, LLC | 279.449 | 17,84 | 4.094 | 13,19 | ||||
| 2025-07-17 | 13F | CWA Asset Management Group, LLC | 25.005 | 366 | ||||||
| 2025-07-21 | 13F | Abundance Wealth Counselors | 76.558 | 9,94 | 1 | 0,00 | ||||
| 2025-07-17 | 13F | Albion Financial Group /ut | 69.834 | 5,68 | 1.023 | 2,30 | ||||
| 2025-05-12 | 13F | Entropy Technologies, LP | 0 | -100,00 | 0 | |||||
| 2025-08-13 | 13F | Northern Trust Corp | 90.145 | 1.321 | ||||||
| 2025-08-15 | 13F | Morgan Stanley | 2.633.017 | 9,69 | 38.574 | 6,14 | ||||
| 2025-06-25 | NP | VPC - Virtus Private Credit Strategy ETF | 57.600 | 2,69 | 825 | -6,58 | ||||
| 2025-07-16 | 13F | Signaturefd, Llc | 75.686 | -17,80 | 1.109 | -20,52 | ||||
| 2025-08-14 | 13F | Snowden Capital Advisors LLC | 207.738 | -1,03 | 3.043 | -4,22 | ||||
| 2025-08-11 | 13F | HighTower Advisors, LLC | 666.635 | -4,48 | 9.766 | -7,57 | ||||
| 2025-08-11 | 13F | Edgemoor Investment Advisors, Inc. | 69.215 | -1,42 | 1.014 | -4,61 | ||||
| 2025-07-14 | 13F | Golden State Equity Partners | 34.564 | 0,00 | 506 | -3,25 | ||||
| 2025-08-14 | 13F | Toronto Dominion Bank | 5.128 | 2,56 | 75 | -1,32 | ||||
| 2025-08-11 | 13F | VSM Wealth Advisory, LLC | 2.633 | 2,65 | 39 | 0,00 | ||||
| 2025-05-12 | 13F | Virtu Financial LLC | 0 | -100,00 | 0 | |||||
| 2025-07-30 | 13F | Castle Wealth Management Llc | 17.027 | 249 | ||||||
| 2025-08-14 | 13F | Verition Fund Management LLC | 0 | -100,00 | 0 | |||||
| 2025-08-13 | 13F | EverSource Wealth Advisors, LLC | 585 | 29,14 | 9 | 33,33 | ||||
| 2025-08-05 | 13F | Partners Group Holding AG | 0 | -100,00 | 0 | |||||
| 2025-04-30 | 13F | POM Investment Strategies, LLC | 0 | -100,00 | 0 | |||||
| 2025-08-08 | 13F | Cetera Investment Advisers | 70.297 | -37,10 | 1.030 | -39,15 | ||||
| 2025-08-13 | 13F | Northwestern Mutual Wealth Management Co | 3.162 | -76,45 | 46 | -77,34 | ||||
| 2025-08-06 | 13F | Ethos Financial Group, LLC | 31.071 | 17,93 | 455 | 14,32 | ||||
| 2025-05-15 | 13F | Dark Forest Capital Management Lp | 0 | -100,00 | 0 | |||||
| 2025-08-14 | 13F | Kovitz Investment Group Partners, LLC | 186.752 | 186,34 | 2.736 | 177,10 | ||||
| 2025-07-22 | 13F | McElhenny Sheffield Capital Management, LLC | 44.000 | 44 | ||||||
| 2025-08-06 | 13F | Nicholas Hoffman & Company, LLC. | 32.467 | -2,31 | 476 | -5,57 | ||||
| 2025-08-13 | 13F | Brown Advisory Inc | 119.246 | -60,03 | 1.747 | -61,35 | ||||
| 2025-07-22 | 13F | Global Assets Advisory, LLC | 11.105 | 161 | ||||||
| 2025-08-15 | 13F | Kensington Investment Counsel, LLC | 11.966 | 0,00 | 175 | -3,31 | ||||
| 2025-08-14 | 13F | Royal Bank Of Canada | 155.707 | 18,37 | 2.282 | 14,62 | ||||
| 2025-05-14 | 13F | Trexquant Investment LP | 0 | -100,00 | 0 | |||||
| 2025-08-08 | 13F | Condor Capital Management | 351.113 | 2,65 | 5.144 | -0,68 | ||||
| 2025-08-13 | 13F | Virtus Investment Advisers, Inc. | 51.340 | -18,58 | 752 | -21,17 | ||||
| 2025-08-11 | 13F | Principal Securities, Inc. | 0 | -100,00 | 0 | |||||
| 2025-08-08 | 13F | Wall Street Access Asset Management, LLC | 27.815 | 1,12 | 407 | -1,93 | ||||
| 2025-08-06 | 13F | Texas Yale Capital Corp. | 160.089 | -7,54 | 2.345 | -10,53 | ||||
| 2025-07-14 | 13F | GAMMA Investing LLC | 0 | -100,00 | 0 | |||||
| 2025-07-29 | 13F | Arcus Capital Partners, LLC | 45.010 | 2,36 | 659 | -0,90 | ||||
| 2025-08-14 | 13F | Sunbelt Securities, Inc. | 314 | 5 | ||||||
| 2025-08-14 | 13F | Granite FO LLC | 504.535 | 0,00 | 7.391 | -3,23 | ||||
| 2025-08-14 | 13F | Mml Investors Services, Llc | 32.361 | -4,50 | 0 | |||||
| 2025-08-14 | 13F | Quarry LP | 2.834 | 26,40 | 42 | 24,24 | ||||
| 2025-08-14 | 13F | TT Capital Management LLC | 75.077 | 1.104 | ||||||
| 2025-08-14 | 13F | Axa S.a. | 18.470 | 0,00 | 271 | -3,23 | ||||
| 2025-07-28 | NP | PEX - ProShares Global Listed Private Equity ETF | 40.495 | 0,36 | 616 | -2,69 | ||||
| 2025-05-28 | NP | OneAscent Capital Opportunities Fund | 365 | 15,87 | 6 | 25,00 | ||||
| 2025-05-30 | NP | ERNZ - TrueShares Active Yield ETF | 11.157 | -93,92 | 169 | -93,96 | ||||
| 2025-08-04 | 13F | Amplius Wealth Advisors, LLC | 52.158 | 1,96 | 764 | -1,29 | ||||
| 2025-05-15 | 13F | Colony Capital, Inc. | Put | 0 | -100,00 | 0 | ||||
| 2025-06-25 | NP | FNX - First Trust Mid Cap Core AlphaDEX Fund This fund is a listed as child fund of First Trust Advisors Lp and if that institution has disclosed ownership in this security, then these positions will not be double counted when calculating total shares and total value | 212.957 | -10,70 | 3.050 | -18,72 | ||||
| 2025-08-14 | 13F | Hurley Capital, LLC | 3.238 | 0,00 | 47 | -4,08 | ||||
| 2025-05-16 | 13F | Jones Financial Companies Lllp | 0 | -100,00 | 0 | |||||
| 2025-08-12 | 13F | AlphaCore Capital LLC | 24.508 | 45,28 | 359 | 40,78 | ||||
| 2025-08-15 | 13F | Keel Point, LLC | 39.845 | 2,68 | 584 | -0,68 | ||||
| 2025-07-25 | 13F | Envestnet Portfolio Solutions, Inc. | 0 | -100,00 | 0 | -100,00 | ||||
| 2025-06-30 | 13F/A | Deutsche Bank Ag\ | 0 | -100,00 | 0 | |||||
| 2025-07-22 | 13F | Valley National Advisers Inc | 1.000 | 0,00 | 0 | |||||
| 2025-07-31 | 13F | Oppenheimer & Co Inc | 34.605 | -11,88 | 507 | -14,81 | ||||
| 2025-08-14 | 13F | Ares Management Llc | 2.571.210 | 2,90 | 37.668 | -0,43 | ||||
| 2025-07-31 | 13F | Quest Partners LLC | 4.882 | -30,92 | 72 | -33,02 | ||||
| 2025-07-09 | 13F | Silverberg Bernstein Capital Management LLC | 86.200 | 36,39 | 1.263 | 32,01 | ||||
| 2025-08-11 | 13F | Citigroup Inc | 331.207 | -4,70 | 4.852 | -7,77 | ||||
| 2025-08-18 | 13F | Wolverine Trading, Llc | Call | 14.900 | 20.594,44 | 215 | 65,38 | |||
| 2025-08-27 | 13F/A | Squarepoint Ops LLC | 20.954 | -12,36 | 307 | -15,24 | ||||
| 2025-08-14 | 13F | Vident Advisory, LLC | 21.411 | 36,95 | 314 | 32,63 | ||||
| 2025-08-13 | 13F | 1832 Asset Management L.P. | 184.492 | 0,00 | 2.703 | -3,26 | ||||
| 2025-07-11 | 13F | Mandatum Life Insurance Co Ltd | 35.566 | -23,44 | 521 | -25,89 | ||||
| 2025-07-17 | 13F | Janney Montgomery Scott LLC | 85.833 | -28,39 | 1 | 0,00 | ||||
| 2025-08-13 | 13F | Blueshift Asset Management, LLC | 12.954 | 190 | ||||||
| 2025-08-12 | 13F | Proequities, Inc. | Put | 0 | 0 | |||||
| 2025-08-12 | 13F | Proequities, Inc. | Call | 0 | 0 | |||||
| 2025-08-12 | 13F | Proequities, Inc. | 0 | 0 | ||||||
| 2025-08-12 | 13F/A | Boston Partners | 1.136.713 | 1,50 | 16.689 | 0,17 | ||||
| 2025-07-30 | 13F | D.a. Davidson & Co. | 318.133 | 5,04 | 4.661 | 1,64 | ||||
| 2025-08-07 | 13F | Connor, Clark & Lunn Investment Management Ltd. | 0 | -100,00 | 0 | |||||
| 2025-08-14 | 13F | Wells Fargo & Company/mn | 565.992 | 13,66 | 8.292 | 9,97 | ||||
| 2025-08-21 | NP | BIZD - VanEck Vectors BDC Income ETF | 3.912.974 | -2,30 | 57.325 | -5,46 | ||||
| 2025-07-17 | 13F | Mattern Wealth Management LLC | 14.000 | 0,00 | 205 | -2,84 | ||||
| 2025-05-28 | 13F | Silicon Valley Capital Partners | 1.202 | 0,00 | 18 | 0,00 | ||||
| 2025-08-14 | 13F | Cardiff Park Advisors, Llc | 10.000 | 0,00 | 146 | -3,31 | ||||
| 2025-08-12 | 13F | J.w. Cole Advisors, Inc. | 0 | -100,00 | 0 | |||||
| 2025-08-18 | 13F | Geneos Wealth Management Inc. | 44.036 | 4,99 | 645 | 1,57 | ||||
| 2025-08-14 | 13F | Comerica Bank | 12.208 | -2,44 | 179 | -5,82 | ||||
| 2025-08-14 | 13F | Quantinno Capital Management LP | 95.933 | 371,81 | 1.405 | 357,65 | ||||
| 2025-08-05 | 13F | Crestwood Advisors Group LLC | 10.414 | 153 | ||||||
| 2025-08-12 | 13F | Global Retirement Partners, LLC | 820 | 13.566,67 | 12 | |||||
| 2025-08-06 | 13F | Baillie Gifford & Co | 0 | -100,00 | 0 | |||||
| 2025-08-13 | 13F | Callodine Capital Management, LP | 521.238 | -0,72 | 7.636 | -3,93 | ||||
| 2025-09-04 | 13F/A | Advisor Group Holdings, Inc. | 37.160 | -42,64 | 544 | -44,49 | ||||
| 2025-07-18 | 13F | O'ROURKE & COMPANY, Inc | 11.737 | 0,98 | 172 | -2,29 | ||||
| 2025-08-12 | 13F | OneAscent Investment Solutions LLC | 42.634 | -1,67 | 1 | |||||
| 2025-07-24 | 13F | Costello Asset Management, INC | 200 | -33,33 | 3 | -50,00 | ||||
| 2025-05-13 | 13F | Fox Run Management, L.l.c. | 0 | -100,00 | 0 | -100,00 | ||||
| 2025-05-15 | 13F | Talon Private Wealth, LLC | 0 | -100,00 | 0 | -100,00 | ||||
| 2025-07-31 | 13F | Buckingham Strategic Partners | 35.356 | 83,11 | 518 | 77,05 | ||||
| 2025-08-13 | 13F | Jump Financial, LLC | 147.119 | 2.155 | ||||||
| 2025-07-25 | 13F | LRI Investments, LLC | 118.986 | 0,00 | 1.743 | -3,22 | ||||
| 2025-07-24 | 13F | Blair William & Co/il | 43.826 | 0,00 | 642 | -3,17 | ||||
| 2025-08-19 | 13F | Anchor Investment Management, LLC | 280.435 | 0,36 | 4.108 | -2,88 | ||||
| 2025-07-29 | 13F | Beverly Hills Private Wealth, LLC | 19.316 | -14,59 | 283 | -17,54 | ||||
| 2025-07-29 | 13F | Sigma Investment Counselors Inc | 800.915 | 10,89 | 11.733 | 7,30 | ||||
| 2025-08-06 | 13F | Moors & Cabot, Inc. | 37.008 | 1,11 | 542 | -2,17 | ||||
| 2025-07-30 | NP | HYIN - WisdomTree Alternative Income Fund N/A | 118.450 | 11,57 | 1.802 | 8,30 | ||||
| 2025-05-15 | 13F | Citadel Advisors Llc | 0 | -100,00 | 0 | -100,00 | ||||
| 2025-08-08 | 13F | Hartland & Co., LLC | 25.328 | 3,78 | 371 | 0,54 | ||||
| 2025-08-15 | 13F | Northeast Financial Consultants Inc | 3.887.089 | -5,65 | 56.946 | -8,71 | ||||
| 2025-08-21 | NP | MOFTX - Mercer Opportunistic Fixed Income Fund Class I | 87.000 | 1.275 | ||||||
| 2025-08-15 | 13F | CI Private Wealth, LLC | 3.648.809 | -13,13 | 53.455 | -15,95 | ||||
| 2025-07-30 | 13F | Klingman & Associates, LLC | 27.788 | -17,14 | 407 | -19,72 | ||||
| 2025-05-14 | 13F | Credit Agricole S A | 108.336 | 280,38 | 1.640 | 280,51 | ||||
| 2025-08-13 | 13F | Truvestments Capital Llc | 273.490 | -0,14 | 4.007 | -3,38 | ||||
| 2025-07-25 | 13F | Apollon Wealth Management, LLC | 47.769 | 21,46 | 700 | 17,48 | ||||
| 2025-07-24 | 13F | Comprehensive Money Management Services LLC | 11.600 | 8,72 | 170 | 4,97 | ||||
| 2025-08-07 | 13F | Global Wealth Management Investment Advisory, Inc. | 74.188 | 6,18 | 1.087 | 2,74 | ||||
| 2025-08-11 | 13F | EMC Capital Management | 12.729 | -25,65 | 0 | |||||
| 2025-08-14 | 13F | Evercore Wealth Management, LLC | 49.838 | 1,19 | 730 | -2,01 | ||||
| 2025-08-05 | 13F | Magnolia Capital Advisors Llc | 48.891 | 18,66 | 716 | 14,93 | ||||
| 2025-08-12 | 13F | Advisors Asset Management, Inc. | 295.705 | 67,60 | 4.332 | 62,19 | ||||
| 2025-08-14 | 13F | Ieq Capital, Llc | 152.195 | -17,02 | 2.230 | -19,73 | ||||
| 2025-08-15 | 13F | Kestra Advisory Services, LLC | 10.720 | 157 | ||||||
| 2025-05-28 | NP | VQNPX - Vanguard Growth and Income Fund Investor Shares This fund is a listed as child fund of Vanguard Group Inc and if that institution has disclosed ownership in this security, then these positions will not be double counted when calculating total shares and total value | 23.900 | -71,64 | 362 | -71,73 | ||||
| 2025-07-21 | 13F | Future Financial Wealth Managment LLC | 3.015 | 0,84 | 44 | -2,22 | ||||
| 2025-07-29 | 13F | Arista Wealth Management, LLC | 10.000 | 146 | ||||||
| 2025-08-14 | 13F | Port Capital LLC | 22.000 | 0,00 | 322 | -3,30 | ||||
| 2025-07-08 | 13F/A | Adams Asset Advisors, LLC | 137.723 | 71,75 | 2.018 | 66,14 | ||||
| 2025-08-11 | 13F | Lsv Asset Management | 1.223.018 | -1,07 | 18 | -5,56 | ||||
| 2025-08-11 | 13F | Universal- Beteiligungs- und Servicegesellschaft mbH | 253.360 | 0,14 | 3.712 | -3,11 | ||||
| 2025-06-26 | NP | LSVFX - LSV GLOBAL MANAGED VOLATILITY FUND Institutional Class Shares | 3.200 | 0,00 | 46 | -10,00 | ||||
| 2025-07-22 | 13F | Merit Financial Group, LLC | 160.434 | -45,75 | 2.350 | -47,50 | ||||
| 2025-08-14 | 13F | Jane Street Group, Llc | 18.296 | -35,84 | 268 | -37,82 | ||||
| 2025-05-14 | 13F | Bbr Partners, Llc | 0 | -100,00 | 0 | |||||
| 2025-08-08 | 13F | Avantax Advisory Services, Inc. | 25.340 | 9,39 | 371 | 6,00 | ||||
| 2025-08-13 | 13F | Centiva Capital, LP | 0 | -100,00 | 0 | |||||
| 2025-05-05 | 13F | Lindbrook Capital, Llc | 3.015.305 | -0,83 | 45.652 | -0,96 | ||||
| 2025-07-07 | 13F | RDA Financial Network | 34.367 | -3,93 | 503 | -7,02 | ||||
| 2025-08-13 | 13F | Mackenzie Financial Corp | 41.210 | 25,11 | 604 | 21,08 | ||||
| 2025-08-07 | 13F | Vise Technologies, Inc. | 19.679 | 23,01 | 288 | 19,01 | ||||
| 2025-08-14 | 13F | Glen Eagle Advisors, LLC | 193 | 2,66 | 3 | 0,00 | ||||
| 2025-08-14 | 13F | Lazard Asset Management Llc | 0 | -100,00 | 0 | |||||
| 2025-05-02 | 13F | Wealthfront Advisers Llc | 0 | -100,00 | 0 | -100,00 | ||||
| 2025-08-13 | 13F | M Holdings Securities, Inc. | 369.488 | 6,00 | 5 | 0,00 | ||||
| 2025-08-12 | 13F | Legal & General Group Plc | 1.891.937 | 1,67 | 27.726 | -1,56 | ||||
| 2025-08-13 | 13F | Legacy Capital Wealth Partners, LLC | 107.781 | -2,88 | 1.579 | -6,07 | ||||
| 2025-07-18 | 13F | SOA Wealth Advisors, LLC. | 0 | -100,00 | 0 | |||||
| 2025-08-14 | 13F | Hilton Capital Management, LLC | 0 | -100,00 | 0 | |||||
| 2025-05-06 | 13F | Pinnacle Associates Ltd | 0 | -100,00 | 0 | |||||
| 2025-08-14 | 13F | Goldman Sachs Group Inc | 64.065 | -22,14 | 939 | -24,66 | ||||
| 2025-04-21 | 13F | Nelson, Van Denburg & Campbell Wealth Management Group, LLC | 0 | -100,00 | 0 | |||||
| 2025-08-07 | 13F | Montag A & Associates Inc | 0 | -100,00 | 0 | |||||
| 2025-07-14 | 13F | Sowell Financial Services LLC | 0 | -100,00 | 0 | |||||
| 2025-07-14 | 13F | Border to Coast Pensions Partnership Ltd | 850.000 | 6,25 | 12 | 0,00 | ||||
| 2025-08-11 | 13F | Brown Brothers Harriman & Co | 36.667 | 0,00 | 537 | -3,24 | ||||
| 2025-07-28 | 13F | BRYN MAWR TRUST Co | 91.056 | 0,00 | 1.334 | -3,27 | ||||
| 2025-05-08 | 13F | XTX Topco Ltd | 0 | -100,00 | 0 |
Other Listings
| GB:0IZ6 |