Statistiche di base
| Valore del portafoglio | $ 102.688 |
| Posizioni attuali | 76 |
Ultime partecipazioni, performance, AUM (da depositi 13F, 13D)
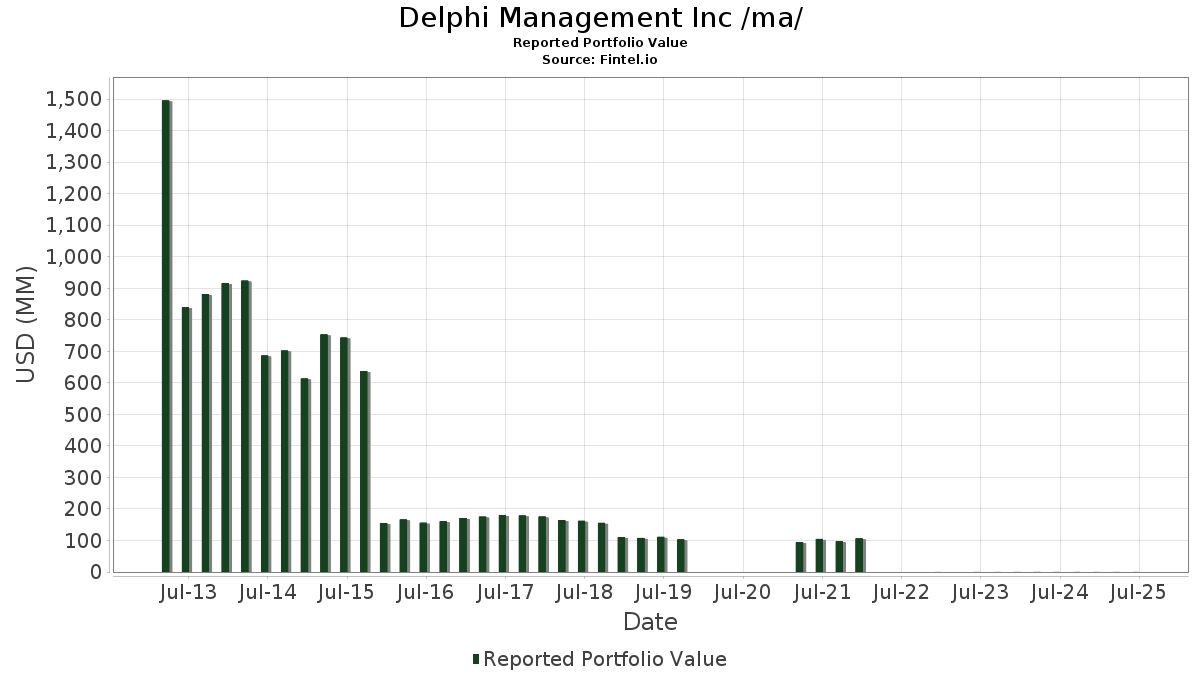
Delphi Management Inc /ma/ ha dichiarato un totale di 76 partecipazioni negli ultimi documenti depositati presso la SEC. Il valore più recente del portafoglio è pari a $ 102.688 USD. Il patrimonio gestito effettivo (AUM) corrisponde a questo valore più la liquidità (che non viene dichiarata). Le principali partecipazioni di Delphi Management Inc /ma/ sono Berkshire Hathaway Inc. (US:BRK.B) , Apple Inc. (US:AAPL) , Expedia Group, Inc. (US:EXPE) , Tapestry, Inc. (US:TPR) , and GS Connect S&P GSCI Enhanced Commodity Total Return ETN (US:GSCE) . Le nuove posizioni di Delphi Management Inc /ma/ includono Crown Holdings, Inc. (US:CCK) , Amentum Holdings, Inc. (US:AMTM) , The Travelers Companies, Inc. (US:TRV) , Terreno Realty Corporation (US:TRNO) , and Expand Energy Corporation (US:EXE) .
Gli aumenti più importanti di questo trimestre
Utilizziamo la variazione dell'allocazione del portafoglio perché è l'indicatore più significativo. Le variazioni possono essere dovute a transazioni o a variazioni dei prezzi delle azioni.
| Titolo | Azioni (in milioni) |
Valore (in milioni di $) |
Portafoglio % | ΔPortafoglio % |
|---|---|---|---|---|
| MTB / M&T Bank Corporation | 0,01 | 0,00 | 1,4841 | 1,4841 |
| CCK / Crown Holdings, Inc. | 0,01 | 0,00 | 1,4568 | 1,4568 |
| AMTM / Amentum Holdings, Inc. | 0,05 | 0,00 | 1,3867 | 1,3867 |
| TRV / The Travelers Companies, Inc. | 0,00 | 0,00 | 1,3001 | 1,3001 |
| TRNO / Terreno Realty Corporation | 0,02 | 0,00 | 1,2056 | 1,2056 |
| STLD / Steel Dynamics, Inc. | 0,01 | 0,00 | 1,3468 | 1,1353 |
| SMP / Standard Motor Products, Inc. | 0,03 | 0,00 | 1,2436 | 1,0274 |
| EXE / Expand Energy Corporation | 0,00 | 0,00 | 0,4032 | 0,4032 |
| CB / Chubb Limited | 0,01 | 0,00 | 1,5756 | 0,3771 |
| CAKE / The Cheesecake Factory Incorporated | 0,03 | 0,00 | 1,4549 | 0,2990 |
Gli aumenti più importanti di questo trimestre
Utilizziamo la variazione dell'allocazione del portafoglio perché è l'indicatore più significativo. Le variazioni possono essere dovute a transazioni o a variazioni dei prezzi delle azioni.
| Titolo | Azioni (in milioni) |
Valore (in milioni di $) |
Portafoglio % | ΔPortafoglio % |
|---|---|---|---|---|
| 1NSIT / Insight Enterprises, Inc. | 0,00 | 0,00 | -1,1819 | |
| KBR / KBR, Inc. | 0,01 | 0,00 | 0,4295 | -0,8795 |
| OMC / Omnicom Group Inc. | 0,01 | 0,00 | 0,4762 | -0,6407 |
| PRGS / Progress Software Corporation | 0,01 | 0,00 | 0,3447 | -0,5236 |
| KLAC / KLA Corporation | 0,00 | 0,00 | 1,1520 | -0,4695 |
| AZO / AutoZone, Inc. | 0,00 | 0,00 | 0,7664 | -0,2642 |
| LRCX / Lam Research Corporation | 0,01 | 0,00 | 1,2942 | -0,2596 |
| AMAT / Applied Materials, Inc. | 0,01 | 0,00 | 1,3361 | -0,2066 |
| DHI / D.R. Horton, Inc. | 0,01 | 0,00 | 1,2338 | -0,1762 |
| NFG / National Fuel Gas Company | 0,02 | 0,00 | 1,3361 | -0,1547 |
13F e depositi di fondi
Questo modulo è stato depositato il 2026-01-21 per il periodo di riferimento 2025-12-31. Fai clic sull'icona del link per visualizzare la cronologia completa delle transazioni.
Esegui l'upgrade per sbloccare i dati premium ed esportarli in Excel ![]() .
.
| Titolo | Tipo | Prezzo medio dell'azione | Azioni (in milioni) |
ΔAzioni (%) |
Valore (in milioni di $) |
ΔAzioni (%) |
Portafoglio (%) |
ΔPortafoglio (%) |
|
|---|---|---|---|---|---|---|---|---|---|
| BRK.B / Berkshire Hathaway Inc. | 0,01 | -2,88 | 0,00 | 0,00 | 2,4579 | 0,0460 | |||
| AAPL / Apple Inc. | 0,01 | -3,42 | 0,00 | 0,00 | 2,1512 | 0,1641 | |||
| EXPE / Expedia Group, Inc. | 0,01 | -17,20 | 0,00 | 0,00 | 1,6448 | 0,2171 | |||
| TPR / Tapestry, Inc. | 0,01 | -6,52 | 0,00 | 0,00 | 1,6302 | 0,1580 | |||
| GSCE / GS Connect S&P GSCI Enhanced Commodity Total Return ETN | 0,00 | -8,58 | 0,00 | 0,00 | 1,5961 | 0,0886 | |||
| CB / Chubb Limited | 0,01 | 13,29 | 0,00 | 0,00 | 1,5756 | 0,3771 | |||
| NVS / Novartis AG - Depositary Receipt (Common Stock) | 0,01 | -2,83 | 0,00 | 0,00 | 1,5737 | 0,1386 | |||
| SDZNY / Sandoz Group AG - Depositary Receipt (Common Stock) | 0,02 | -9,51 | 0,00 | 0,00 | 1,5640 | 0,2151 | |||
| JHG / Janus Henderson Group plc | 0,03 | -2,96 | 0,00 | 0,00 | 1,5552 | 0,1275 | |||
| MS / Morgan Stanley | 0,01 | -9,85 | 0,00 | 0,00 | 1,5523 | 0,0838 | |||
| ASX / ASE Technology Holding Co., Ltd. - Depositary Receipt (Common Stock) | 0,10 | -25,10 | 0,00 | 0,00 | 1,5445 | 0,1910 | |||
| JBL / Jabil Inc. | 0,01 | -2,03 | 0,00 | 0,00 | 1,5357 | 0,1136 | |||
| USB / U.S. Bancorp | 0,03 | -1,85 | 0,00 | 0,00 | 1,5260 | 0,1846 | |||
| SSNC / SS&C Technologies Holdings, Inc. | 0,02 | 3,57 | 0,00 | 0,00 | 1,5231 | 0,1009 | |||
| SF / Stifel Financial Corp. | 0,01 | -2,50 | 0,00 | 0,00 | 1,5231 | 0,1742 | |||
| JPM / JPMorgan Chase & Co. | 0,00 | -3,27 | 0,00 | 0,00 | 1,5201 | 0,0544 | |||
| TXT / Textron Inc. | 0,02 | -2,12 | 0,00 | 0,00 | 1,5192 | 0,0868 | |||
| CAC / Camden National Corporation | 0,04 | -0,69 | 0,00 | 0,00 | 1,5114 | 0,2210 | |||
| FR / First Industrial Realty Trust, Inc. | 0,03 | -0,33 | 0,00 | 0,00 | 1,5065 | 0,2124 | |||
| AXP / American Express Company | 0,00 | -9,95 | 0,00 | 0,00 | 1,5055 | 0,0751 | |||
| SANM / Sanmina Corporation | 0,01 | -21,66 | 0,00 | 0,00 | 1,5016 | 0,1009 | |||
| ABBV / AbbVie Inc. | 0,01 | -3,03 | 0,00 | 0,00 | 1,4948 | 0,0059 | |||
| MTB / M&T Bank Corporation | 0,01 | 0,00 | 1,4841 | 1,4841 | |||||
| ITRN / Ituran Location and Control Ltd. | 0,04 | -2,48 | 0,00 | 0,00 | 1,4831 | 0,2799 | |||
| DIS / The Walt Disney Company | 0,01 | 6,37 | 0,00 | 0,00 | 1,4646 | 0,1446 | |||
| GHC / Graham Holdings Company | 0,00 | -1,37 | 0,00 | 0,00 | 1,4588 | -0,0515 | |||
| CCK / Crown Holdings, Inc. | 0,01 | 0,00 | 1,4568 | 1,4568 | |||||
| CAKE / The Cheesecake Factory Incorporated | 0,03 | 29,72 | 0,00 | 0,00 | 1,4549 | 0,2990 | |||
| HIG / The Hartford Insurance Group, Inc. | 0,01 | 4,17 | 0,00 | 0,00 | 1,4481 | 0,1660 | |||
| SNX / TD SYNNEX Corporation | 0,01 | -5,81 | 0,00 | 0,00 | 1,4452 | -0,1477 | |||
| RL / Ralph Lauren Corporation | 0,00 | -15,74 | 0,00 | 0,00 | 1,4413 | -0,0041 | |||
| FLEX / Flex Ltd. | 0,02 | -10,04 | 0,00 | 0,00 | 1,4413 | -0,0226 | |||
| HTGC / Hercules Capital, Inc. | 0,08 | 5,11 | 0,00 | 0,00 | 1,4393 | 0,1294 | |||
| AZZ / AZZ Inc. | 0,01 | -3,33 | 0,00 | 0,00 | 1,4354 | -0,0043 | |||
| RNR / RenaissanceRe Holdings Ltd. | 0,01 | -1,10 | 0,00 | 0,00 | 1,4315 | 0,1866 | |||
| UNTY / Unity Bancorp, Inc. | 0,03 | -2,08 | 0,00 | 0,00 | 1,4286 | 0,1150 | |||
| NXST / Nexstar Media Group, Inc. | 0,01 | 8,34 | 0,00 | 0,00 | 1,4276 | 0,2050 | |||
| PUBGY / Publicis Groupe S.A. - Depositary Receipt (Common Stock) | 0,06 | -2,17 | 0,00 | 0,00 | 1,4228 | 0,1324 | |||
| DELL / Dell Technologies Inc. | 0,01 | 7,58 | 0,00 | 0,00 | 1,4198 | 0,0042 | |||
| STAG / STAG Industrial, Inc. | 0,04 | 1,59 | 0,00 | 0,00 | 1,4189 | 0,1424 | |||
| INGR / Ingredion Incorporated | 0,01 | 27,65 | 0,00 | 0,00 | 1,4023 | 0,2436 | |||
| LDOS / Leidos Holdings, Inc. | 0,01 | -5,76 | 0,00 | 0,00 | 1,3935 | -0,0824 | |||
| THG / The Hanover Insurance Group, Inc. | 0,01 | 1,27 | 0,00 | 0,00 | 1,3877 | 0,0899 | |||
| AMTM / Amentum Holdings, Inc. | 0,05 | 0,00 | 1,3867 | 1,3867 | |||||
| LH / Labcorp Holdings Inc. | 0,01 | 6,55 | 0,00 | 0,00 | 1,3828 | -0,0319 | |||
| FAF / First American Financial Corporation | 0,02 | 3,11 | 0,00 | 0,00 | 1,3711 | 0,0474 | |||
| BATRK / Atlanta Braves Holdings, Inc. | 0,04 | 18,18 | 0,00 | 0,00 | 1,3702 | 0,2059 | |||
| STLD / Steel Dynamics, Inc. | 0,01 | 399,14 | 0,00 | 1,3468 | 1,1353 | ||||
| NFG / National Fuel Gas Company | 0,02 | -1,47 | 0,00 | 0,00 | 1,3361 | -0,1547 | |||
| AMAT / Applied Materials, Inc. | 0,01 | -34,24 | 0,00 | 0,00 | 1,3361 | -0,2066 | |||
| WRB / W. R. Berkley Corporation | 0,02 | -2,64 | 0,00 | 0,00 | 1,3263 | -0,0921 | |||
| BHB / Bar Harbor Bankshares | 0,04 | 0,43 | 0,00 | 0,00 | 1,3176 | 0,0912 | |||
| TOL / Toll Brothers, Inc. | 0,01 | -1,97 | 0,00 | 0,00 | 1,3156 | 0,0095 | |||
| TRV / The Travelers Companies, Inc. | 0,00 | 0,00 | 1,3001 | 1,3001 | |||||
| LRCX / Lam Research Corporation | 0,01 | -37,96 | 0,00 | 0,00 | 1,2942 | -0,2596 | |||
| ARW / Arrow Electronics, Inc. | 0,01 | 20,85 | 0,00 | 0,00 | 1,2825 | 0,1721 | |||
| ARCC / Ares Capital Corporation | 0,06 | -0,83 | 0,00 | 0,00 | 1,2494 | 0,0388 | |||
| SMP / Standard Motor Products, Inc. | 0,03 | 506,28 | 0,00 | 1,2436 | 1,0274 | ||||
| SNA / Snap-on Incorporated | 0,00 | -1,18 | 0,00 | 0,00 | 1,2377 | 0,0383 | |||
| DHI / D.R. Horton, Inc. | 0,01 | -1,92 | 0,00 | 0,00 | 1,2338 | -0,1762 | |||
| EG / Everest Group, Ltd. | 0,00 | 7,62 | 0,00 | 0,00 | 1,2319 | 0,1057 | |||
| TRNO / Terreno Realty Corporation | 0,02 | 0,00 | 1,2056 | 1,2056 | |||||
| EOG / EOG Resources, Inc. | 0,01 | 18,39 | 0,00 | 0,00 | 1,1881 | 0,1676 | |||
| BXSL / Blackstone Secured Lending Fund | 0,05 | 0,92 | 0,00 | 0,00 | 1,1783 | 0,0772 | |||
| EXP / Eagle Materials Inc. | 0,01 | 9,50 | 0,00 | 0,00 | 1,1764 | 0,0224 | |||
| KLAC / KLA Corporation | 0,00 | -39,91 | 0,00 | 0,00 | 1,1520 | -0,4695 | |||
| AZO / AutoZone, Inc. | 0,00 | -10,42 | 0,00 | -100,00 | 0,7664 | -0,2642 | |||
| ANF / Abercrombie & Fitch Co. | 0,01 | -13,78 | 0,00 | 0,6836 | 0,1706 | ||||
| INCY / Incyte Corporation | 0,01 | -10,28 | 0,00 | 0,5940 | 0,0523 | ||||
| OMC / Omnicom Group Inc. | 0,01 | -58,98 | 0,00 | -100,00 | 0,4762 | -0,6407 | |||
| TTAM / Titan America SA | 0,03 | 31,03 | 0,00 | 0,4431 | 0,1509 | ||||
| KBR / KBR, Inc. | 0,01 | -63,21 | 0,00 | -100,00 | 0,4295 | -0,8795 | |||
| GBDC / Golub Capital BDC, Inc. | 0,03 | 1,72 | 0,00 | 0,4051 | 0,0220 | ||||
| EXE / Expand Energy Corporation | 0,00 | 0,00 | 0,4032 | 0,4032 | |||||
| PRGS / Progress Software Corporation | 0,01 | -61,26 | 0,00 | 0,3447 | -0,5236 | ||||
| URBN / Urban Outfitters, Inc. | 0,00 | -4,07 | 0,00 | 0,2931 | 0,0167 | ||||
| MTDR / Matador Resources Company | 0,00 | -100,00 | 0,00 | 0,0000 | |||||
| CBT / Cabot Corporation | 0,00 | -100,00 | 0,00 | 0,0000 | |||||
| FANG / Diamondback Energy, Inc. | 0,00 | -100,00 | 0,00 | 0,0000 | |||||
| DOX / Amdocs Limited | 0,00 | -100,00 | 0,00 | 0,0000 | |||||
| ORCL / Oracle Corporation | 0,00 | -100,00 | 0,00 | 0,0000 | |||||
| LEN / Lennar Corporation | 0,00 | -100,00 | 0,00 | 0,0000 | |||||
| FI / Fiserv, Inc. | 0,00 | -100,00 | 0,00 | 0,0000 | |||||
| MNR / Mach Natural Resources LP | 0,00 | -100,00 | 0,00 | 0,0000 | |||||
| NICE / NICE Ltd. - Depositary Receipt (Common Stock) | 0,00 | -100,00 | 0,00 | 0,0000 | |||||
| REVG / REV Group, Inc. | 0,00 | -100,00 | 0,00 | 0,0000 | |||||
| 1NSIT / Insight Enterprises, Inc. | 0,00 | -100,00 | 0,00 | -100,00 | -1,1819 |