Statistiche di base
| Proprietari istituzionali | 314 total, 309 long only, 0 short only, 5 long/short - change of 8,65% MRQ |
| Allocazione media del portafoglio | 0.1556 % - change of 2,90% MRQ |
| Azioni istituzionali (Long) | 21.420.601 (ex 13D/G) - change of -0,04MM shares -0,19% MRQ |
| Valore istituzionale (Long) | $ 1.562.018 USD ($1000) |
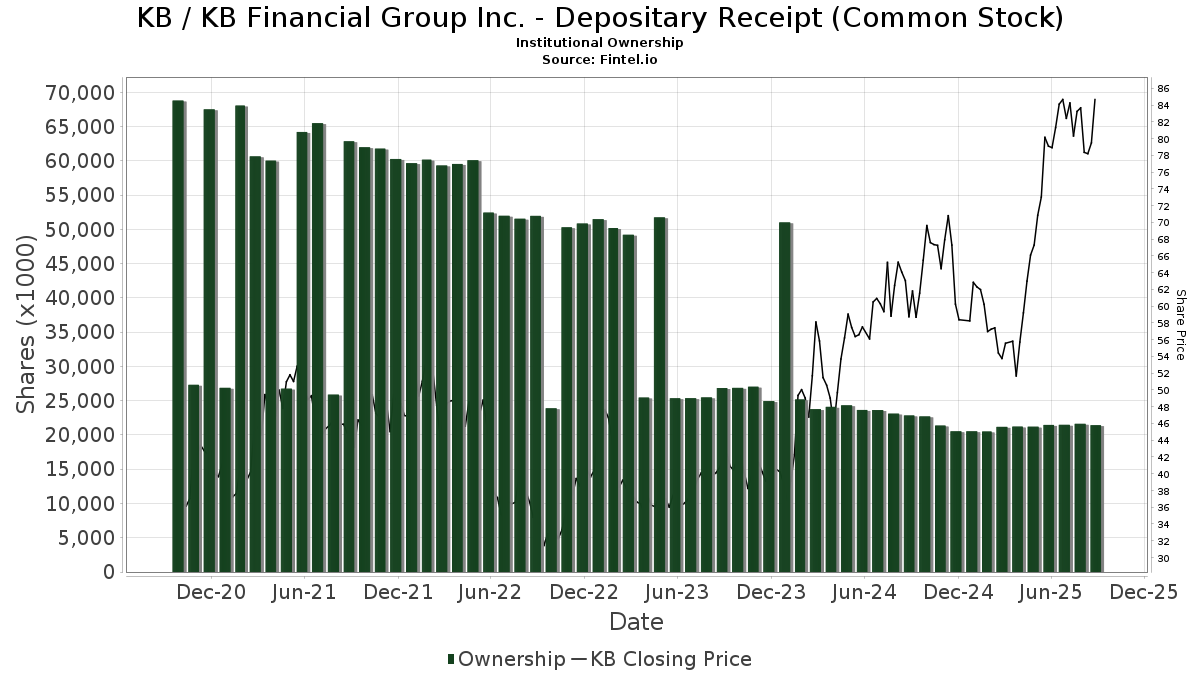
Proprietà istituzionale e azionisti
KB Financial Group Inc. - Depositary Receipt (Common Stock) (US:KB) ha 314 proprietari istituzionali e azionisti che hanno presentato i moduli 13D/G o 13F alla Securities Exchange Commission (SEC). Queste istituzioni detengono un totale di 21,420,601 azioni. I maggiori azionisti includono Dimensional Fund Advisors Lp, Dimensional Emerging Markets Value Fund - Dimensional Emerging Markets Value Fund, BlackRock, Inc., Lazard Asset Management Llc, Morgan Stanley, Arrowstreet Capital, Limited Partnership, Northern Trust Corp, Bank Of America Corp /de/, American Century Companies Inc, and Connor, Clark & Lunn Investment Management Ltd. .
(KB Financial Group Inc. - Depositary Receipt (Common Stock) (NYSE:KB) la struttura proprietaria istituzionale mostra le attuali posizioni nella società da parte di istituzioni e fondi, nonché le ultime variazioni nella dimensione della posizione. I principali azionisti possono essere singoli investitori, fondi comuni, hedge fund o istituzioni. L'allegato 13D indica che l'investitore detiene (o ha detenuto) più del 5% della società e intende (o intendeva) perseguire attivamente un cambiamento nella strategia aziendale. L'allegato 13G indica un investimento passivo superiore al 5%.
The share price as of September 4, 2025 is 78,22 / share. Previously, on September 5, 2024, the share price was 63,68 / share. This represents an increase of 22,83% over that period.
Indice del sentiment dei fondi
L'indice del sentiment dei fondi (anche noto come "indice di accumulo di proprietà") individua i titoli più acquistati dai fondi. È il risultato di un sofisticato modello quantitativo multi-fattore che identifica le società con i più alti livelli di accumulo istituzionale. Il modello utilizza una combinazione dell'aumento totale dei proprietari dichiarati, delle variazioni nelle allocazioni di portafoglio di tali proprietari e di altre metriche. Il punteggio varia da 0 a 100: i numeri più alti indicano un livello di accumulo superiore ad altre società, mentre 50 rappresenta la media.
Frequenza di aggiornamento: giornaliera
Consulta Ownership Explorer per visualizzare l'elenco delle aziende con il ranking più alto.
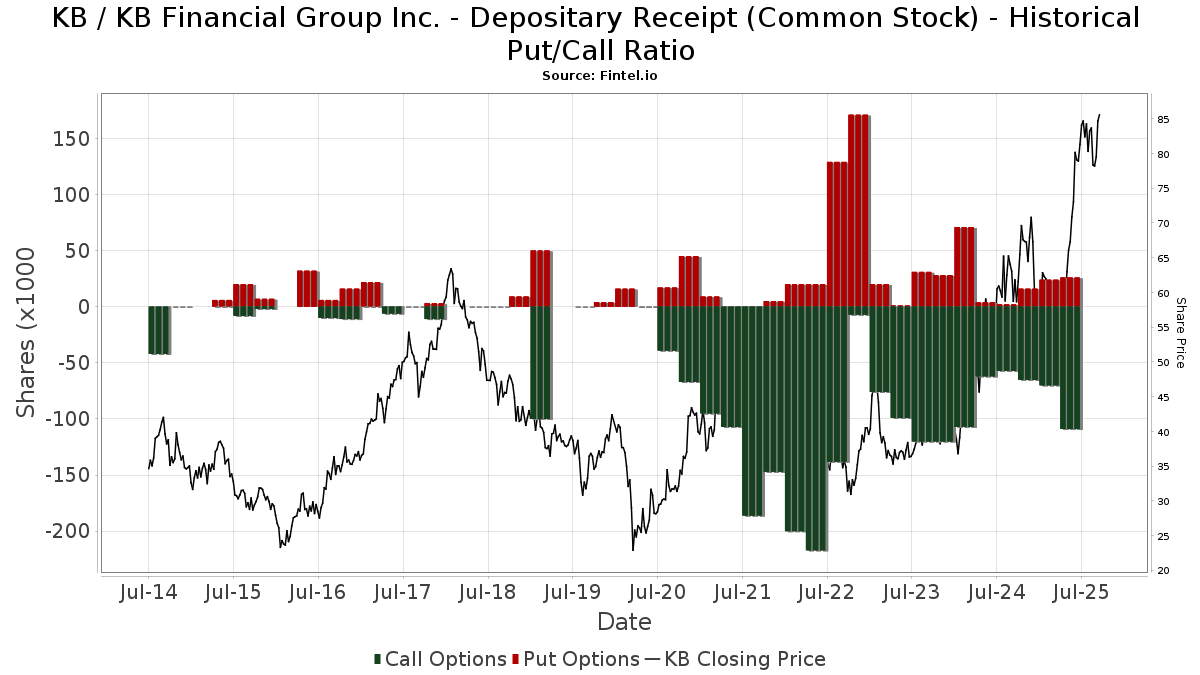
Rapporto put/call istituzionale
Oltre a segnalare le emissioni standard di titoli azionari e di debito, gli istituti con più di 100 milioni di asset in gestione devono anche dichiarare le loro partecipazioni in opzioni put e call. Poiché le opzioni put indicano generalmente un sentiment negativo e le opzioni call un sentiment positivo, possiamo avere un'idea del sentiment istituzionale complessivo attraverso il rapporto tra put e call. Il grafico a destra mostra il rapporto storico put/call per questo strumento.
L'utilizzo del rapporto put/call come indicatore del sentiment degli investitori consente di superare una delle principali lacune dell'utilizzo della proprietà istituzionale totale, ovvero il fatto che una quantità significativa di asset in gestione viene investita passivamente per seguire gli indici. Generalmente, i fondi a gestione passiva non acquistano opzioni, per cui il rapporto put/call riflette più fedelmente il sentiment dei fondi a gestione attiva.
Depositi 13F e NPORT
Le informazioni relative ai depositi 13F sono gratuite. Per accedere alle informazioni relative ai depositi NP è necessario un'abbonamento premium. Le righe verdi indicano le nuove posizioni. Le righe rosse indicano le posizioni chiuse. Fai clic sull'icona del link per visualizzare la cronologia completa delle transazioni.
Esegui l'upgrade
per sbloccare i dati premium ed esportarli in Excel ![]() .
.
| Data di deposito | Fonte | Investitore | Tipo | Prezzo medio (Stima) |
Azioni | Δ Azioni (%) |
Valore dichiarato ($ 1000) |
Δ Valore (%) |
Allocazione del portafoglio (%) |
|
|---|---|---|---|---|---|---|---|---|---|---|
| 2025-07-14 | 13F | GAMMA Investing LLC | 1.836 | 105,60 | 152 | 214,58 | ||||
| 2025-06-26 | NP | BLACKROCK FUNDS - BlackRock Advantage Emerging Markets Fund Investor A Shares | 226 | -86,18 | 14 | -86,27 | ||||
| 2025-08-14 | 13F | Verition Fund Management LLC | 0 | -100,00 | 0 | |||||
| 2025-08-11 | 13F | NewEdge Wealth, LLC | 67.699 | 1,33 | 5.594 | 54,72 | ||||
| 2025-07-08 | 13F | Rise Advisors, LLC | 6 | 100,00 | 0 | |||||
| 2025-08-14 | 13F | Aquatic Capital Management LLC | 7.128 | -61,70 | 589 | -41,55 | ||||
| 2025-08-08 | 13F | SG Americas Securities, LLC | 6.359 | -83,23 | 1 | -100,00 | ||||
| 2025-04-21 | 13F | CWA Asset Management Group, LLC | 0 | -100,00 | 0 | -100,00 | ||||
| 2025-08-06 | 13F | Vestmark Advisory Solutions, Inc. | 0 | -100,00 | 0 | |||||
| 2025-08-12 | 13F | Dimensional Fund Advisors Lp | 2.620.620 | 5,05 | 216.418 | 60,37 | ||||
| 2025-08-13 | 13F | Capital International Investors | 671.937 | 22,44 | 55.260 | 86,95 | ||||
| 2025-07-28 | NP | AVEM - Avantis Emerging Markets Equity ETF This fund is a listed as child fund of American Century Companies Inc and if that institution has disclosed ownership in this security, then these positions will not be double counted when calculating total shares and total value | 617.724 | 21,45 | 46.175 | 67,13 | ||||
| 2025-08-11 | 13F | B. Metzler seel. Sohn & Co. AG | 77.332 | -10,49 | 6.387 | 36,63 | ||||
| 2025-07-30 | 13F | Cullen/frost Bankers, Inc. | 418 | 0,00 | 35 | 54,55 | ||||
| 2025-08-14 | 13F | Aspen Grove Capital, LLC | 6.061 | 0,55 | 501 | 52,44 | ||||
| 2025-05-05 | 13F | Lindbrook Capital, Llc | 5.002 | 0,91 | 271 | -4,26 | ||||
| 2025-08-13 | 13F | Groupama Asset Managment | 19.478 | 1,88 | 1.588 | 55,59 | ||||
| 2025-05-15 | 13F | Talon Private Wealth, LLC | 0 | -100,00 | 0 | -100,00 | ||||
| 2025-08-01 | 13F | Envestnet Asset Management Inc | 174.924 | 0,39 | 14.447 | 53,22 | ||||
| 2025-08-05 | 13F | Westside Investment Management, Inc. | 385 | 32 | ||||||
| 2025-08-13 | 13F | Mirabella Financial Services Llp | 7.346 | -97,10 | 609 | -95,58 | ||||
| 2025-08-14 | 13F | Prelude Capital Management, Llc | 0 | -100,00 | 0 | |||||
| 2025-07-29 | NP | GIMFX - GMO Implementation Fund | 8.621 | 0,00 | 644 | 37,61 | ||||
| 2025-07-30 | 13F | Whittier Trust Co | 233 | 19 | ||||||
| 2025-08-18 | 13F/A | National Bank Of Canada /fi/ | 69 | 0,00 | 6 | 66,67 | ||||
| 2025-07-18 | 13F | BSW Wealth Partners | 3.611 | 298 | ||||||
| 2025-07-30 | 13F | Whittier Trust Co Of Nevada Inc | 107 | 15,05 | 9 | 60,00 | ||||
| 2025-08-07 | 13F | Parkside Financial Bank & Trust | 336 | 585,71 | 28 | 1.250,00 | ||||
| 2025-07-29 | 13F | Calamos Wealth Management LLC | 36.409 | 3.007 | ||||||
| 2025-07-21 | 13F | Qrg Capital Management, Inc. | 15.147 | 13,08 | 1.251 | 72,65 | ||||
| 2025-07-23 | 13F | Trinity Street Asset Management LLP | 328.551 | -0,55 | 27.135 | 51,79 | ||||
| 2025-08-12 | 13F | LPL Financial LLC | 11.519 | 163,47 | 951 | 302,97 | ||||
| 2025-07-18 | 13F | Generali Investments CEE, investicni spolecnost, a.s. | 34.888 | 0,00 | 2.881 | 52,68 | ||||
| 2025-08-14 | 13F | Aqr Capital Management Llc | 14.448 | 160,18 | 1.193 | 297,67 | ||||
| 2025-05-15 | 13F | StoneX Group Inc. | 0 | -100,00 | 0 | -100,00 | ||||
| 2025-08-13 | 13F | Todd Asset Management Llc | 528.787 | -8,15 | 43.673 | 40,19 | ||||
| 2025-08-12 | 13F | Coldstream Capital Management Inc | 7.663 | 280,30 | 633 | 479,82 | ||||
| 2025-08-14 | 13F | D. E. Shaw & Co., Inc. | 0 | -100,00 | 0 | |||||
| 2025-08-14 | 13F | Banque Transatlantique SA | 0 | -100,00 | 0 | |||||
| 2025-07-15 | 13F | Fifth Third Bancorp | 8.320 | 1,24 | 687 | 54,73 | ||||
| 2025-07-25 | 13F | Sequoia Financial Advisors, LLC | 15.984 | 12,74 | 1.320 | 72,10 | ||||
| 2025-07-21 | 13F | Ascent Group, LLC | 3.261 | 269 | ||||||
| 2025-08-05 | 13F | Bridgewater Advisors Inc. | 8.059 | 0,44 | 641 | 29,29 | ||||
| 2025-07-31 | 13F | Caitong International Asset Management Co., Ltd | 14 | 1 | ||||||
| 2025-08-05 | 13F | Bank of New York Mellon Corp | 15.004 | 1,97 | 1.239 | 55,65 | ||||
| 2025-08-11 | 13F | Annis Gardner Whiting Capital Advisors, LLC | 148 | 12 | ||||||
| 2025-08-14 | 13F | Mercer Global Advisors Inc /adv | 10.750 | -4,33 | 888 | 45,89 | ||||
| 2025-08-13 | 13F | Grantham, Mayo, Van Otterloo & Co. LLC | 53.153 | -19,48 | 4.390 | 22,87 | ||||
| 2025-08-14 | 13F | Aprio Wealth Management, LLC | 9.851 | 2,43 | 814 | 56,35 | ||||
| 2025-08-15 | 13F | Tower Research Capital LLC (TRC) | 570 | -72,33 | 47 | -57,66 | ||||
| 2025-08-14 | 13F | Raymond James Financial Inc | 150.464 | 18,47 | 12.427 | 80,82 | ||||
| 2025-07-24 | 13F | Ronald Blue Trust, Inc. | 5.665 | -7,27 | 468 | 41,52 | ||||
| 2025-08-04 | 13F | Assetmark, Inc | 225 | 122,77 | 19 | 260,00 | ||||
| 2025-08-13 | 13F | Walleye Trading LLC | Put | 13.200 | 1.090 | |||||
| 2025-08-13 | 13F | Walleye Trading LLC | Call | 16.700 | 1.379 | |||||
| 2025-08-14 | 13F | Quantinno Capital Management LP | 42.301 | 60,20 | 3.494 | 144,61 | ||||
| 2025-06-23 | NP | UUPIX - Ultraemerging Markets Profund Investor Class | 1.447 | 3,73 | 91 | 4,60 | ||||
| 2025-08-05 | 13F | NewSquare Capital LLC | 154 | 113,89 | 13 | 300,00 | ||||
| 2025-08-13 | 13F | Jones Financial Companies Lllp | 174 | 0,00 | 14 | 55,56 | ||||
| 2025-07-25 | 13F | Yousif Capital Management, Llc | 38.413 | -6,74 | 3.173 | 42,37 | ||||
| 2025-08-13 | 13F | Walleye Trading LLC | 1.072 | 89 | ||||||
| 2025-07-15 | 13F | Public Employees Retirement System Of Ohio | 115.825 | -4,98 | 9.566 | 45,01 | ||||
| 2025-08-11 | 13F | Principal Securities, Inc. | 62 | 37,78 | 5 | 150,00 | ||||
| 2025-08-13 | 13F | Capital Research Global Investors | 59.551 | 18,12 | 4.854 | 80,45 | ||||
| 2025-07-16 | 13F | Perigon Wealth Management, LLC | 0 | -100,00 | 0 | |||||
| 2025-04-18 | 13F | Insigneo Advisory Services, Llc | 0 | -100,00 | 0 | -100,00 | ||||
| 2025-07-09 | 13F | Sivia Capital Partners, LLC | 4.112 | -19,04 | 340 | 23,72 | ||||
| 2025-05-15 | 13F/A | Orion Portfolio Solutions, LLC | 10.465 | -2,12 | 566 | -6,91 | ||||
| 2025-07-17 | 13F | Park Place Capital Corp | 504 | 0,00 | 42 | 51,85 | ||||
| 2025-08-01 | 13F | Financial Counselors Inc | 0 | -100,00 | 0 | |||||
| 2025-08-20 | NP | REMG - Emerging Markets Equity Active ETF | 3.325 | 275 | ||||||
| 2025-08-13 | 13F | Invesco Ltd. | 152.939 | 508,93 | 12.631 | 829,43 | ||||
| 2025-07-25 | NP | DEMAX - Delaware Emerging Markets Fund Class A | 245.928 | 0,00 | 18.383 | 37,62 | ||||
| 2025-08-13 | 13F | Schroder Investment Management Group | 64.244 | 24,30 | 5.306 | 92,42 | ||||
| 2025-06-26 | NP | DEXC - Dimensional Emerging Markets ex China Core Equity ETF | 7.590 | 21,46 | 478 | 22,56 | ||||
| 2025-07-30 | 13F | Eqis Capital Management, Inc. | 3.567 | -12,59 | 295 | 33,64 | ||||
| 2025-08-06 | 13F | First Horizon Advisors, Inc. | 303 | 25 | ||||||
| 2025-08-13 | 13F | Cresset Asset Management, LLC | 3.320 | -13,27 | 274 | 32,37 | ||||
| 2025-06-26 | NP | SNTKX - Steward International Enhanced Index Fund Class A | 8.767 | 36.429,17 | 552 | 55.100,00 | ||||
| 2025-07-24 | NP | SHP ETF Trust - FIS Knights of Columbus Global Belief ETF | 4.512 | 0,00 | 337 | 37,55 | ||||
| 2025-08-11 | 13F | United Capital Financial Advisers, Llc | 5.806 | -0,26 | 480 | 52,55 | ||||
| 2025-07-17 | 13F | Clean Yield Group | 293 | 0,00 | 24 | 60,00 | ||||
| 2025-07-28 | NP | VCGEX - Emerging Economies Fund | 5.475 | 12,63 | 409 | 54,92 | ||||
| 2025-07-31 | 13F | Glass Jacobson Investment Advisors llc | 0 | -100,00 | 0 | |||||
| 2025-07-28 | 13F | Ritholtz Wealth Management | 49.892 | -4,22 | 4.121 | 46,20 | ||||
| 2025-08-11 | 13F | Raiffeisen Bank International AG | 7.656 | -22,42 | 623 | 18,25 | ||||
| 2025-08-14 | 13F | Glenmede Investment Management, LP | 3.237 | 267 | ||||||
| 2025-08-14 | 13F | Two Sigma Investments, Lp | 93.977 | -32,98 | 7.762 | 2,29 | ||||
| 2025-08-14 | 13F | Two Sigma Advisers, Lp | 38.900 | -24,02 | 3.213 | 15,96 | ||||
| 2025-07-16 | 13F | Signaturefd, Llc | 25.794 | -1,47 | 2.130 | 50,42 | ||||
| 2025-08-14 | 13F | Evergreen Capital Management Llc | 4.390 | 363 | ||||||
| 2025-08-14 | 13F | Group One Trading, L.p. | Put | 100 | 8 | |||||
| 2025-08-14 | 13F | Group One Trading, L.p. | Call | 11.600 | 1,75 | 958 | 55,52 | |||
| 2025-08-14 | 13F | Henry James International Management Inc. | 63.108 | 0,04 | 5.212 | 52,71 | ||||
| 2025-07-16 | 13F | Banque Pictet & Cie Sa | 6.526 | 56,80 | 539 | 139,11 | ||||
| 2025-08-07 | 13F | Connor, Clark & Lunn Investment Management Ltd. | 734.981 | -12,96 | 60.702 | 32,86 | ||||
| 2025-08-12 | 13F | Atlas Capital Advisors Llc | 8.898 | 1,95 | 735 | 55,51 | ||||
| 2025-08-11 | 13F | Bell Investment Advisors, Inc | 282 | -5,69 | 23 | 43,75 | ||||
| 2025-08-27 | 13F/A | Squarepoint Ops LLC | 0 | -100,00 | 0 | -100,00 | ||||
| 2025-07-28 | NP | AVEEX - Avantis Emerging Markets Equity Fund Institutional Class This fund is a listed as child fund of American Century Companies Inc and if that institution has disclosed ownership in this security, then these positions will not be double counted when calculating total shares and total value | 25.431 | 0,00 | 1.901 | 37,58 | ||||
| 2025-08-06 | 13F | Pekin Hardy Strauss, Inc. | 3.000 | 248 | ||||||
| 2025-07-24 | 13F | Ramirez Asset Management, Inc. | 304.298 | 24,59 | 25.132 | 90,17 | ||||
| 2025-08-12 | 13F | Dynamic Technology Lab Private Ltd | 0 | -100,00 | 0 | |||||
| 2025-08-14 | 13F | GWM Advisors LLC | 12.154 | 0,75 | 1.004 | 53,83 | ||||
| 2025-08-07 | 13F | Legacy Advisors, LLC | 0 | -100,00 | 0 | |||||
| 2025-08-13 | 13F | Capital International Inc /ca/ | 36.395 | -2,56 | 3.006 | 48,69 | ||||
| 2025-06-26 | NP | DFAE - Dimensional Emerging Core Equity Market ETF | 59.962 | 36,31 | 3.776 | 37,41 | ||||
| 2025-07-23 | 13F | Canopy Partners, LLC | 6.728 | 0,28 | 556 | 52,89 | ||||
| 2025-08-13 | 13F | West Family Investments, Inc. | 11.486 | 20,66 | 949 | 84,08 | ||||
| 2025-07-16 | NP | CGDG - Capital Group Dividend Growers ETF Share Class | 302.977 | 34,56 | 22.648 | 85,18 | ||||
| 2025-08-07 | 13F | Vise Technologies, Inc. | 36.360 | 71,44 | 3.003 | 148,92 | ||||
| 2025-08-12 | 13F | Jpmorgan Chase & Co | 43.178 | -77,14 | 3.566 | -65,10 | ||||
| 2025-05-06 | 13F | Venturi Wealth Management, LLC | 0 | -100,00 | 0 | |||||
| 2025-07-31 | 13F | Buckingham Strategic Partners | 2.899 | 239 | ||||||
| 2025-06-30 | NP | VT - Vanguard Total World Stock Index Fund ETF Shares | 39.869 | 0,00 | 2.511 | 0,80 | ||||
| 2025-08-13 | 13F | Amundi | 17.820 | -76,82 | 1.499 | -62,74 | ||||
| 2025-07-14 | 13F | Abound Wealth Management | 10 | 0,00 | 1 | |||||
| 2025-08-14 | 13F | Harris Associates L P | 3.545 | 293 | ||||||
| 2025-08-07 | 13F | Acadian Asset Management Llc | 97.490 | -21,19 | 8 | 33,33 | ||||
| 2025-08-13 | 13F | Northern Trust Corp | 956.289 | -0,08 | 78.980 | 52,50 | ||||
| 2025-07-29 | NP | BPLSX - Boston Partners Long/Short Equity Fund INSTITUTIONAL | 14.036 | 15,26 | 1.049 | 58,70 | ||||
| 2025-07-17 | 13F | Beacon Capital Management, LLC | 39 | 0,00 | 3 | 50,00 | ||||
| 2025-08-15 | 13F | Morgan Stanley | 985.573 | 4,02 | 81.399 | 58,78 | ||||
| 2025-06-26 | NP | Dimensional Emerging Markets Value Fund - Dimensional Emerging Markets Value Fund This fund is a listed as child fund of Dimensional Fund Advisors Lp and if that institution has disclosed ownership in this security, then these positions will not be double counted when calculating total shares and total value | 1.765.706 | -0,26 | 111.204 | 0,55 | ||||
| 2025-08-13 | 13F | Twin Peaks Wealth Advisors, LLC | 181 | 15 | ||||||
| 2025-07-09 | 13F | Bruce G. Allen Investments, LLC | 481 | -48,06 | 40 | -22,00 | ||||
| 2025-08-14 | 13F | Ieq Capital, Llc | 8.263 | 682 | ||||||
| 2025-08-11 | 13F | Brown Brothers Harriman & Co | 160 | 13 | ||||||
| 2025-08-13 | 13F | Capital Analysts, Inc. | 139 | -14,20 | 0 | |||||
| 2025-08-14 | 13F | Erste Asset Management GmbH | 5.000 | 408 | ||||||
| 2025-08-13 | 13F | Quadrant Capital Group Llc | 30.642 | 10,69 | 2.531 | 69,00 | ||||
| 2025-07-29 | NP | GBFFX - GMO Benchmark-Free Fund Class III | 3.654 | 0,00 | 273 | 37,88 | ||||
| 2025-08-04 | 13F | Virtus Family Office LLC | 19.619 | 18,64 | 1.620 | 79,40 | ||||
| 2025-08-14 | 13F | Strategic Global Advisors, LLC | 3.430 | 283 | ||||||
| 2025-08-12 | 13F | SRS Capital Advisors, Inc. | 322 | 27 | ||||||
| 2025-08-14 | 13F | Atomi Financial Group, Inc. | 11.310 | 27,62 | 934 | 94,99 | ||||
| 2025-07-15 | 13F | Maseco Llp | 99 | 8 | ||||||
| 2025-08-04 | 13F | Simon Quick Advisors, Llc | 3.131 | 259 | ||||||
| 2025-06-26 | NP | DFSE - Dimensional Emerging Markets Sustainability Core 1 ETF | 4.208 | 4,91 | 265 | 6,00 | ||||
| 2025-08-14 | 13F | Balyasny Asset Management Llc | 25.305 | -11,87 | 2.090 | 34,51 | ||||
| 2025-08-12 | 13F | Franklin Resources Inc | 6.102 | 0,54 | 504 | 53,35 | ||||
| 2025-07-14 | 13F | UMA Financial Services, Inc. | 57 | 128,00 | 5 | 300,00 | ||||
| 2025-07-24 | 13F | Jfs Wealth Advisors, Llc | 515 | 3,41 | 43 | 61,54 | ||||
| 2025-08-14 | 13F/A | Bank Julius Baer & Co. Ltd, Zurich | 22.958 | 10,87 | 1.896 | 49,76 | ||||
| 2025-08-14 | 13F | Macquarie Group Ltd | 251.278 | -0,04 | 20.753 | 52,58 | ||||
| 2025-08-14 | 13F | Wealth Preservation Advisors, LLC | 29 | 2 | ||||||
| 2025-05-29 | NP | JVANX - International Equity Index Trust NAV | 0 | -100,00 | 0 | -100,00 | ||||
| 2025-05-12 | 13F | Polen Capital Management Llc | 0 | -100,00 | 0 | -100,00 | ||||
| 2025-08-13 | 13F | Russell Investments Group, Ltd. | 6.804 | 4.725,53 | 562 | 7.914,29 | ||||
| 2025-08-14 | 13F | Citadel Advisors Llc | 7.464 | -59,75 | 616 | -38,58 | ||||
| 2025-08-18 | 13F | Geneos Wealth Management Inc. | 8 | 1 | ||||||
| 2025-08-13 | 13F | Advisory Research Inc | 97.765 | 5,47 | 8.074 | 61,00 | ||||
| 2025-08-14 | 13F | Citadel Advisors Llc | Put | 3.900 | 105,26 | 322 | 215,69 | |||
| 2025-07-21 | 13F | Hgk Asset Management Inc | 0 | -100,00 | 0 | |||||
| 2025-07-30 | NP | APIE - ActivePassive International Equity ETF | 26.271 | -25,65 | 1.964 | 2,29 | ||||
| 2025-07-21 | 13F | Hilltop National Bank | 0 | -100,00 | 0 | |||||
| 2025-08-04 | 13F | Hantz Financial Services, Inc. | 771 | 817,86 | 0 | |||||
| 2025-06-26 | NP | DFCEX - Emerging Markets Core Equity Portfolio - Institutional Class This fund is a listed as child fund of Dimensional Fund Advisors Lp and if that institution has disclosed ownership in this security, then these positions will not be double counted when calculating total shares and total value | 367.901 | 0,00 | 23.170 | 0,82 | ||||
| 2025-08-14 | 13F | Citadel Advisors Llc | Call | 19.700 | 129,07 | 1.627 | 249,89 | |||
| 2025-05-09 | 13F | Deutsche Bank Ag\ | 0 | -100,00 | 0 | -100,00 | ||||
| 2025-08-07 | 13F | Hennion & Walsh Asset Management, Inc. | 10.866 | 31,61 | 897 | 101,12 | ||||
| 2025-08-13 | 13F | Bare Financial Services, Inc | 148 | 190,20 | 12 | 500,00 | ||||
| 2025-08-12 | 13F | BlackRock, Inc. | 1.671.572 | 3,22 | 138.055 | 57,55 | ||||
| 2025-08-14 | 13F | Boston Private Wealth Llc | 0 | -100,00 | 0 | -100,00 | ||||
| 2025-08-13 | 13F | Walleye Capital LLC | 674 | 56 | ||||||
| 2025-08-13 | 13F | Walleye Capital LLC | Call | 2.500 | 206 | |||||
| 2025-08-14 | 13F | Orbis Allan Gray Ltd | 370.306 | 0,91 | 30.584 | 54,02 | ||||
| 2025-06-26 | NP | DFEM - Dimensional Emerging Markets Core Equity 2 ETF | 26.085 | 18,04 | 1.643 | 18,99 | ||||
| 2025-07-25 | 13F | Verdence Capital Advisors LLC | 2.626 | 217 | ||||||
| 2025-08-14 | 13F | Millennium Management Llc | 33.034 | -10,11 | 2.728 | 37,22 | ||||
| 2025-07-23 | 13F | High Note Wealth, LLC | 4 | 0 | ||||||
| 2025-08-14 | 13F | Bank Of America Corp /de/ | 845.567 | 9,15 | 69.835 | 66,60 | ||||
| 2025-08-26 | NP | Profunds - Profund Vp Emerging Markets | 6.316 | 17,01 | 522 | 78,42 | ||||
| 2025-07-25 | 13F | Pzena Investment Management Llc | 41.601 | -17,38 | 3.436 | 26,10 | ||||
| 2025-06-26 | NP | HFIGX - Hartford Schroders Diversified Growth Fund Class I | 1.713 | 28,03 | 108 | 28,92 | ||||
| 2025-07-28 | 13F | Naviter Wealth, LLC | 4.507 | 372 | ||||||
| 2025-07-08 | 13F | Parallel Advisors, LLC | 10.756 | 10,22 | 888 | 68,18 | ||||
| 2025-07-17 | 13F | HB Wealth Management, LLC | 3.059 | 253 | ||||||
| 2025-08-08 | 13F | D'Orazio & Associates, Inc. | 2.662 | 220 | ||||||
| 2025-08-08 | 13F | Ranmore Fund Management Ltd | 255.549 | 8,49 | 21.106 | 65,59 | ||||
| 2025-08-11 | 13F | TD Waterhouse Canada Inc. | 0 | -100,00 | 0 | |||||
| 2025-08-11 | 13F | Vanguard Group Inc | 368.458 | 0,00 | 30.431 | 52,63 | ||||
| 2025-08-13 | 13F | Thornburg Investment Management Inc | 5.650 | -79,42 | 467 | -96,86 | ||||
| 2025-08-08 | 13F | Candriam Luxembourg S.C.A. | 6.063 | 0,00 | 501 | 52,44 | ||||
| 2025-06-26 | NP | DFA INVESTMENT DIMENSIONS GROUP INC - Emerging Markets Social Core Equity Portfolio Shares | 10.427 | 0,00 | 657 | 0,77 | ||||
| 2025-08-14 | 13F | Royal Bank Of Canada | 340.327 | 24,62 | 28.109 | 90,20 | ||||
| 2025-06-26 | NP | Dfa Investment Trust Co - The Emerging Markets Series This fund is a listed as child fund of Dimensional Fund Advisors Lp and if that institution has disclosed ownership in this security, then these positions will not be double counted when calculating total shares and total value | 2.997 | -28,20 | 189 | -27,69 | ||||
| 2025-08-04 | 13F | Atria Investments Llc | 9.581 | 53,00 | 791 | 134,02 | ||||
| 2025-08-13 | 13F | Congress Wealth Management LLC / DE / | 5.217 | -49,40 | 431 | -22,80 | ||||
| 2025-07-28 | NP | AVES - Avantis Emerging Markets Value ETF This fund is a listed as child fund of American Century Companies Inc and if that institution has disclosed ownership in this security, then these positions will not be double counted when calculating total shares and total value | 76.629 | 11,60 | 5.728 | 53,61 | ||||
| 2025-08-14 | 13F | Voya Investment Management Llc | 34.575 | 2.856 | ||||||
| 2025-05-15 | 13F | Cullen Capital Management, LLC | 93.222 | -26,93 | 5.044 | -30,51 | ||||
| 2025-07-18 | 13F | Deltec Asset Management Llc | 17.000 | -2,86 | 1.404 | 48,41 | ||||
| 2025-07-25 | 13F | JustInvest LLC | 51.141 | 18,17 | 4.224 | 80,39 | ||||
| 2025-08-14 | 13F/A | Barclays Plc | 4.870 | -72,55 | 0 | |||||
| 2025-07-30 | 13F | DekaBank Deutsche Girozentrale | 10.687 | 0,00 | 1 | |||||
| 2025-07-30 | 13F | Drive Wealth Management, Llc | 3.366 | 278 | ||||||
| 2025-07-31 | 13F | Cambridge Investment Research Advisors, Inc. | 5.465 | 45,23 | 0 | |||||
| 2025-08-14 | 13F | Susquehanna International Group, Llp | Call | 18.800 | -9,62 | 1.553 | 37,96 | |||
| 2025-08-14 | 13F | Susquehanna International Group, Llp | Put | 9.500 | -54,55 | 785 | -30,62 | |||
| 2025-08-14 | 13F | Ameriprise Financial Inc | 9.641 | -4,17 | 796 | 46,32 | ||||
| 2025-08-13 | 13F | Shelton Capital Management | 4.409 | 364 | ||||||
| 2025-07-14 | 13F | Foster Group, Inc. | 3.545 | 293 | ||||||
| 2025-07-16 | 13F | Highline Wealth Partners Llc | 112 | 119,61 | 9 | 350,00 | ||||
| 2025-08-13 | 13F | Guggenheim Capital Llc | 22.225 | 15,70 | 1.836 | 76,61 | ||||
| 2025-05-15 | 13F | Nomura Holdings Inc | 0 | -100,00 | 0 | |||||
| 2025-08-12 | 13F | O'shaughnessy Asset Management, Llc | 122.938 | 6,30 | 10.153 | 62,27 | ||||
| 2025-08-11 | 13F | Lsv Asset Management | 20.100 | 0,00 | 2 | 0,00 | ||||
| 2025-08-13 | 13F | Quantbot Technologies LP | 4.753 | 393 | ||||||
| 2025-07-30 | 13F | Blume Capital Management, Inc. | 4 | 0 | ||||||
| 2025-08-08 | 13F | Hartland & Co., LLC | 83 | 0,00 | 7 | 50,00 | ||||
| 2025-08-14 | 13F | Warren Averett Asset Management, LLC | 5.069 | 0,00 | 419 | 52,55 | ||||
| 2025-07-28 | NP | NSI - National Security Emerging Markets Index ETF | 1.685 | 38,68 | 126 | 92,31 | ||||
| 2025-07-29 | NP | RBB FUND, INC. - Aquarius International Fund | 6.431 | 0,00 | 481 | 37,54 | ||||
| 2025-08-29 | NP | SA FUNDS INVESTMENT TRUST - SA Emerging Markets Value Fund | 17.477 | -10,78 | 1.443 | 36,26 | ||||
| 2025-08-05 | 13F | Bank Of Montreal /can/ | 62.296 | 16,46 | 5.145 | 77,78 | ||||
| 2025-08-07 | 13F | Allworth Financial LP | 1.298 | 5,70 | 107 | 48,61 | ||||
| 2025-08-05 | 13F | Simplex Trading, Llc | Put | 100 | -92,31 | 0 | ||||
| 2025-08-05 | 13F | Simplex Trading, Llc | 832 | -12,51 | 0 | |||||
| 2025-08-12 | 13F | Rhumbline Advisers | 37.811 | -16,22 | 3.123 | 27,85 | ||||
| 2025-07-25 | 13F | Johnson Investment Counsel Inc | 2.733 | 226 | ||||||
| 2025-08-05 | 13F | Simplex Trading, Llc | Call | 10.300 | 1 | |||||
| 2025-08-06 | 13F | Commonwealth Equity Services, Llc | 6.613 | -33,88 | 1 | |||||
| 2025-08-12 | 13F | Seeds Investor Llc | 6.379 | 19,70 | 527 | 82,64 | ||||
| 2025-07-08 | 13F | Arlington Trust Co LLC | 112 | 0,00 | 9 | 50,00 | ||||
| 2025-07-14 | 13F | AdvisorNet Financial, Inc | 96 | -28,36 | 8 | 0,00 | ||||
| 2025-07-28 | NP | AVXC - Avantis Emerging Markets ex-China Equity ETF | 5.924 | 37,35 | 443 | 88,89 | ||||
| 2025-08-05 | 13F | Huntington National Bank | 978 | 2,19 | 81 | 56,86 | ||||
| 2025-08-06 | 13F | Paradigm Asset Management Co Llc | 600 | 0,00 | 50 | 53,13 | ||||
| 2025-08-14 | 13F | Wellington Management Group Llp | 112.677 | -0,47 | 9.306 | 51,92 | ||||
| 2025-08-14 | 13F | Integrated Wealth Concepts LLC | 4.102 | 339 | ||||||
| 2025-08-13 | 13F | First Trust Advisors Lp | 16.481 | -14,16 | 1.361 | 31,12 | ||||
| 2025-08-14 | 13F | Ariel Investments, Llc | 52.122 | -50,06 | 4.305 | -23,78 | ||||
| 2025-08-14 | 13F/A | Rockefeller Capital Management L.P. | 15.458 | -0,92 | 1.277 | 51,18 | ||||
| 2025-08-15 | 13F | WealthCollab, LLC | 898 | -4,77 | 74 | 45,10 | ||||
| 2025-08-14 | 13F | Wetherby Asset Management Inc | 55.945 | 2,21 | 4.620 | 48,36 | ||||
| 2025-08-14 | 13F | Stifel Financial Corp | 24.603 | 22,18 | 2.032 | 86,50 | ||||
| 2025-08-06 | 13F | BNP Paribas Asset Management Holding S.A. | 109.808 | 9 | ||||||
| 2025-05-01 | 13F | Schechter Investment Advisors, LLC | 4.953 | -25,57 | 268 | -29,37 | ||||
| 2025-08-08 | 13F | Crossmark Global Holdings, Inc. | 29.535 | 76,29 | 2.439 | 169,21 | ||||
| 2025-08-11 | 13F | Hexagon Capital Partners LLC | 0 | -100,00 | 0 | |||||
| 2025-08-13 | 13F | Mount Yale Investment Advisors, LLC | 2.464 | 204 | ||||||
| 2025-05-15 | 13F | Glenmede Trust Co Na | 3.755 | -21,15 | 203 | -24,81 | ||||
| 2025-08-14 | 13F | Mml Investors Services, Llc | 4.126 | 5,26 | 0 | |||||
| 2025-08-14 | 13F | Goldman Sachs Group Inc | 190.327 | -9,51 | 15.719 | 38,12 | ||||
| 2025-06-30 | NP | VEU - Vanguard FTSE All-World ex-US Index Fund ETF Shares | 295.077 | 0,00 | 18.584 | 0,81 | ||||
| 2025-08-13 | 13F | Kilter Group LLC | 53 | 4 | ||||||
| 2025-08-14 | 13F | Mariner, LLC | 28.869 | 14,60 | 2.383 | 74,96 | ||||
| 2025-08-11 | 13F | Frank, Rimerman Advisors LLC | 8.151 | 673 | ||||||
| 2025-05-02 | 13F | Cable Hill Partners, LLC | 5.459 | -2,20 | 344 | 8,20 | ||||
| 2025-08-04 | 13F | Spire Wealth Management | 59 | 5 | ||||||
| 2025-08-14 | 13F | Axa S.a. | 19.169 | 0,00 | 1.583 | 52,65 | ||||
| 2025-07-24 | 13F | Us Bancorp \de\ | 21.300 | 4,20 | 1.759 | 59,04 | ||||
| 2025-08-08 | 13F | JBF Capital, Inc. | 6.000 | 20,00 | 496 | 83,33 | ||||
| 2025-07-09 | 13F | Triumph Capital Management | 0 | -100,00 | 0 | |||||
| 2025-08-07 | 13F | Profund Advisors Llc | 8.667 | 24,40 | 716 | 90,16 | ||||
| 2025-08-27 | NP | GBVCX - Victory Pioneer Global Value Fund Class C | 1.330 | 0,00 | 110 | 53,52 | ||||
| 2025-08-13 | 13F | Cerity Partners LLC | 42.346 | -9,17 | 3.497 | 38,66 | ||||
| 2025-08-07 | 13F | BOK Financial Private Wealth, Inc. | 0 | -100,00 | 0 | |||||
| 2025-08-26 | NP | MASTER INVESTMENT PORTFOLIO - Active Stock Master Portfolio Active Stock Portfolio | 690 | -76,92 | 57 | -65,22 | ||||
| 2025-08-14 | 13F | Lazard Asset Management Llc | 1.554.154 | 1,73 | 128 | 56,10 | ||||
| 2025-08-01 | 13F | Bessemer Group Inc | 2.515 | 0,00 | 0 | |||||
| 2025-08-13 | 13F | Marshall Wace, Llp | 168.857 | -40,13 | 13.946 | -8,61 | ||||
| 2025-08-19 | 13F | Asset Dedication, LLC | 20 | 0,00 | 2 | 0,00 | ||||
| 2025-08-07 | 13F | Teachers Retirement System Of The State Of Kentucky | 320.500 | -14,58 | 26 | 30,00 | ||||
| 2025-08-13 | 13F | M&t Bank Corp | 4.418 | 2,74 | 365 | 56,90 | ||||
| 2025-08-12 | 13F | MAI Capital Management | 2.828 | 234 | ||||||
| 2025-08-12 | 13F | Global Retirement Partners, LLC | 8.245 | 23.457,14 | 681 | 67.900,00 | ||||
| 2025-08-13 | 13F | Townsquare Capital Llc | 0 | -100,00 | 0 | |||||
| 2025-05-15 | 13F | Ancora Advisors, LLC | 0 | -100,00 | 0 | -100,00 | ||||
| 2025-08-13 | 13F | Capital World Investors | 26.060 | -9,56 | 2.124 | 38,19 | ||||
| 2025-08-14 | 13F | Principal Street Partners, LLC | 2.598 | 215 | ||||||
| 2025-08-12 | 13F | Pathstone Holdings, LLC | 26.373 | 9,22 | 2.178 | 66,77 | ||||
| 2025-07-22 | 13F | LGT Group Foundation | 14.657 | 165,77 | 1.211 | 306,04 | ||||
| 2025-08-13 | 13F | Capital Group Private Client Services, Inc. | 81.721 | -0,74 | 6.749 | 51,49 | ||||
| 2025-07-22 | 13F | Knights of Columbus Asset Advisors LLC | 8.071 | 0,00 | 667 | 52,75 | ||||
| 2025-07-17 | 13F | V-Square Quantitative Management LLC | 0 | -100,00 | 0 | |||||
| 2025-08-14 | 13F | Vident Advisory, LLC | 50.090 | -20,71 | 4.137 | 21,01 | ||||
| 2025-08-08 | 13F | Creative Planning | 104.163 | 34,74 | 8.603 | 105,64 | ||||
| 2025-08-14 | 13F | Wiley Bros.-aintree Capital, Llc | 6.640 | 5,87 | 548 | 64,07 | ||||
| 2025-08-11 | 13F | HighTower Advisors, LLC | 4.576 | -7,96 | 378 | 40,15 | ||||
| 2025-07-09 | 13F | Gilman Hill Asset Management, LLC | 69.313 | 0,02 | 5.725 | 52,68 | ||||
| 2025-07-30 | 13F | Ethic Inc. | 57.016 | -6,33 | 4.647 | 39,76 | ||||
| 2025-08-12 | 13F | Gitterman Wealth Management, LLC | 3.200 | 264 | ||||||
| 2025-08-13 | 13F | Natixis Advisors, L.p. | 34.461 | -4,51 | 3 | 100,00 | ||||
| 2025-08-14 | 13F | Royal London Asset Management Ltd | 12.488 | 0,87 | 1.031 | 54,11 | ||||
| 2025-08-14 | 13F | Qube Research & Technologies Ltd | 0 | -100,00 | 0 | |||||
| 2025-06-25 | NP | WRAAX - Wilmington Global Alpha Equities Fund Class A Shares | 2.787 | 9,68 | 176 | 10,76 | ||||
| 2025-07-17 | 13F | Greenleaf Trust | 14.613 | 0,29 | 1.207 | 53,05 | ||||
| 2025-08-14 | 13F | Promethos Capital, LLC | 115.335 | 0,96 | 9.525 | 54,10 | ||||
| 2025-08-14 | 13F | Ubs Asset Management Americas Inc | 15.980 | -83,47 | 1.320 | -74,78 | ||||
| 2025-08-14 | 13F | Altrinsic Global Advisors Llc | 54.811 | -0,24 | 4.527 | 52,24 | ||||
| 2025-07-28 | NP | AVSE - Avantis Responsible Emerging Markets Equity ETF | 7.004 | 13,24 | 524 | 56,12 | ||||
| 2025-05-15 | 13F | CAPROCK Group, Inc. | 17.894 | 0,23 | 978 | -3,65 | ||||
| 2025-08-27 | NP | RYWTX - Emerging Markets 2x Strategy Fund Class A | 1.969 | 161,14 | 163 | 305,00 | ||||
| 2025-07-28 | 13F | Harbour Investments, Inc. | 241 | 0,00 | 20 | 46,15 | ||||
| 2025-07-28 | 13F | BRYN MAWR TRUST Co | 50 | -91,13 | 4 | -86,67 | ||||
| 2025-08-14 | 13F | Sei Investments Co | 14.268 | 3,62 | 1.178 | 58,12 | ||||
| 2025-07-30 | 13F | Bleakley Financial Group, LLC | 10.340 | -7,26 | 854 | 41,46 | ||||
| 2025-08-06 | 13F | Savant Capital, LLC | 4.150 | 343 | ||||||
| 2025-08-13 | 13F | Victory Capital Management Inc | 68.740 | 340,08 | 5.755 | 581,07 | ||||
| 2025-08-12 | 13F | Wayfinding Financial, LLC | 0 | -100,00 | 0 | |||||
| 2025-09-04 | 13F/A | Advisor Group Holdings, Inc. | 6.889 | 19,13 | 569 | 82,05 | ||||
| 2025-08-14 | 13F | Voloridge Investment Management, Llc | 23.860 | -66,47 | 1.971 | -48,83 | ||||
| 2025-08-14 | 13F | Colony Group, LLC | 8.991 | 743 | ||||||
| 2025-06-26 | NP | DFAX - Dimensional World ex U.S. Core Equity 2 ETF | 10.567 | 0,00 | 666 | 0,76 | ||||
| 2025-08-29 | NP | MPLAX - Praxis International Index Fund Class A | 19.354 | 113,24 | 1.598 | 225,46 | ||||
| 2025-08-11 | 13F | Pinnacle Wealth Planning Services, Inc. | 3.477 | -16,50 | 287 | 27,56 | ||||
| 2025-07-15 | 13F | Mather Group, Llc. | 0 | -100,00 | 0 | |||||
| 2025-08-01 | 13F | Oversea-Chinese Banking CORP Ltd | 3.547 | -8,91 | 293 | 39,05 | ||||
| 2025-07-09 | 13F | Aaron Wealth Advisors LLC | 5.676 | 9,98 | 469 | 67,74 | ||||
| 2025-08-14 | 13F | Silvercrest Asset Management Group Llc | 161.146 | 0,00 | 13.309 | 52,64 | ||||
| 2025-08-08 | 13F | Wealth Alliance | 2.599 | 215 | ||||||
| 2025-08-13 | 13F | EverSource Wealth Advisors, LLC | 6.692 | 11,38 | 553 | 69,85 | ||||
| 2025-08-13 | 13F | Arrowstreet Capital, Limited Partnership | 963.244 | -0,47 | 79.554 | 51,91 | ||||
| 2025-06-26 | NP | EMQAX - Ashmore Emerging Markets Active Equity Fund CLASS A | 0 | -100,00 | 0 | -100,00 | ||||
| 2025-05-05 | 13F | Transce3nd, LLC | 0 | -100,00 | 0 | |||||
| 2025-08-08 | 13F | Itau Unibanco Holding S.A. | 15.158 | -1,33 | 1.252 | |||||
| 2025-05-05 | 13F | Eagle Bay Advisors LLC | 0 | -100,00 | 0 | -100,00 | ||||
| 2025-07-25 | 13F | Cwm, Llc | 2.267 | -7,88 | 0 | |||||
| 2025-08-14 | 13F | Jane Street Group, Llc | 0 | -100,00 | 0 | |||||
| 2025-07-23 | 13F | Vontobel Holding Ltd. | 2.560 | 211 | ||||||
| 2025-06-26 | NP | DFEV - Dimensional Emerging Markets Value ETF | 3.434 | -39,76 | 216 | -39,33 | ||||
| 2025-07-25 | NP | DWGAX - AMERICAN FUNDS DEVELOPING WORLD GROWTH & INCOME FUND Class A This fund is a listed as child fund of Capital World Investors and if that institution has disclosed ownership in this security, then these positions will not be double counted when calculating total shares and total value | 81.239 | 0,00 | 6.073 | 37,62 | ||||
| 2025-08-14 | 13F | Systematic Alpha Investments, LLC | 3.600 | 297 | ||||||
| 2025-07-24 | 13F | PDS Planning, Inc | 8.373 | 4,35 | 692 | 59,22 | ||||
| 2025-08-12 | 13F | American Century Companies Inc | 751.168 | 18,32 | 62.039 | 80,59 | ||||
| 2025-08-14 | 13F/A | Skopos Labs, Inc. | 2.108 | 573,48 | 174 | 987,50 | ||||
| 2025-04-21 | 13F | Nelson, Van Denburg & Campbell Wealth Management Group, LLC | 0 | -100,00 | 0 | |||||
| 2025-06-26 | NP | BLACKROCK FUNDS - BlackRock Advantage ESG Emerging Markets Equity Fund Institutional This fund is a listed as child fund of BlackRock, Inc. and if that institution has disclosed ownership in this security, then these positions will not be double counted when calculating total shares and total value | 265 | -59,23 | 17 | -60,00 | ||||
| 2025-07-21 | 13F | Credential Qtrade Securities Inc. | 0 | -100,00 | 0 | -100,00 | ||||
| 2025-08-14 | 13F | Wells Fargo & Company/mn | 105.244 | 15,99 | 8.692 | 77,06 | ||||
| 2025-08-14 | 13F | Barometer Capital Management Inc. | 3.043 | 0,00 | 251 | 53,05 | ||||
| 2025-08-27 | 13F/A | Brinker Capital Investments, LLC | 17.686 | 69,00 | 1.461 | 157,95 | ||||
| 2025-07-07 | 13F | Northwest & Ethical Investments L.P. | 0 | -100,00 | 0 | -100,00 | ||||
| 2025-08-08 | 13F | Cetera Investment Advisers | 8.584 | 66,39 | 709 | 153,76 | ||||
| 2025-07-29 | 13F | Private Trust Co Na | 19 | 2 | ||||||
| 2025-04-17 | 13F | Optas, LLC | 0 | -100,00 | 0 | |||||
| 2025-04-17 | 13F | Vista Wealth Management Group, LLC | 4.656 | -15,94 | 252 | -20,32 | ||||
| 2025-08-01 | 13F | Solstein Capital, LLC | 14.987 | 0,00 | 1.238 | 52,72 | ||||
| 2025-08-14 | 13F | UBS Group AG | 87.082 | -33,55 | 7.192 | 1,42 | ||||
| 2025-08-14 | 13F | Smartleaf Asset Management LLC | 146 | -18,44 | 12 | 22,22 | ||||
| 2025-08-11 | 13F | Citigroup Inc | 66.180 | 6,81 | 5.466 | 63,04 | ||||
| 2025-08-08 | 13F | SBI Securities Co., Ltd. | 6 | 500,00 | 0 | |||||
| 2025-08-08 | 13F | Pnc Financial Services Group, Inc. | 13.515 | 15,51 | 1.116 | 76,30 | ||||
| 2025-08-28 | NP | QEMM - SPDR MSCI Emerging Markets StrategicFactors ETF | 1.270 | -3,93 | 105 | 46,48 | ||||
| 2025-07-24 | 13F | IFP Advisors, Inc | 86 | 62,26 | 7 | 250,00 | ||||
| 2025-08-13 | 13F | Hsbc Holdings Plc | 442.300 | 141,53 | 21.338 | 79,21 | ||||
| 2025-08-12 | 13F | Proequities, Inc. | Put | 0 | 0 | |||||
| 2025-08-13 | 13F | Hsbc Holdings Plc | Call | 30.000 | 0,00 | 2.478 | 52,62 | |||
| 2025-08-13 | 13F | Northwestern Mutual Wealth Management Co | 878 | 10.875,00 | 73 | |||||
| 2025-08-14 | 13F | Fmr Llc | 23.089 | 40,32 | 1.907 | 114,16 | ||||
| 2025-08-12 | 13F | Proequities, Inc. | Call | 0 | 0 | |||||
| 2025-08-25 | 13F/A | Neuberger Berman Group LLC | 2.929 | 242 | ||||||
| 2025-08-12 | 13F | Proequities, Inc. | 0 | 0 | ||||||
| 2025-08-28 | NP | JINTX - Johnson International Fund | 2.400 | 0,00 | 198 | 53,49 | ||||
| 2025-07-11 | 13F | Farther Finance Advisors, LLC | 2.134 | 215,21 | 176 | 388,89 | ||||
| 2025-08-07 | 13F | Midwest Trust Co | 3.549 | 293 | ||||||
| 2025-07-01 | 13F | Confluence Investment Management Llc | 4.732 | -6,45 | 391 | 42,86 | ||||
| 2025-07-10 | 13F | Wealth Enhancement Advisory Services, Llc | 26.053 | -1,12 | 2.233 | 56,63 | ||||
| 2025-08-07 | 13F | Sierra Ocean, Llc | 425 | -1,62 | 35 | 52,17 | ||||
| 2025-08-15 | 13F | CI Private Wealth, LLC | 15.808 | 3,22 | 1.306 | 57,61 | ||||
| 2025-08-12 | 13F | Advisors Asset Management, Inc. | 14.796 | 5,16 | 1.222 | 60,58 | ||||
| 2025-08-12 | 13F/A | Boston Partners | 86.769 | -28,88 | 7.163 | 8,19 | ||||
| 2025-07-15 | 13F | Ballentine Partners, LLC | 24.447 | 16,02 | 2.019 | 77,11 | ||||
| 2025-05-15 | 13F | Jain Global LLC | 0 | -100,00 | 0 | |||||
| 2025-08-12 | 13F | CIBC Private Wealth Group, LLC | 199 | 105,15 | 16 | 300,00 | ||||
| 2025-07-25 | 13F | Allspring Global Investments Holdings, LLC | 3.645 | 302 | ||||||
| 2025-05-15 | 13F | Integrated Quantitative Investments LLC | 0 | -100,00 | 0 | |||||
| 2025-08-14 | 13F | Bnp Paribas Arbitrage, Sa | 5.547 | -94,85 | 458 | -92,15 |