Statistiche di base
| Proprietari istituzionali | 194 total, 194 long only, 0 short only, 0 long/short - change of 3,17% MRQ |
| Allocazione media del portafoglio | 0.5283 % - change of 2,42% MRQ |
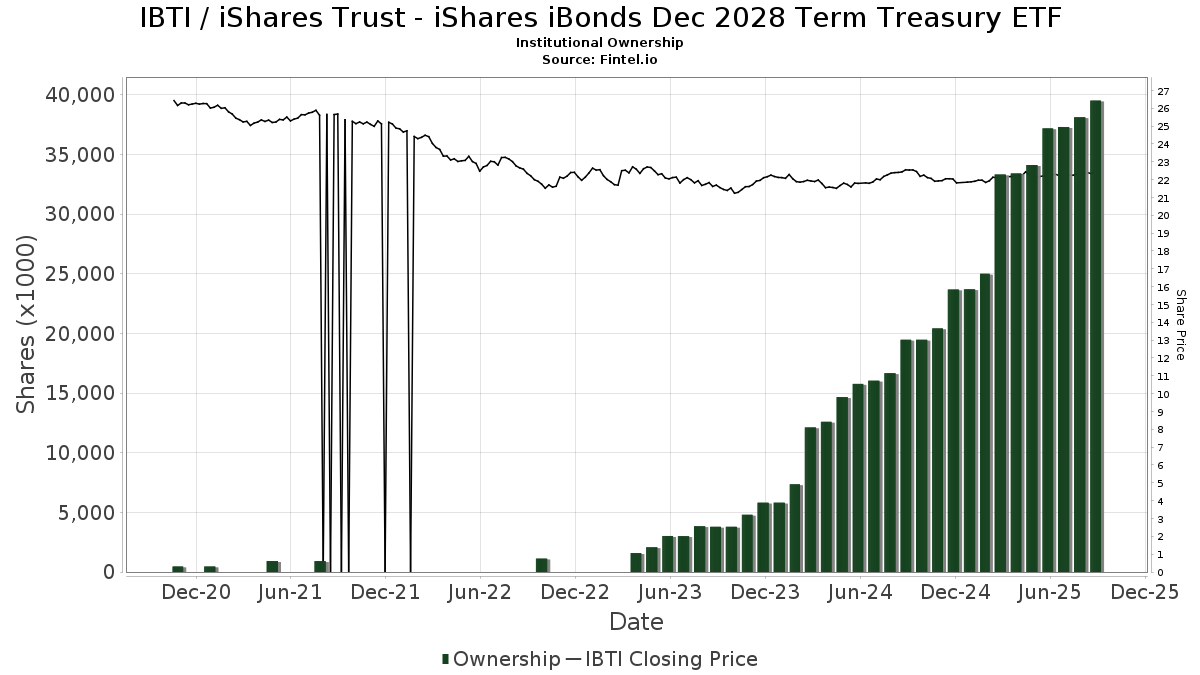
| Azioni istituzionali (Long) | 39.509.126 (ex 13D/G) - change of 2,32MM shares 6,24% MRQ |
| Valore istituzionale (Long) | $ 849.178 USD ($1000) |
Proprietà istituzionale e azionisti
iShares Trust - iShares iBonds Dec 2028 Term Treasury ETF (US:IBTI) ha 194 proprietari istituzionali e azionisti che hanno presentato i moduli 13D/G o 13F alla Securities Exchange Commission (SEC). Queste istituzioni detengono un totale di 39,509,126 azioni. I maggiori azionisti includono Morgan Stanley, Colony Group, LLC, Wells Fargo & Company/mn, Bank Of America Corp /de/, Raymond James Financial Inc, GWM Advisors LLC, Envestnet Asset Management Inc, Stratos Wealth Partners, LTD., Atwood & Palmer Inc, and Horizon Advisory Services, Inc. .
(iShares Trust - iShares iBonds Dec 2028 Term Treasury ETF (NasdaqGM:IBTI) la struttura proprietaria istituzionale mostra le attuali posizioni nella società da parte di istituzioni e fondi, nonché le ultime variazioni nella dimensione della posizione. I principali azionisti possono essere singoli investitori, fondi comuni, hedge fund o istituzioni. L'allegato 13D indica che l'investitore detiene (o ha detenuto) più del 5% della società e intende (o intendeva) perseguire attivamente un cambiamento nella strategia aziendale. L'allegato 13G indica un investimento passivo superiore al 5%.
The share price as of September 5, 2025 is 22,41 / share. Previously, on September 6, 2024, the share price was 22,51 / share. This represents a decline of 0,44% over that period.
Indice del sentiment dei fondi
L'indice del sentiment dei fondi (anche noto come "indice di accumulo di proprietà") individua i titoli più acquistati dai fondi. È il risultato di un sofisticato modello quantitativo multi-fattore che identifica le società con i più alti livelli di accumulo istituzionale. Il modello utilizza una combinazione dell'aumento totale dei proprietari dichiarati, delle variazioni nelle allocazioni di portafoglio di tali proprietari e di altre metriche. Il punteggio varia da 0 a 100: i numeri più alti indicano un livello di accumulo superiore ad altre società, mentre 50 rappresenta la media.
Frequenza di aggiornamento: giornaliera
Consulta Ownership Explorer per visualizzare l'elenco delle aziende con il ranking più alto.
Rapporto put/call istituzionale
Oltre a segnalare le emissioni standard di titoli azionari e di debito, gli istituti con più di 100 milioni di asset in gestione devono anche dichiarare le loro partecipazioni in opzioni put e call. Poiché le opzioni put indicano generalmente un sentiment negativo e le opzioni call un sentiment positivo, possiamo avere un'idea del sentiment istituzionale complessivo attraverso il rapporto tra put e call. Il grafico a destra mostra il rapporto storico put/call per questo strumento.
L'utilizzo del rapporto put/call come indicatore del sentiment degli investitori consente di superare una delle principali lacune dell'utilizzo della proprietà istituzionale totale, ovvero il fatto che una quantità significativa di asset in gestione viene investita passivamente per seguire gli indici. Generalmente, i fondi a gestione passiva non acquistano opzioni, per cui il rapporto put/call riflette più fedelmente il sentiment dei fondi a gestione attiva.
Depositi 13F e NPORT
Le informazioni relative ai depositi 13F sono gratuite. Per accedere alle informazioni relative ai depositi NP è necessario un'abbonamento premium. Le righe verdi indicano le nuove posizioni. Le righe rosse indicano le posizioni chiuse. Fai clic sull'icona del link per visualizzare la cronologia completa delle transazioni.
Esegui l'upgrade
per sbloccare i dati premium ed esportarli in Excel ![]() .
.
| Data di deposito | Fonte | Investitore | Tipo | Prezzo medio (Stima) |
Azioni | Δ Azioni (%) |
Valore dichiarato ($ 1000) |
Δ Valore (%) |
Allocazione del portafoglio (%) |
|
|---|---|---|---|---|---|---|---|---|---|---|
| 2025-08-14 | 13F | Mml Investors Services, Llc | 54.525 | 290,83 | 1 | |||||
| 2025-07-11 | 13F | Compass Ion Advisors, LLC | 37.064 | 30,18 | 829 | 30,81 | ||||
| 2025-07-17 | 13F | Robbins Farley Llc | 1.746 | -4,28 | 39 | -2,50 | ||||
| 2025-08-12 | 13F | Reliant Wealth Planning | 90.992 | 13,40 | 2.035 | 13,95 | ||||
| 2025-08-06 | 13F | Commonwealth Equity Services, Llc | 597.469 | 1,30 | 13 | 0,00 | ||||
| 2025-07-29 | 13F | Stratos Wealth Partners, LTD. | 920.066 | -7,71 | 20.573 | -7,26 | ||||
| 2025-08-14 | 13F | Wells Fargo & Company/mn | 2.470.514 | 2,11 | 55.241 | 2,61 | ||||
| 2025-08-11 | 13F | United Capital Financial Advisers, Llc | 486.873 | 72,00 | 10.886 | 72,85 | ||||
| 2025-08-12 | 13F | Fca Corp /tx | 205.412 | 3,61 | 4.593 | 4,13 | ||||
| 2025-07-30 | 13F | Strategic Blueprint, LLC | 123.858 | 119,97 | 2.769 | 121,17 | ||||
| 2025-08-07 | 13F | Hughes Financial Services, LLC | 94.995 | 3,92 | 2.120 | 4,44 | ||||
| 2025-07-09 | 13F | Lbmc Investment Advisors, Llc | 16.480 | 56,19 | 368 | 57,26 | ||||
| 2025-08-04 | 13F | 4J Wealth Management LLC | 9.561 | 0,29 | 214 | 0,47 | ||||
| 2025-07-18 | 13F | Truist Financial Corp | 99.653 | -3,63 | 2.228 | -3,13 | ||||
| 2025-05-07 | 13F | Spectrum Wealth Counsel, LLC | 5.195 | 0,00 | 116 | 1,77 | ||||
| 2025-07-08 | 13F | Parallel Advisors, LLC | 122.891 | 12,31 | 2.748 | 12,86 | ||||
| 2025-07-30 | 13F/A | KPP Advisory Services LLC | 13.800 | 0,00 | 309 | 0,33 | ||||
| 2025-04-29 | 13F | Hm Payson & Co | 2.259 | 0,00 | 50 | 2,04 | ||||
| 2025-08-11 | 13F | Principal Securities, Inc. | 18.914 | 41,01 | 423 | 44,03 | ||||
| 2025-08-15 | 13F | Captrust Financial Advisors | 51.720 | 0,66 | 1.156 | 1,14 | ||||
| 2025-08-15 | 13F | Howland Capital Management Llc | 124.988 | 9,00 | 2.795 | 9,53 | ||||
| 2025-08-13 | 13F | SCS Capital Management LLC | 104.079 | 0,19 | 2.327 | 0,69 | ||||
| 2025-07-15 | 13F | BCS Wealth Management | 0 | -100,00 | 0 | |||||
| 2025-07-17 | 13F | Stockman Wealth Management, Inc. | 174.695 | 6,38 | 3.906 | 6,93 | ||||
| 2025-07-30 | 13F | D.a. Davidson & Co. | 260.580 | 2,93 | 5.827 | 3,43 | ||||
| 2025-08-14 | 13F | Jane Street Group, Llc | 40.461 | -62,66 | 905 | -62,51 | ||||
| 2025-08-01 | 13F | Bank of Jackson Hole Trust | 3.314 | 0,00 | 74 | 1,37 | ||||
| 2025-05-05 | 13F | Montag A & Associates Inc | 0 | -100,00 | 0 | |||||
| 2025-08-12 | 13F | AlphaCore Capital LLC | 49 | 0,00 | 1 | 0,00 | ||||
| 2025-08-14 | 13F | GWM Advisors LLC | 1.266.678 | -15,31 | 28.323 | -14,90 | ||||
| 2025-07-14 | 13F | UMA Financial Services, Inc. | 10.396 | 0,33 | 232 | 0,87 | ||||
| 2025-08-14 | 13F | Essential Planning, LLC. | 12.421 | 0,62 | 278 | 1,09 | ||||
| 2025-08-14 | 13F | Susquehanna International Group, Llp | 0 | -100,00 | 0 | |||||
| 2025-08-01 | 13F | Liberty Wealth Management Llc | 12.358 | 276 | ||||||
| 2025-08-12 | 13F | Tableaux Llc | 0 | -100,00 | 0 | |||||
| 2025-04-11 | 13F | Safeguard Financial, LLC | 9.910 | 0,18 | 220 | 1,85 | ||||
| 2025-07-23 | 13F | Valmark Advisers, Inc. | 88.970 | 15,22 | 1.989 | 15,77 | ||||
| 2025-07-07 | 13F | Trust Co | 472.918 | -3,55 | 10.574 | -3,08 | ||||
| 2025-08-14 | 13F | Hara Capital LLC | 4.925 | -31,12 | 110 | -30,82 | ||||
| 2025-07-30 | 13F | Bogart Wealth, LLC | 3.358 | 0,09 | 75 | 1,35 | ||||
| 2025-05-15 | 13F | Wealth Management Strategies, Inc. | 353.920 | 11,41 | 7.875 | 11.311,59 | ||||
| 2025-08-08 | 13F | Woodley Farra Manion Portfolio Management Inc | 10.205 | 228 | ||||||
| 2025-04-22 | 13F | Mendota Financial Group, LLC | 0 | -100,00 | 0 | |||||
| 2025-08-13 | 13F | Hamel Associates, Inc. | 10.590 | 237 | ||||||
| 2025-08-14 | 13F | UBS Group AG | 802.629 | 2,31 | 17.947 | 2,81 | ||||
| 2025-08-04 | 13F | Grant Street Asset Management, Inc. | 23.562 | 1,00 | 527 | 1,35 | ||||
| 2025-08-11 | 13F | Summit Wealth Partners, LLC | 14.275 | 46,10 | 319 | 47,00 | ||||
| 2025-08-12 | 13F | BlackRock, Inc. | 189.726 | 13,83 | 4.242 | 14,40 | ||||
| 2025-07-30 | 13F | Granite Harbor Advisors, Inc. | 38.294 | 1,99 | 856 | 2,51 | ||||
| 2025-08-14 | 13F | Black Maple Capital Management LP | 10.000 | 224 | ||||||
| 2025-08-07 | 13F | Allworth Financial LP | 145.592 | 48,75 | 3.255 | 49,24 | ||||
| 2025-08-13 | 13F | RFP Financial Group LLC | 29.674 | 11,12 | 664 | 11,62 | ||||
| 2025-07-11 | 13F | Financial Advisory Corp | 767.440 | 3,48 | 17.160 | 3,98 | ||||
| 2025-08-14 | 13F | Goldman Sachs Group Inc | 268.521 | 69,55 | 6.004 | 70,42 | ||||
| 2025-08-14 | 13F | Colony Group, LLC | 2.671.393 | 8,41 | 59.732 | 8,94 | ||||
| 2025-07-31 | 13F | Keeler THomas Management LLC | 58.987 | 43,31 | 1.319 | 44,04 | ||||
| 2025-08-01 | 13F | Envestnet Asset Management Inc | 983.561 | 42,14 | 21.992 | 42,85 | ||||
| 2025-08-14 | 13F | Raymond James Financial Inc | 1.359.691 | 12,41 | 30.403 | 12,96 | ||||
| 2025-08-13 | 13F | Northwestern Mutual Wealth Management Co | 184.355 | 17,07 | 4.122 | 17,67 | ||||
| 2025-07-14 | 13F | Wealth Advisory Solutions, LLC | 20.716 | 3,13 | 463 | 3,81 | ||||
| 2025-06-23 | NP | LDRT - iShares iBonds 1-5 Year Treasury Ladder ETF | 177.372 | 200,00 | 3.980 | 206,15 | ||||
| 2025-08-13 | 13F | Capital Analysts, Inc. | 2.080 | 0,00 | 0 | |||||
| 2025-08-14 | 13F | Integrated Wealth Concepts LLC | 340.157 | 50,73 | 7.606 | 51,46 | ||||
| 2025-08-18 | 13F/A | Kestra Investment Management, LLC | 17.399 | -44,02 | 389 | -43,70 | ||||
| 2025-07-18 | 13F | Foundry Financial Group, Inc. | 62.039 | -9,73 | 1.387 | -9,29 | ||||
| 2025-07-24 | 13F | Leo Wealth, LLC | 104.929 | -1,62 | 2.346 | -1,14 | ||||
| 2025-08-12 | 13F | Titleist Asset Management, Llc | 292.439 | 14,51 | 6.539 | 15,07 | ||||
| 2025-08-12 | 13F | MAI Capital Management | 18.544 | 1,00 | 415 | 1,47 | ||||
| 2025-08-05 | 13F | C2P Capital Advisory Group, LLC d.b.a. Prosperity Capital Advisors | 0 | -100,00 | 0 | |||||
| 2025-07-22 | 13F | Yoder Wealth Management, Inc. | 10.970 | 0,00 | 245 | 0,41 | ||||
| 2025-08-11 | 13F | Wealthspire Advisors, LLC | 12.315 | 275 | ||||||
| 2025-08-05 | 13F | Hills Bank & Trust Co | 4.529 | 101 | ||||||
| 2025-08-11 | 13F | Pineridge Advisors LLC | 264.183 | -6,30 | 5.907 | -5,83 | ||||
| 2025-09-04 | 13F/A | Advisor Group Holdings, Inc. | 274.200 | 8,69 | 6.135 | 9,22 | ||||
| 2025-08-05 | 13F | Fullcircle Wealth Llc | 28.942 | 0,00 | 646 | -0,31 | ||||
| 2025-08-14 | 13F | Stifel Financial Corp | 153.765 | 7,95 | 3.438 | 8,49 | ||||
| 2025-08-13 | 13F | Cerity Partners LLC | 21.057 | -0,44 | 471 | 0,00 | ||||
| 2025-08-13 | 13F | Boston Family Office Llc | 180.163 | 35,98 | 4 | 100,00 | ||||
| 2025-07-07 | 13F | Horizons Wealth Management | 1.549 | 46,96 | 35 | 47,83 | ||||
| 2025-08-12 | 13F | Steward Partners Investment Advisory, Llc | 435.921 | 44,39 | 9.747 | 45,11 | ||||
| 2025-07-30 | 13F/A | Old Point Trust & Financial Services N A | 2.100 | 0,00 | 47 | 0,00 | ||||
| 2025-07-23 | 13F | Prime Capital Investment Advisors, LLC | 11.105 | 248 | ||||||
| 2025-07-25 | 13F | Cwm, Llc | 43.588 | 12,15 | 1 | |||||
| 2025-08-19 | 13F | Asset Dedication, LLC | 12.142 | 31,04 | 271 | 31,55 | ||||
| 2025-07-16 | 13F | MKT Advisors LLC | 517.987 | 3,72 | 11.525 | 3,62 | ||||
| 2025-08-12 | 13F | LPL Financial LLC | 544.355 | 7,74 | 12.172 | 8,27 | ||||
| 2025-05-07 | 13F | Mb, Levis & Associates, Llc | 0 | -100,00 | 0 | -100,00 | ||||
| 2025-07-25 | 13F | Heartland Bank & Trust Co | 17.835 | 0,00 | 399 | 0,51 | ||||
| 2025-07-08 | 13F | Atwood & Palmer Inc | 907.555 | -19,96 | 20.293 | -19,56 | ||||
| 2025-07-11 | 13F | Prosperity Planning, Inc. | 353 | 4,14 | ||||||
| 2025-08-13 | 13F | Baird Financial Group, Inc. | 124.018 | 86,80 | 2.773 | 87,75 | ||||
| 2025-07-22 | 13F | Merit Financial Group, LLC | 10.922 | 244 | ||||||
| 2025-08-08 | 13F | Creative Planning | 20.936 | 0,00 | 468 | 0,65 | ||||
| 2025-07-25 | 13F | Hemington Wealth Management | 36 | 0,00 | 0 | |||||
| 2025-08-11 | 13F | HighTower Advisors, LLC | 15.850 | 20,59 | 354 | 21,23 | ||||
| 2025-08-14 | 13F | Hrt Financial Lp | 0 | -100,00 | 0 | |||||
| 2025-08-26 | 13F/A | Thrivent Financial For Lutherans | 0 | -100,00 | 0 | |||||
| 2025-08-01 | 13F | Koss-Olinger Consulting, LLC | 22.903 | 0,32 | 512 | 0,79 | ||||
| 2025-08-18 | 13F/A | National Bank Of Canada /fi/ | 12.268 | 5,40 | 274 | 6,20 | ||||
| 2025-07-23 | 13F | Horizon Advisory Services, Inc. | 841.186 | 1,84 | 18.809 | 2,34 | ||||
| 2025-07-24 | 13F | Us Bancorp \de\ | 3.050 | 0,00 | 68 | 1,49 | ||||
| 2025-08-05 | 13F | Bank Of Montreal /can/ | 3.294 | 59,67 | 74 | 62,22 | ||||
| 2025-07-23 | 13F | Element Wealth, LLC | 14.720 | 33,88 | 329 | 34,84 | ||||
| 2025-07-17 | 13F | Janney Montgomery Scott LLC | 187.490 | 27,56 | 4 | 33,33 | ||||
| 2025-04-17 | 13F | Montecito Bank & Trust | 38.664 | 180,30 | 860 | 184,77 | ||||
| 2025-08-14 | 13F | Fmr Llc | 1.105 | 100,54 | 25 | 100,00 | ||||
| 2025-07-24 | 13F | Eastern Bank | 950 | 0,00 | 21 | 0,00 | ||||
| 2025-07-31 | 13F | Cambridge Investment Research Advisors, Inc. | 41.558 | 8,29 | 1 | |||||
| 2025-08-08 | 13F | Thoroughbred Financial Services, Llc | 132.000 | -13,79 | 3 | -33,33 | ||||
| 2025-08-14 | 13F | Mercer Global Advisors Inc /adv | 677.243 | 28,24 | 15.143 | 28,88 | ||||
| 2025-08-12 | 13F | Jacobi Capital Management LLC | 17.107 | 6,51 | 383 | 7,00 | ||||
| 2025-08-01 | 13F | Logan Capital Management Inc | 289 | 0,00 | 6 | 0,00 | ||||
| 2025-07-11 | 13F | Farther Finance Advisors, LLC | 0 | -100,00 | 0 | |||||
| 2025-07-24 | 13F | Blair William & Co/il | 2.286 | -8,41 | 51 | -7,27 | ||||
| 2025-08-14 | 13F | Financial Engines Advisors L.L.C. | 204.350 | -22,84 | 4.569 | -22,45 | ||||
| 2025-08-14 | 13F | Citadel Advisors Llc | 40.866 | -67,43 | 914 | -67,29 | ||||
| 2025-07-30 | 13F | Journey Advisory Group, LLC | 791.883 | 1,73 | 17.706 | 2,23 | ||||
| 2025-08-12 | 13F | Laurel Wealth Advisors LLC | 32.422 | 2.136,00 | 1 | -96,87 | ||||
| 2025-08-04 | 13F | Jim Saulnier & Associates, Llc | 83.044 | 14,31 | 1.857 | 14,85 | ||||
| 2025-08-04 | 13F | Atria Investments Llc | 99.009 | 0,22 | 2.214 | 0,68 | ||||
| 2025-08-06 | 13F | Modera Wealth Management, LLC | 12.298 | 275 | ||||||
| 2025-05-12 | 13F | Benjamin Edwards Inc | 0 | -100,00 | 0 | |||||
| 2025-07-24 | 13F | Moseley Investment Management Inc | 515.238 | 18,29 | 11.521 | 18,87 | ||||
| 2025-08-14 | 13F | Eight 31 Financial Llc | 346.647 | -5,62 | 7.751 | -5,15 | ||||
| 2025-07-15 | 13F | Highland Financial Advisors, LLC | 11.430 | 0,00 | 256 | 0,39 | ||||
| 2025-07-21 | 13F | Old Second National Bank Of Aurora | 1.825 | 0,00 | 41 | 0,00 | ||||
| 2025-07-11 | 13F | Pinnacle Bancorp, Inc. | 15.492 | 0,00 | 346 | 0,58 | ||||
| 2025-08-12 | 13F | Jpmorgan Chase & Co | 0 | -100,00 | 0 | |||||
| 2025-08-14 | 13F | Snowden Capital Advisors LLC | 362.669 | -0,01 | 8.109 | 0,48 | ||||
| 2025-07-08 | 13F | Apella Capital, LLC | 90.433 | 26,81 | 2.007 | 26,94 | ||||
| 2025-08-08 | 13F | Cetera Investment Advisers | 116.601 | -0,60 | 2.607 | -0,11 | ||||
| 2025-08-12 | 13F | Associated Banc-corp | 74.568 | 25,77 | 1.667 | 26,38 | ||||
| 2025-08-14 | 13F | Mariner, LLC | 40.000 | 894 | ||||||
| 2025-07-08 | 13F | Lowe Wealth Advisors, LLC | 4.218 | -21,09 | 94 | -20,34 | ||||
| 2025-04-01 | 13F | Cornerstone Planning, LLC | 120.926 | 2.649 | ||||||
| 2025-07-14 | 13F | Park Avenue Securities Llc | 230.265 | 1,56 | 5 | 0,00 | ||||
| 2025-07-17 | 13F/A | Capital Investment Advisors, LLC | 52.356 | 19,91 | 1.171 | 20,49 | ||||
| 2025-08-14 | 13F | Vista Private Wealth Partners. LLC | 750.016 | 8,81 | 16.770 | 9,35 | ||||
| 2025-07-22 | 13F | Mascoma Wealth Management LLC | 1.985 | 0,00 | 44 | 0,00 | ||||
| 2025-07-22 | 13F | Berger Financial Group, Inc | 9.601 | 0,00 | 215 | 0,47 | ||||
| 2025-08-14 | 13F | Comerica Bank | 5.197 | -0,29 | 116 | 0,87 | ||||
| 2025-08-07 | 13F | Kestra Private Wealth Services, Llc | 15.820 | 354 | ||||||
| 2025-07-11 | 13F | First PREMIER Bank | 3.050 | -1,33 | 0 | |||||
| 2025-08-04 | 13F | Creative Financial Designs Inc /adv | 189 | 0,00 | 4 | 0,00 | ||||
| 2025-08-14 | 13F | Ameriprise Financial Inc | 217.421 | -5,94 | 4.857 | -5,62 | ||||
| 2025-08-12 | 13F | Proequities, Inc. | 0 | 0 | ||||||
| 2025-07-18 | 13F | Precision Wealth Strategies, LLC | 10.432 | 233 | ||||||
| 2025-08-14 | 13F | Federation des caisses Desjardins du Quebec | 69.763 | 0,85 | 1.560 | 1,30 | ||||
| 2025-07-28 | 13F | Harbour Investments, Inc. | 14.856 | 18,28 | 332 | 19,00 | ||||
| 2025-08-14 | 13F | Connecticut Wealth Management, LLC | 11.862 | 265 | ||||||
| 2025-07-18 | 13F | Northstar Group, Inc. | 244.218 | 28,26 | 5.461 | 28,90 | ||||
| 2025-05-12 | 13F | Kohmann Bosshard Financial Services, LLC | 0 | -100,00 | 0 | |||||
| 2025-05-09 | 13F | TD Waterhouse Canada Inc. | 0 | -100,00 | 0 | |||||
| 2025-08-08 | 13F | WASHINGTON TRUST Co | 0 | -100,00 | 0 | |||||
| 2025-08-13 | 13F | Baltimore-Washington Financial Advisors, Inc. | 633.631 | 5,43 | 14.168 | 5,95 | ||||
| 2025-07-11 | 13F | Trinity Wealth Management, LLC | 15.078 | 0,00 | 337 | 0,60 | ||||
| 2025-08-05 | 13F | Cherry Tree Wealth Management, LLC | 4.563 | 13,45 | 102 | 14,61 | ||||
| 2025-07-08 | 13F | Legacy Private Trust Co. | 488.906 | 2,05 | 10.932 | 2,55 | ||||
| 2025-08-07 | 13F | CENTRAL TRUST Co | 292.634 | 5,64 | 6.543 | 6,17 | ||||
| 2025-08-14 | 13F | STAR Financial Bank | 94.839 | 10,76 | 2.121 | 11,29 | ||||
| 2025-07-24 | 13F | IFP Advisors, Inc | 227.324 | 4,87 | 5.083 | 5,39 | ||||
| 2025-07-31 | 13F | Blake Schutter Theil Wealth Advisors, LLC | 24.191 | 0,00 | 541 | 0,37 | ||||
| 2025-08-14 | 13F | AllSquare Wealth Management LLC | 3.207 | 4,36 | 72 | 4,41 | ||||
| 2025-07-28 | 13F | Duncker Streett & Co Inc | 26.855 | 0,00 | 600 | 0,50 | ||||
| 2025-08-15 | 13F | Equitable Holdings, Inc. | 10.736 | 15,95 | 240 | 16,50 | ||||
| 2025-08-13 | 13F | Cary Street Partners Financial Llc | 41.917 | 3,10 | 937 | 3,65 | ||||
| 2025-08-28 | NP | NDOW - Anydrus Advantage ETF | 131.807 | 2.947 | ||||||
| 2025-05-06 | 13F | Venturi Wealth Management, LLC | 0 | -100,00 | 0 | |||||
| 2025-07-21 | 13F | Barrett & Company, Inc. | 21.503 | 10,47 | 481 | 10,85 | ||||
| 2025-07-22 | 13F | Belpointe Asset Management LLC | 21.610 | 483 | ||||||
| 2025-07-29 | 13F | Straight Path Wealth Management | 22.260 | 6,03 | 498 | 6,42 | ||||
| 2025-07-29 | 13F | Private Trust Co Na | 1.162 | -81,33 | 26 | -81,88 | ||||
| 2025-08-08 | 13F | Gts Securities Llc | 0 | -100,00 | 0 | |||||
| 2025-07-23 | 13F | Evexia Wealth Llc | 22.183 | 15,02 | 493 | 15,46 | ||||
| 2025-08-01 | 13F | Austin Private Wealth, LLC | 40.506 | 12,62 | 906 | 13,13 | ||||
| 2025-08-14 | 13F | Royal Bank Of Canada | 465.046 | -6,41 | 10.399 | -5,94 | ||||
| 2025-04-29 | 13F | Bank of New York Mellon Corp | 0 | -100,00 | 0 | |||||
| 2025-07-22 | 13F | Autumn Glory Partners, LLC | 12.918 | 0,23 | 289 | 0,70 | ||||
| 2025-07-14 | 13F | Kfg Wealth Management, Llc | 9.299 | 3,06 | 208 | 3,50 | ||||
| 2025-08-08 | 13F | Pnc Financial Services Group, Inc. | 63 | 0,00 | 1 | 0,00 | ||||
| 2025-07-16 | 13F | Signaturefd, Llc | 150.110 | 63,69 | 3.356 | 64,51 | ||||
| 2025-08-15 | 13F | Morgan Stanley | 3.279.644 | -4,43 | 73.333 | -3,96 | ||||
| 2025-07-09 | 13F | Krilogy Financial LLC | 127.113 | -4,63 | 2.842 | -4,15 | ||||
| 2025-07-21 | 13F | Crews Bank & Trust | 14.725 | 3,15 | 329 | 3,79 | ||||
| 2025-07-29 | 13F | Carmel Capital Partners, LLC | 250.233 | 1,25 | 5.595 | 1,75 | ||||
| 2025-07-31 | 13F | Leavell Investment Management, Inc. | 87.123 | 37,47 | 1.948 | 38,16 | ||||
| 2025-08-11 | 13F | Midwest Professional Planners, LTD. | 50.617 | 18,64 | 1.132 | 19,18 | ||||
| 2025-08-12 | 13F | CIBC Private Wealth Group, LLC | 449 | 10 | ||||||
| 2025-07-21 | 13F | Cliftonlarsonallen Wealth Advisors, Llc | 205.773 | 16,58 | 4.601 | 17,16 | ||||
| 2025-07-15 | 13F | Retireful, LLC | 131.807 | 2.947 | ||||||
| 2025-08-14 | 13F | Bank Of America Corp /de/ | 2.263.583 | 9,61 | 50.614 | 10,15 | ||||
| 2025-07-16 | 13F | Rebalance, Llc | 151.843 | 162,95 | 3.395 | 164,41 | ||||
| 2025-07-29 | 13F | Accretive Wealth Partners, LLC | 146.699 | 6,90 | 3.280 | 7,36 | ||||
| 2025-08-15 | 13F | Scissortail Wealth Management, LLC | 422.078 | 2,33 | 9.438 | 2,83 | ||||
| 2025-07-01 | 13F | Confluence Investment Management Llc | 436.479 | -0,50 | 9.760 | -0,01 | ||||
| 2025-08-08 | 13F | Mv Capital Management, Inc. | 251.720 | 19,79 | 5.628 | 20,39 | ||||
| 2025-08-15 | 13F | Kestra Advisory Services, LLC | 31.190 | 0,34 | 697 | 0,87 | ||||
| 2025-07-21 | 13F | Asset Advisors Investment Management, LLC | 566.440 | 102,17 | 12.666 | 103,16 | ||||
| 2025-08-01 | 13F | Transcend Wealth Collective, Llc | 123.550 | -43,63 | 2.763 | -43,36 | ||||
| 2025-07-30 | 13F | Probity Advisors, Inc. | 384.268 | 4,74 | 8.592 | 5,27 | ||||
| 2025-08-05 | 13F | Sigma Planning Corp | 55.618 | 4,08 | 1.244 | 4,63 | ||||
| 2025-08-05 | 13F | Strategic Financial Concepts, LLC | 12.525 | 0,00 | 280 | 0,72 | ||||
| 2025-07-24 | 13F | Costello Asset Management, INC | 21 | 5,00 | 0 | |||||
| 2025-08-01 | 13F | Signature Wealth Management Group | 22.943 | -1,39 | 513 | -0,77 | ||||
| 2025-08-12 | 13F | Coldstream Capital Management Inc | 25.451 | 0,00 | 569 | 0,53 | ||||
| 2025-07-21 | 13F | Exchange Capital Management, Inc. | 11.179 | 250 | ||||||
| 2025-08-11 | 13F | Independent Advisor Alliance | 10.552 | -3,40 | 236 | -3,29 | ||||
| 2025-08-12 | 13F | PSI Advisors, LLC | 0 | -100,00 | 0 | |||||
| 2025-08-12 | 13F | Global Retirement Partners, LLC | 61.953 | -55,37 | 1.385 | -54,44 | ||||
| 2025-07-24 | 13F | Stonebridge Financial Group, LLC | 0 | -100,00 | 0 | |||||
| 2025-07-18 | 13F | Consolidated Portfolio Review Corp | 42.875 | 7,01 | 959 | 7,52 | ||||
| 2025-07-31 | 13F | United Community Bank | 11.520 | 0,00 | 258 | 0,39 | ||||
| 2025-07-11 | 13F | Shelton Wealth Management, Llc | 339.810 | 4,26 | 7.598 | 4,79 | ||||
| 2025-08-11 | 13F | CFS Investment Advisory Services, LLC | 17.004 | 0,38 | 0 | |||||
| 2025-07-30 | 13F | DecisionMap Wealth Management, LLC | 11.672 | 29,66 | 261 | 30,00 | ||||
| 2025-08-01 | 13F | Schmidt P J Investment Management Inc | 13.058 | 292 |