Statistiche di base
| Proprietari istituzionali | 269 total, 266 long only, 0 short only, 3 long/short - change of 5,08% MRQ |
| Allocazione media del portafoglio | 0.3223 % - change of -6,11% MRQ |
| Azioni istituzionali (Long) | 52.151.765 (ex 13D/G) - change of 1,12MM shares 2,19% MRQ |
| Valore istituzionale (Long) | $ 1.203.095 USD ($1000) |
Proprietà istituzionale e azionisti
Sixth Street Specialty Lending, Inc. (US:TSLX) ha 269 proprietari istituzionali e azionisti che hanno presentato i moduli 13D/G o 13F alla Securities Exchange Commission (SEC). Queste istituzioni detengono un totale di 52,151,765 azioni. I maggiori azionisti includono Strs Ohio, Sixth Street Partners Management Company, L.P., Progeny 3, Inc., Sound Income Strategies, LLC, Burgundy Asset Management Ltd., Van Eck Associates Corp, BIZD - VanEck Vectors BDC Income ETF, Morgan Stanley, Allen Investment Management LLC, and Ares Management Llc .
(Sixth Street Specialty Lending, Inc. (NYSE:TSLX) la struttura proprietaria istituzionale mostra le attuali posizioni nella società da parte di istituzioni e fondi, nonché le ultime variazioni nella dimensione della posizione. I principali azionisti possono essere singoli investitori, fondi comuni, hedge fund o istituzioni. L'allegato 13D indica che l'investitore detiene (o ha detenuto) più del 5% della società e intende (o intendeva) perseguire attivamente un cambiamento nella strategia aziendale. L'allegato 13G indica un investimento passivo superiore al 5%.
The share price as of September 5, 2025 is 24,58 / share. Previously, on September 6, 2024, the share price was 21,20 / share. This represents an increase of 15,94% over that period.

Indice del sentiment dei fondi
L'indice del sentiment dei fondi (anche noto come "indice di accumulo di proprietà") individua i titoli più acquistati dai fondi. È il risultato di un sofisticato modello quantitativo multi-fattore che identifica le società con i più alti livelli di accumulo istituzionale. Il modello utilizza una combinazione dell'aumento totale dei proprietari dichiarati, delle variazioni nelle allocazioni di portafoglio di tali proprietari e di altre metriche. Il punteggio varia da 0 a 100: i numeri più alti indicano un livello di accumulo superiore ad altre società, mentre 50 rappresenta la media.
Frequenza di aggiornamento: giornaliera
Consulta Ownership Explorer per visualizzare l'elenco delle aziende con il ranking più alto.
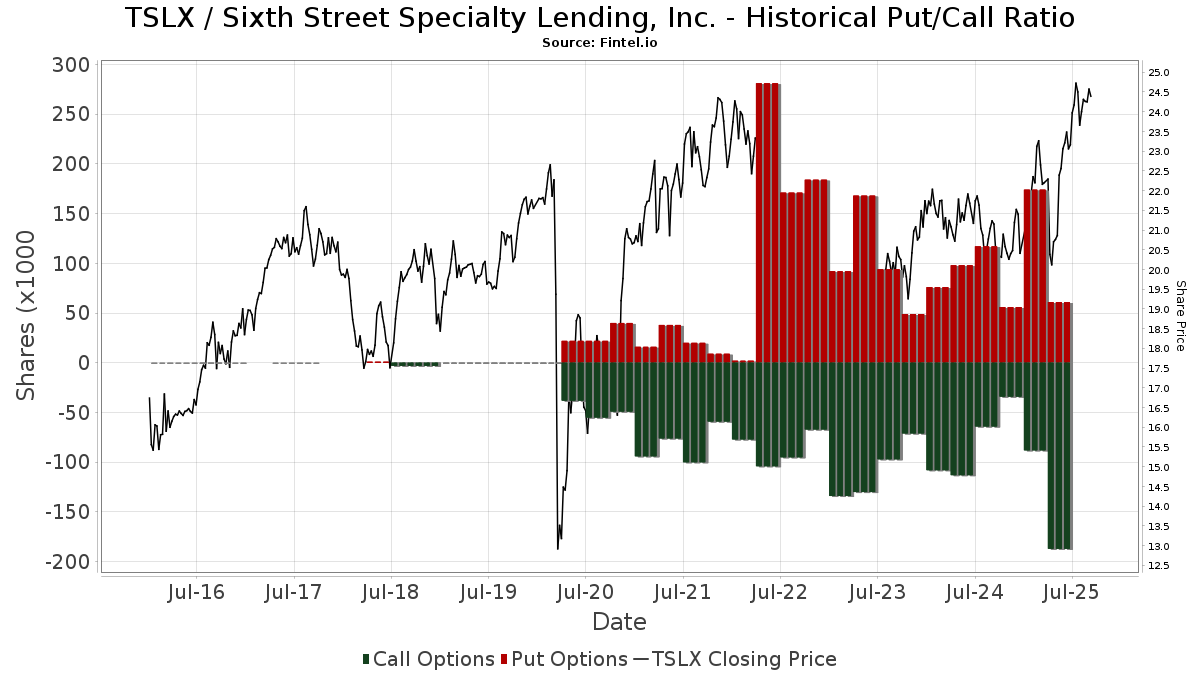
Rapporto put/call istituzionale
Oltre a segnalare le emissioni standard di titoli azionari e di debito, gli istituti con più di 100 milioni di asset in gestione devono anche dichiarare le loro partecipazioni in opzioni put e call. Poiché le opzioni put indicano generalmente un sentiment negativo e le opzioni call un sentiment positivo, possiamo avere un'idea del sentiment istituzionale complessivo attraverso il rapporto tra put e call. Il grafico a destra mostra il rapporto storico put/call per questo strumento.
L'utilizzo del rapporto put/call come indicatore del sentiment degli investitori consente di superare una delle principali lacune dell'utilizzo della proprietà istituzionale totale, ovvero il fatto che una quantità significativa di asset in gestione viene investita passivamente per seguire gli indici. Generalmente, i fondi a gestione passiva non acquistano opzioni, per cui il rapporto put/call riflette più fedelmente il sentiment dei fondi a gestione attiva.
Depositi 13F e NPORT
Le informazioni relative ai depositi 13F sono gratuite. Per accedere alle informazioni relative ai depositi NP è necessario un'abbonamento premium. Le righe verdi indicano le nuove posizioni. Le righe rosse indicano le posizioni chiuse. Fai clic sull'icona del link per visualizzare la cronologia completa delle transazioni.
Esegui l'upgrade
per sbloccare i dati premium ed esportarli in Excel ![]() .
.
| Data di deposito | Fonte | Investitore | Tipo | Prezzo medio (Stima) |
Azioni | Δ Azioni (%) |
Valore dichiarato ($ 1000) |
Δ Valore (%) |
Allocazione del portafoglio (%) |
|
|---|---|---|---|---|---|---|---|---|---|---|
| 2025-08-11 | 13F | EMC Capital Management | 6.120 | -9,29 | 0 | |||||
| 2025-08-01 | 13F | Rossby Financial, LCC | 2.983 | 0,10 | 71 | 14,52 | ||||
| 2025-08-28 | NP | SVOAX - Simt Us Managed Volatility Fund Class F | 38.650 | -38,99 | 920 | -35,07 | ||||
| 2025-05-05 | 13F | Transce3nd, LLC | 0 | -100,00 | 0 | |||||
| 2025-08-04 | 13F | Muzinich & Co., Inc. | 608.616 | 35,21 | 14.491 | 43,85 | ||||
| 2025-08-14 | 13F | Two Sigma Investments, Lp | 512.747 | 17,61 | 12.209 | 25,13 | ||||
| 2025-08-15 | 13F | Northeast Financial Consultants Inc | 26.000 | 0,00 | 619 | 6,54 | ||||
| 2025-08-07 | 13F | ProShare Advisors LLC | 19.159 | -3,69 | 456 | 2,47 | ||||
| 2025-08-14 | 13F | Prelude Capital Management, Llc | 98.843 | 0,00 | 2.353 | 6,37 | ||||
| 2025-08-05 | 13F | Huntington National Bank | 1.001 | 0,00 | 24 | 4,55 | ||||
| 2025-08-13 | 13F | Northern Trust Corp | 84.292 | 52,37 | 2.007 | 62,04 | ||||
| 2025-07-17 | 13F | HB Wealth Management, LLC | 76.206 | -4,27 | 1.814 | 1,85 | ||||
| 2025-08-27 | 13F/A | Squarepoint Ops LLC | 16.052 | 24,86 | 382 | 33,10 | ||||
| 2025-08-08 | 13F | Foundations Investment Advisors, LLC | 42.122 | 1.003 | ||||||
| 2025-08-14 | 13F | UBS Group AG | 1.186.011 | 35,43 | 28.239 | 44,09 | ||||
| 2025-07-16 | 13F | Signaturefd, Llc | 4.659 | -8,70 | 111 | -3,51 | ||||
| 2025-05-01 | 13F | Country Club Bank /gfn | 0 | -100,00 | 0 | |||||
| 2025-05-14 | 13F | Virtus ETF Advisers LLC | 0 | -100,00 | 0 | |||||
| 2025-07-23 | 13F | Hager Investment Management Services, Llc | 55 | 1,85 | 1 | 0,00 | ||||
| 2025-08-06 | 13F | Round Rock Advisors, LLC | 281.184 | 2,44 | 6.695 | 8,99 | ||||
| 2025-08-07 | 13F | Rathbone Brothers plc | 0 | -100,00 | 0 | |||||
| 2025-07-23 | 13F | Ellsworth Advisors, LLC | 29.815 | 710 | ||||||
| 2025-08-15 | 13F | Tower Research Capital LLC (TRC) | 1.770 | -31,37 | 42 | -26,32 | ||||
| 2025-06-18 | NP | Putnam ETF Trust - Putnam BDC ETF - | 479.138 | 21,72 | 9.947 | 12,91 | ||||
| 2025-07-01 | 13F | Confluence Investment Management Llc | 288.066 | 14,58 | 6.859 | 21,90 | ||||
| 2025-07-18 | 13F | Trust Co Of Vermont | 1.584 | -13,63 | 38 | -9,76 | ||||
| 2025-08-13 | 13F | 1832 Asset Management L.P. | 395.347 | 12,96 | 9.413 | 20,17 | ||||
| 2025-08-14 | 13F | Alyeska Investment Group, L.P. | 189.491 | 4.512 | ||||||
| 2025-08-14 | 13F | Mariner, LLC | 38.629 | 13,16 | 920 | 20,45 | ||||
| 2025-08-14 | 13F | FJ Capital Management LLC | 0 | -100,00 | 0 | |||||
| 2025-07-29 | NP | SVYAX - SIIT U.S. Managed Volatility Fund - Class A | 104.200 | 0,00 | 2.427 | -0,94 | ||||
| 2025-08-07 | 13F | Allworth Financial LP | 334 | 1.570,00 | 8 | |||||
| 2025-08-14 | 13F | GWM Advisors LLC | 1.672 | 0,00 | 40 | 5,41 | ||||
| 2025-08-11 | 13F | Annis Gardner Whiting Capital Advisors, LLC | 5.235 | 0,00 | 125 | 5,98 | ||||
| 2025-08-15 | 13F | Morgan Stanley | 1.872.708 | 0,15 | 44.589 | 6,55 | ||||
| 2025-08-14 | 13F | Citadel Advisors Llc | Put | 17.300 | -24,78 | 412 | -20,04 | |||
| 2025-08-14 | 13F | Wetherby Asset Management Inc | 11.514 | 274 | ||||||
| 2025-07-11 | 13F | Farther Finance Advisors, LLC | 667 | 0,00 | 16 | 7,14 | ||||
| 2025-08-14 | 13F | Qube Research & Technologies Ltd | 50.774 | -76,82 | 1.209 | -75,36 | ||||
| 2025-08-14 | 13F | Citadel Advisors Llc | Call | 46.900 | 838,00 | 1.117 | 905,41 | |||
| 2025-07-10 | 13F | Security National Bank | 3.361 | 5,96 | 80 | 14,29 | ||||
| 2025-07-22 | 13F | Romano Brothers And Company | 25.200 | 46,51 | 601 | 56,51 | ||||
| 2025-08-11 | 13F | Greykasell Wealth Strategies, Inc. | 497 | -39,76 | 12 | -38,89 | ||||
| 2025-07-28 | NP | FXED - Sound Enhanced Fixed Income ETF | 52.635 | 1,12 | 1.226 | 0,16 | ||||
| 2025-07-29 | 13F | Private Trust Co Na | 600 | 0,00 | 14 | 7,69 | ||||
| 2025-08-14 | 13F | Citadel Advisors Llc | 74.279 | 176,23 | 1.769 | 194,18 | ||||
| 2025-08-12 | 13F | Virtu Financial LLC | 0 | -100,00 | 0 | |||||
| 2025-07-16 | 13F | Register Financial Advisors LLC | 7.665 | 0,24 | 183 | 6,43 | ||||
| 2025-08-08 | 13F | Pnc Financial Services Group, Inc. | 7.341 | 0,00 | 175 | 6,10 | ||||
| 2025-08-25 | 13F/A | Neuberger Berman Group LLC | 595.029 | -1,60 | 14.168 | 4,68 | ||||
| 2025-07-28 | 13F | Melia Wealth LLC | 614.916 | 3,56 | 14.641 | 10,18 | ||||
| 2025-08-13 | 13F | Lansforsakringar Fondforvaltning AB (publ) | 0 | -100,00 | 0 | |||||
| 2025-08-01 | 13F | Pasadena Private Wealth, LLC | 10.090 | -9,66 | 240 | -3,61 | ||||
| 2025-05-14 | 13F | Campbell & CO Investment Adviser LLC | 0 | -100,00 | 0 | |||||
| 2025-07-24 | 13F | Standard Life Aberdeen plc | 123.237 | -5,70 | 2.936 | 0,75 | ||||
| 2025-07-25 | 13F | Atria Wealth Solutions, Inc. | 8.570 | 204 | ||||||
| 2025-08-13 | 13F | Marshall Wace, Llp | 75.811 | 186,63 | 1.805 | 205,41 | ||||
| 2025-08-14 | 13F | Balyasny Asset Management Llc | 17.540 | 418 | ||||||
| 2025-08-11 | 13F | Lsv Asset Management | 1.055.562 | -10,33 | 25 | -3,85 | ||||
| 2025-08-12 | 13F | Franklin Resources Inc | 485.418 | 9,97 | 11.558 | 17,00 | ||||
| 2025-08-14 | 13F | Benjamin Edwards Inc | 211.976 | 3,40 | 5.047 | 10,00 | ||||
| 2025-08-20 | NP | LSPAX - LoCorr Spectrum Income Fund Class A | 29.829 | -48,40 | 710 | -45,09 | ||||
| 2025-08-14 | 13F | London & Capital Asset Management Ltd | 19.400 | 0,00 | 462 | 6,22 | ||||
| 2025-07-15 | 13F | Family Wealth Partners, Llc | 16.297 | 81,54 | 388 | 94,00 | ||||
| 2025-07-21 | 13F | Future Financial Wealth Managment LLC | 4.200 | 0,00 | 100 | 7,53 | ||||
| 2025-08-13 | 13F | Invesco Ltd. | 30.628 | 7,98 | 729 | 14,98 | ||||
| 2025-04-22 | 13F | Synergy Financial Management, LLC | 0 | -100,00 | 0 | |||||
| 2025-07-14 | 13F | GAMMA Investing LLC | 37 | 0,00 | 1 | |||||
| 2025-08-14 | 13F | DRW Securities, LLC | 25.122 | 598 | ||||||
| 2025-08-14 | 13F | Toroso Investments, LLC | 53.219 | 2,24 | 1.267 | 8,85 | ||||
| 2025-08-13 | 13F | Legacy Capital Wealth Partners, LLC | 61.987 | -3,10 | 1.476 | 3,07 | ||||
| 2025-08-13 | 13F | Texas Capital Bank Wealth Management Services Inc | 148.017 | 5,87 | 3.524 | 12,66 | ||||
| 2025-08-14 | 13F | Mercer Global Advisors Inc /adv | 8.733 | 208 | ||||||
| 2025-07-29 | 13F | Stableford Capital Ii Llc | 8.500 | 208 | ||||||
| 2025-08-04 | 13F | IFG Advisory, LLC | 20.608 | 14,31 | 491 | 21,59 | ||||
| 2025-08-13 | 13F | Advisory Research Inc | 10.564 | -1,55 | 252 | 4,58 | ||||
| 2025-08-13 | 13F | Wambolt & Associates, LLC | 146.586 | -8,68 | 3.487 | -3,14 | ||||
| 2025-07-18 | 13F | Generali Investments CEE, investicni spolecnost, a.s. | 24.084 | 4,50 | 573 | 11,26 | ||||
| 2025-07-25 | NP | First Trust Specialty Finance & Financial Opportunities Fund This fund is a listed as child fund of First Trust Advisors Lp and if that institution has disclosed ownership in this security, then these positions will not be double counted when calculating total shares and total value | 222.000 | 12,69 | 5.170 | 11,64 | ||||
| 2025-08-07 | 13F | Acadian Asset Management Llc | 1.297 | -9,55 | 0 | |||||
| 2025-06-30 | NP | PSP - Invesco Global Listed Private Equity ETF This fund is a listed as child fund of Invesco Ltd. and if that institution has disclosed ownership in this security, then these positions will not be double counted when calculating total shares and total value | 26.905 | -22,31 | 559 | -28,00 | ||||
| 2025-07-25 | 13F | Community Bank, N.A. | 1.000 | 0,00 | 24 | 4,55 | ||||
| 2025-08-14 | 13F | Wells Fargo & Company/mn | 1.241.039 | 3,07 | 29.549 | 9,66 | ||||
| 2025-08-26 | NP | NORTHERN FUNDS - NORTHERN SMALL CAP CORE FUND Class K | 10.068 | -5,54 | 240 | 0,42 | ||||
| 2025-08-11 | 13F | Universal- Beteiligungs- und Servicegesellschaft mbH | 150.543 | 0,00 | 3.584 | 6,41 | ||||
| 2025-07-15 | 13F | SJS Investment Consulting Inc. | 43 | 1 | ||||||
| 2025-08-13 | 13F | Brown Advisory Inc | 38.999 | -14,98 | 929 | -9,55 | ||||
| 2025-07-16 | 13F | Essex Financial Services, Inc. | 41.047 | 4,57 | 977 | 11,28 | ||||
| 2025-07-29 | NP | PPADX - GMO U.S. Opportunistic Value Fund Class III | 21.838 | 509 | ||||||
| 2025-07-08 | 13F | Parallel Advisors, LLC | 18.012 | -13,02 | 429 | -7,56 | ||||
| 2025-08-01 | 13F | Envestnet Asset Management Inc | 538.400 | 8,83 | 12.819 | 15,79 | ||||
| 2025-07-25 | 13F | Concurrent Investment Advisors, LLC | 11.138 | 265 | ||||||
| 2025-07-21 | 13F | Mirae Asset Global Investments Co., Ltd. | 15.050 | 66,87 | 358 | 78,11 | ||||
| 2025-08-08 | 13F | Tortoise Investment Management, LLC | Call | 500 | 0 | |||||
| 2025-07-28 | 13F | Frazier Financial Advisors, LLC | 4.814 | 0,00 | 115 | 6,54 | ||||
| 2025-08-14 | 13F | Stifel Financial Corp | 663.112 | -4,02 | 15.789 | 2,11 | ||||
| 2025-05-30 | NP | ERNZ - TrueShares Active Yield ETF | 13.535 | -93,77 | 303 | -93,47 | ||||
| 2025-08-13 | 13F | Delphi Financial Group, Inc. | 20.041 | -55,57 | 477 | -52,73 | ||||
| 2025-08-14 | 13F | Verition Fund Management LLC | 14.825 | 353 | ||||||
| 2025-06-26 | NP | LSVQX - LSV Small Cap Value Fund Institutional Class Shares | 90.000 | 0,00 | 1.868 | -7,25 | ||||
| 2025-08-14 | 13F | Federation des caisses Desjardins du Quebec | 4.000 | 0,00 | 95 | 6,74 | ||||
| 2025-08-14 | 13F | BI Asset Management Fondsmaeglerselskab A/S | 1.919 | 0,00 | 0 | |||||
| 2025-08-12 | 13F | Advisors Asset Management, Inc. | 206.077 | 16,24 | 4.907 | 23,67 | ||||
| 2025-08-14 | 13F | Two Sigma Advisers, Lp | 678.886 | -7,62 | 16.164 | -1,71 | ||||
| 2025-08-05 | 13F | Bank Of Montreal /can/ | 324.196 | 7.719 | ||||||
| 2025-08-13 | 13F | Russell Investments Group, Ltd. | 94 | -57,27 | 2 | -50,00 | ||||
| 2025-08-14 | 13F | Clayton Partners LLC | 137.140 | -9,62 | 3.265 | -3,83 | ||||
| 2025-07-01 | 13F | Harbor Investment Advisory, Llc | 219 | 2,34 | 5 | 25,00 | ||||
| 2025-05-15 | 13F | Centiva Capital, LP | 0 | -100,00 | 0 | -100,00 | ||||
| 2025-06-25 | NP | VPC - Virtus Private Credit Strategy ETF | 36.498 | -16,64 | 758 | -22,68 | ||||
| 2025-08-14 | 13F | Raymond James Financial Inc | 828.529 | -0,33 | 19.727 | 6,04 | ||||
| 2025-08-14 | 13F | Barnett & Company, Inc. | 36.750 | 22,30 | 875 | 30,21 | ||||
| 2025-08-11 | 13F | Private Advisor Group, LLC | 21.868 | 1,38 | 521 | 7,88 | ||||
| 2025-08-18 | 13F | Wolverine Trading, Llc | Put | 0 | -100,00 | 0 | ||||
| 2025-07-17 | 13F | LexAurum Advisors, LLC | 8.454 | 201 | ||||||
| 2025-08-05 | 13F | Simplex Trading, Llc | 0 | -100,00 | 0 | |||||
| 2025-07-16 | 13F | Eagle Global Advisors Llc | 14.150 | 0,00 | 337 | 6,33 | ||||
| 2025-07-11 | 13F | Mallini Complete Financial Planning LLC | 15.226 | 16,87 | 362 | 24,40 | ||||
| 2025-08-04 | 13F | Savvy Advisors, Inc. | 35.138 | 15,92 | 837 | 23,30 | ||||
| 2025-07-28 | 13F | Harbour Investments, Inc. | 178 | 0,00 | 4 | 33,33 | ||||
| 2025-07-16 | 13F | Magnus Financial Group LLC | 12.526 | -13,05 | 298 | -7,45 | ||||
| 2025-07-18 | 13F | Union Bancaire Privee, UBP SA | 19.319 | 5,09 | 65.559 | 15.851,09 | ||||
| 2025-08-14 | 13F | Susquehanna International Group, Llp | 14.726 | -60,82 | 351 | -58,38 | ||||
| 2025-08-12 | 13F | Argent Trust Co | 144.734 | 36,10 | 3.446 | 44,85 | ||||
| 2025-08-12 | 13F | CIBC Private Wealth Group, LLC | 2.144 | 0,00 | 51 | 24,39 | ||||
| 2025-08-14 | 13F | AllSquare Wealth Management LLC | 500 | 0,00 | 12 | 0,00 | ||||
| 2025-08-05 | 13F | Simplex Trading, Llc | Put | 100 | 0,00 | 0 | ||||
| 2025-08-14 | 13F | Susquehanna International Group, Llp | Call | 107.300 | 29,75 | 2.555 | 38,05 | |||
| 2025-08-05 | 13F | Simplex Trading, Llc | Call | 9.300 | 3.000,00 | 0 | ||||
| 2025-08-14 | 13F | FIL Ltd | 0 | -100,00 | 0 | |||||
| 2025-08-14 | 13F | Susquehanna International Group, Llp | Put | 44.000 | -64,80 | 1.048 | -62,57 | |||
| 2025-08-14 | 13F | Hrt Financial Lp | 190.316 | 185,61 | 5 | 300,00 | ||||
| 2025-07-30 | 13F | Principle Wealth Partners Llc | 11.701 | -11,02 | 279 | -5,44 | ||||
| 2025-08-11 | 13F | Nomura Asset Management Co Ltd | 6.588 | 157 | ||||||
| 2025-08-11 | 13F | Delta Asset Management Llc/tn | 250 | 0,00 | 6 | 0,00 | ||||
| 2025-07-29 | 13F | TrueMark Investments, LLC | 0 | -100,00 | 0 | |||||
| 2025-04-28 | 13F | Redmont Wealth Advisors Llc | 4.341 | 97 | ||||||
| 2025-08-14 | 13F | Millennium Management Llc | 0 | -100,00 | 0 | |||||
| 2025-08-14 | 13F | Bramshill Investments, LLC | 32.652 | -47,47 | 777 | -44,14 | ||||
| 2025-08-12 | 13F | Steward Partners Investment Advisory, Llc | 19.502 | 1,22 | 464 | 7,66 | ||||
| 2025-05-15 | 13F | Nebula Research & Development LLC | 0 | -100,00 | 0 | |||||
| 2025-08-12 | 13F | Trexquant Investment LP | 168.058 | 11,57 | 4.001 | 18,69 | ||||
| 2025-08-12 | 13F | BlackRock, Inc. | 696.005 | 16,84 | 16.572 | 24,30 | ||||
| 2025-08-07 | 13F | Allen Investment Management LLC | 1.557.126 | 8,52 | 37.075 | 15,45 | ||||
| 2025-08-14 | 13F | Parkwood LLC | 184.819 | 0,00 | 4 | 0,00 | ||||
| 2025-08-14 | 13F | Group One Trading, L.p. | Call | 11.100 | 264 | |||||
| 2025-08-06 | 13F | AE Wealth Management LLC | 9.361 | -13,84 | 223 | -8,64 | ||||
| 2025-06-26 | NP | LSVMX - LSV U.S. MANAGED VOLATILITY FUND Institutional Class Shares | 4.700 | 0,00 | 98 | -7,62 | ||||
| 2025-07-30 | NP | BIGTX - The Texas Fund Class I | 5.220 | 89,82 | 122 | 105,08 | ||||
| 2025-08-12 | 13F | Global Retirement Partners, LLC | 2.825 | -80,22 | 67 | -77,96 | ||||
| 2025-08-06 | 13F | Commonwealth Equity Services, Llc | 142.414 | 12,01 | 3 | 50,00 | ||||
| 2025-04-29 | 13F | Riggs Asset Managment Co. Inc. | 0 | -100,00 | 0 | |||||
| 2025-08-14 | 13F | Van Eck Associates Corp | 2.143.789 | -3,78 | 51 | 4,08 | ||||
| 2025-08-01 | 13F | First National Trust Co | 214.770 | 0,00 | 5.114 | 6,39 | ||||
| 2025-08-13 | 13F | Grantham, Mayo, Van Otterloo & Co. LLC | 67.700 | -7,02 | 1.612 | -1,10 | ||||
| 2025-07-18 | 13F | Bartlett & Co. Wealth Management Llc | 700 | 0,00 | 17 | 6,67 | ||||
| 2025-08-14 | 13F | Bank Of America Corp /de/ | 575.432 | -8,50 | 13.701 | -2,66 | ||||
| 2025-08-14 | 13F | Glenview Trust Co | 9.700 | 231 | ||||||
| 2025-07-24 | 13F | Wealthstar Advisors, Llc | 129.482 | -0,40 | 3.083 | 5,95 | ||||
| 2025-08-13 | 13F | Callodine Capital Management, LP | 1.064.824 | -0,02 | 25.353 | 6,36 | ||||
| 2025-07-29 | NP | GBFFX - GMO Benchmark-Free Fund Class III | 2.970 | 69 | ||||||
| 2025-08-13 | 13F | Lido Advisors, LLC | 52.996 | -23,25 | 1.262 | -18,38 | ||||
| 2025-08-14 | 13F | Diversify Advisory Services, LLC | 32.519 | 787 | ||||||
| 2025-08-15 | 13F | Provenance Wealth Advisors, LLC | 100 | 0,00 | 2 | 0,00 | ||||
| 2025-07-21 | 13F | Ameriflex Group, Inc. | 0 | -100,00 | 0 | |||||
| 2025-07-25 | 13F | We Are One Seven, LLC | 427.840 | 3,05 | 10.187 | 9,63 | ||||
| 2025-08-14 | 13F | Glen Eagle Advisors, LLC | 100 | 0,00 | 2 | 0,00 | ||||
| 2025-08-14 | 13F | Sargent Investment Group, LLC | 28.400 | 0,00 | 682 | 7,24 | ||||
| 2025-08-14 | 13F | Comerica Bank | 9.280 | 12,42 | 221 | 19,57 | ||||
| 2025-08-07 | 13F | Hennion & Walsh Asset Management, Inc. | 63.911 | -38,55 | 1.522 | -34,64 | ||||
| 2025-08-15 | 13F | CI Private Wealth, LLC | 113.162 | 181,73 | 2.694 | 200,00 | ||||
| 2025-09-04 | 13F/A | Advisor Group Holdings, Inc. | 40.339 | -4,92 | 961 | 1,16 | ||||
| 2025-07-17 | 13F | Sound Income Strategies, LLC | 2.406.296 | 1,91 | 57.294 | 8,42 | ||||
| 2025-07-14 | 13F | AdvisorNet Financial, Inc | 2.000 | 11,11 | 48 | 17,50 | ||||
| 2025-07-25 | 13F | Cwm, Llc | 64.376 | 7.857,48 | 2 | |||||
| 2025-07-07 | 13F | First Community Trust Na | 1.040 | 0,00 | 25 | 4,35 | ||||
| 2025-07-22 | 13F | Valley National Advisers Inc | 500 | 0 | ||||||
| 2025-07-24 | 13F | IFP Advisors, Inc | 70.817 | -42,45 | 1.686 | -38,76 | ||||
| 2025-08-11 | 13F | HighTower Advisors, LLC | 47.667 | 9,70 | 1.135 | 16,67 | ||||
| 2025-07-30 | 13F | Cullen/frost Bankers, Inc. | 0 | -100,00 | 0 | |||||
| 2025-05-15 | 13F | Quarry LP | 0 | -100,00 | 0 | |||||
| 2025-07-31 | 13F | Sumitomo Mitsui Trust Holdings, Inc. | 527.107 | 21,01 | 12.550 | 28,74 | ||||
| 2025-07-10 | 13F | Worth Asset Management, LLC | 14.322 | 0,10 | 341 | 6,56 | ||||
| 2025-08-14 | 13F | Principal Street Partners, LLC | 14.570 | -4,65 | 347 | 1,47 | ||||
| 2025-08-14 | 13F | Bnp Paribas Arbitrage, Sa | 93.065 | 16,48 | 2.216 | 23,88 | ||||
| 2025-07-28 | NP | PEX - ProShares Global Listed Private Equity ETF | 20.431 | 1,50 | 476 | 0,42 | ||||
| 2025-08-05 | 13F | Bank of New York Mellon Corp | 12.595 | 5,85 | 300 | 12,41 | ||||
| 2025-08-15 | 13F | Kestra Advisory Services, LLC | 39.024 | -17,62 | 929 | -12,36 | ||||
| 2025-08-12 | 13F | Heritage Trust Co | 15.580 | 371 | ||||||
| 2025-08-12 | 13F | Waterloo Capital, L.P. | 103.773 | 7,64 | 2.471 | 14,51 | ||||
| 2025-07-29 | NP | SLPAX - Siit Small Cap Fund - Class A | 12.300 | 0,00 | 286 | -1,04 | ||||
| 2025-08-06 | 13F | Ethos Financial Group, LLC | 29.811 | -26,19 | 710 | -21,48 | ||||
| 2025-07-28 | 13F | Naviter Wealth, LLC | 137.708 | 19,01 | 3.279 | 24,31 | ||||
| 2025-08-11 | 13F | Platform Technology Partners | 27.945 | -4,90 | 665 | 1,22 | ||||
| 2025-08-14 | 13F | Evergreen Capital Management Llc | 16.513 | -4,37 | 393 | 1,81 | ||||
| 2025-08-08 | 13F | MTM Investment Management, LLC | 2.040 | 49 | ||||||
| 2025-07-17 | 13F | Beacon Capital Management, LLC | 1.204 | 2,29 | 29 | 7,69 | ||||
| 2025-08-18 | 13F | Geneos Wealth Management Inc. | 1.746 | 0,00 | 42 | 5,13 | ||||
| 2025-08-11 | 13F | Brown Brothers Harriman & Co | 100 | 2 | ||||||
| 2025-08-05 | 13F | Westside Investment Management, Inc. | 286 | 7 | ||||||
| 2025-08-12 | 13F | Legal & General Group Plc | 622.774 | 0,14 | 14.822 | 6,57 | ||||
| 2025-07-09 | 13F | Inspirion Wealth Advisors, Llc | 15.426 | 0,00 | 367 | 6,38 | ||||
| 2025-07-11 | 13F | SILVER OAK SECURITIES, Inc | 19.955 | 145,57 | 475 | 162,43 | ||||
| 2025-08-15 | 13F | WealthCollab, LLC | 225 | -43,47 | 5 | -37,50 | ||||
| 2025-08-11 | 13F | Nations Financial Group Inc, /ia/ /adv | 35.508 | -2,42 | 845 | 3,81 | ||||
| 2025-08-14 | 13F | Fmr Llc | 34 | 0,00 | 1 | |||||
| 2025-08-12 | 13F | Cornerstone Wealth Management, LLC | 46.666 | -0,14 | 1.111 | 6,32 | ||||
| 2025-08-13 | 13F | Burgundy Asset Management Ltd. | 2.378.968 | 1,36 | 56.643 | 7,84 | ||||
| 2025-08-08 | 13F | Larson Financial Group LLC | 161 | 1,90 | 4 | 0,00 | ||||
| 2025-08-13 | 13F | Northwestern Mutual Wealth Management Co | 83 | -82,23 | 2 | -90,00 | ||||
| 2025-08-14 | 13F | Jane Street Group, Llc | 52.974 | 1.261 | ||||||
| 2025-08-08 | 13F | Creative Planning | 38.717 | -3,54 | 922 | 2,56 | ||||
| 2025-08-14 | 13F | Jane Street Group, Llc | Call | 12.200 | 290 | |||||
| 2025-05-05 | 13F | Lindbrook Capital, Llc | 260 | 61,49 | 6 | 66,67 | ||||
| 2025-08-14 | 13F | Dearborn Partners Llc | 63.576 | 0,27 | 1.514 | 6,62 | ||||
| 2025-08-13 | 13F | ExodusPoint Capital Management, LP | 0 | -100,00 | 0 | |||||
| 2025-08-13 | 13F | Whalerock Point Partners, Llc | 13.200 | 24,24 | 314 | 32,49 | ||||
| 2025-07-09 | 13F | Pallas Capital Advisors LLC | 48.778 | -9,64 | 1.161 | -3,89 | ||||
| 2025-07-30 | 13F | Denali Advisors Llc | 198.685 | -2,34 | 4.731 | 3,91 | ||||
| 2025-08-08 | 13F | Cetera Investment Advisers | 494.410 | 10,14 | 11.772 | 17,17 | ||||
| 2025-08-13 | 13F | SCS Capital Management LLC | 622.522 | 2,86 | 14.822 | 9,43 | ||||
| 2025-08-21 | NP | BIZD - VanEck Vectors BDC Income ETF | 1.873.346 | -9,19 | 44.604 | -3,39 | ||||
| 2025-06-27 | NP | LBO - WHITEWOLF Publicly Listed Private Equity ETF | 6.624 | 14,29 | 138 | 6,20 | ||||
| 2025-08-04 | 13F | Strs Ohio | 3.176.606 | -10,80 | 75.635 | -5,10 | ||||
| 2025-08-08 | 13F | Marble Harbor Investment Counsel, LLC | 10.210 | -10,00 | 243 | -3,95 | ||||
| 2025-07-21 | 13F | Vaughan Nelson Investment Management, L.p. | 5.350 | 0,00 | 127 | |||||
| 2025-08-08 | 13F | Advisors Capital Management, LLC | 718.338 | 1,95 | 17.104 | 8,46 | ||||
| 2025-08-29 | NP | John Hancock Financial Opportunities Fund | 228.214 | 0,00 | 5.434 | 6,38 | ||||
| 2025-07-09 | 13F | Westmount Partners, LLC | 13.030 | 0,00 | 310 | 6,53 | ||||
| 2025-08-06 | 13F | Baillie Gifford & Co | 0 | -100,00 | 0 | -100,00 | ||||
| 2025-07-23 | 13F | PARK CIRCLE Co | 62.000 | 0,00 | 1.476 | 6,42 | ||||
| 2025-08-12 | 13F | MAI Capital Management | 4.264 | 83,48 | 102 | 94,23 | ||||
| 2025-08-13 | 13F | Virtus Investment Advisers, Inc. | 29.302 | -26,67 | 698 | -22,04 | ||||
| 2025-07-29 | 13F | Chicago Partners Investment Group LLC | 22.864 | 1,33 | 560 | 19,15 | ||||
| 2025-08-08 | 13F | Alberta Investment Management Corp | 0 | -100,00 | 0 | |||||
| 2025-08-14 | 13F | Royal Bank Of Canada | 141.477 | 13,87 | 3.369 | 21,19 | ||||
| 2025-08-12 | 13F | LPL Financial LLC | 609.227 | 0,94 | 14.506 | 7,39 | ||||
| 2025-08-13 | 13F | Jones Financial Companies Lllp | 604 | 0,00 | 14 | 7,69 | ||||
| 2025-05-16 | 13F | Coppell Advisory Solutions LLC | 0 | -100,00 | 0 | |||||
| 2025-07-16 | 13F | Dakota Wealth Management | 39.220 | 8,27 | 934 | 15,19 | ||||
| 2025-08-12 | 13F | Proequities, Inc. | Call | 0 | 0 | |||||
| 2025-08-13 | 13F | EverSource Wealth Advisors, LLC | 1.061 | 0,00 | 25 | 8,70 | ||||
| 2025-08-12 | 13F | Proequities, Inc. | 0 | 0 | ||||||
| 2025-07-30 | 13F | D.a. Davidson & Co. | 179.702 | 3,56 | 4.279 | 10,17 | ||||
| 2025-05-15 | 13F | Brevan Howard Capital Management LP | 0 | -100,00 | 0 | |||||
| 2025-08-13 | 13F | Beacon Pointe Advisors, LLC | 49.612 | 58,49 | 1.181 | 68,71 | ||||
| 2025-07-24 | 13F | Robertson Stephens Wealth Management, LLC | 9.700 | 0,00 | 231 | 5,99 | ||||
| 2025-08-13 | 13F | Cerity Partners LLC | 422.634 | -4,82 | 10.063 | 1,26 | ||||
| 2025-08-13 | 13F | Guggenheim Capital Llc | 26.971 | 5,81 | 642 | 12,63 | ||||
| 2025-08-14 | 13F | Manufacturers Life Insurance Company, The | 230.586 | -0,88 | 5.490 | 5,46 | ||||
| 2025-08-13 | 13F | OMERS ADMINISTRATION Corp | 178.214 | 4.243 | ||||||
| 2025-07-09 | 13F | Mirador Capital Partners LP | 21.920 | 4,38 | 522 | 10,85 | ||||
| 2025-08-11 | 13F | Citigroup Inc | 0 | -100,00 | 0 | |||||
| 2025-07-31 | 13F | Buckingham Strategic Partners | 16.296 | 81,55 | 388 | 94,00 | ||||
| 2025-07-30 | 13F | Whittier Trust Co Of Nevada Inc | 9.575 | 0,00 | 228 | 6,07 | ||||
| 2025-08-11 | 13F | Core Wealth Partners LLC | 11.668 | 0,00 | 278 | 6,13 | ||||
| 2025-08-08 | 13F | Hartland & Co., LLC | 18.000 | 0,00 | 429 | 6,47 | ||||
| 2025-08-14 | 13F | Lazard Asset Management Llc | 32.266 | -38,05 | 1 | -100,00 | ||||
| 2025-08-07 | 13F | Evoke Wealth, Llc | 39.859 | 0,00 | 949 | 6,39 | ||||
| 2025-08-13 | 13F | Truvestments Capital Llc | 193.963 | -0,71 | 4.618 | 5,65 | ||||
| 2025-07-30 | 13F | Mid-American Wealth Advisory Group, Inc. | 189 | 4 | ||||||
| 2025-08-08 | 13F | Bouchey Financial Group Ltd | 30.252 | 0,00 | 720 | 6,35 | ||||
| 2025-04-30 | 13F | Stratos Wealth Advisors, LLC | 0 | -100,00 | 0 | |||||
| 2025-07-28 | 13F | RMR Capital Management, LLC | 190.495 | -21,68 | 4.536 | -16,68 | ||||
| 2025-07-23 | 13F | Columbus Macro, LLC | 437.561 | 12,40 | 10.418 | 19,60 | ||||
| 2025-08-13 | 13F | Natixis | 25.249 | 0,00 | 601 | 6,75 | ||||
| 2025-07-30 | 13F | Blume Capital Management, Inc. | 450 | 0,00 | 11 | 0,00 | ||||
| 2025-08-08 | 13F/A | Ignite Planners, LLC | 71.358 | 53,96 | 1.770 | 85,82 | ||||
| 2025-08-14 | 13F | Integrated Wealth Concepts LLC | 18.339 | 10,88 | 437 | 17,84 | ||||
| 2025-08-14 | 13F | Progeny 3, Inc. | 2.476.398 | 0,96 | 58.963 | 7,41 | ||||
| 2025-05-14 | 13F | Group One Trading, L.p. | 0 | -100,00 | 0 | -100,00 | ||||
| 2025-08-12 | 13F | Atlas Capital Advisors Llc | 5.115 | 0,00 | 122 | 6,14 | ||||
| 2025-07-07 | 13F | Thurston, Springer, Miller, Herd & Titak, Inc. | 200 | 0,00 | 5 | 0,00 | ||||
| 2025-08-28 | NP | SMVIX - Simt Small Cap Value Fund Class I | 4.848 | -71,11 | 115 | -69,33 | ||||
| 2025-08-07 | 13F | Merrion Investment Management Co, LLC | 25.000 | 0,00 | 595 | 6,44 | ||||
| 2025-08-14 | 13F | Ameriprise Financial Inc | 215.650 | 6,58 | 5.176 | 14,24 | ||||
| 2025-06-10 | 13F | Birchbrook, Inc. | 0 | -100,00 | 0 | -100,00 | ||||
| 2025-08-12 | 13F | Jpmorgan Chase & Co | 942.789 | 0,49 | 22.448 | 6,92 | ||||
| 2025-08-14 | 13F | State Street Corp | 89.663 | 257,76 | 2.135 | 281,07 | ||||
| 2025-07-22 | 13F | Grimes & Company, Inc. | 12.161 | 290 | ||||||
| 2025-08-13 | 13F | Barclays Plc | 0 | -100,00 | 0 | |||||
| 2025-08-13 | 13F | Quadrant Capital Group Llc | 0 | -100,00 | 0 | |||||
| 2025-07-10 | 13F | Peoples Bank/KS | 0 | -100,00 | 0 | |||||
| 2025-08-14 | 13F | Quantinno Capital Management LP | 58.035 | 1.382 | ||||||
| 2025-08-15 | 13F | Captrust Financial Advisors | 44.425 | -31,00 | 1.058 | -26,60 | ||||
| 2025-08-13 | 13F | Plan Group Financial, LLC | 51.428 | 32,13 | 1.224 | 40,53 | ||||
| 2025-05-14 | 13F | Caitlin John, LLC | 0 | -100,00 | 0 | |||||
| 2025-07-29 | NP | GIMFX - GMO Implementation Fund | 6.729 | 157 | ||||||
| 2025-08-06 | 13F | First Horizon Advisors, Inc. | 4.123 | 73,97 | 98 | 84,91 | ||||
| 2025-08-12 | 13F | XTX Topco Ltd | 51.926 | 1.236 | ||||||
| 2025-07-15 | 13F | Riverbridge Partners Llc | 48.835 | 3,37 | 1.163 | 9,93 | ||||
| 2025-05-14 | 13F | Group One Trading, L.p. | Put | 0 | -100,00 | 0 | -100,00 | |||
| 2025-07-28 | 13F | BRYN MAWR TRUST Co | 31.070 | 0,00 | 740 | 6,33 | ||||
| 2025-08-14 | 13F | Ares Management Llc | 1.402.689 | 2,19 | 33.398 | 8,72 | ||||
| 2025-08-14 | 13F | Goldman Sachs Group Inc | 347.494 | 336,55 | 8.274 | 364,51 | ||||
| 2025-07-17 | 13F | Janney Montgomery Scott LLC | 264.827 | -4,34 | 6 | 0,00 | ||||
| 2025-07-18 | 13F | SOA Wealth Advisors, LLC. | 0 | -100,00 | 0 | |||||
| 2025-08-14 | 13F | IHT Wealth Management, LLC | 105.149 | 6,64 | 2.504 | 13,46 | ||||
| 2025-07-29 | 13F | Stratos Wealth Partners, LTD. | 9.484 | 0,32 | 226 | 6,64 | ||||
| 2025-07-09 | 13F | Gilman Hill Asset Management, LLC | 465.241 | 4,09 | 11.077 | 10,74 | ||||
| 2025-08-14 | 13F/A | Rockefeller Capital Management L.P. | 207.112 | 7,31 | 4.931 | 14,17 | ||||
| 2025-08-04 | 13F | Canton Hathaway, LLC | 47.430 | -1,66 | 1 | 0,00 | ||||
| 2025-07-22 | 13F | Sage Investment Counsel LLC | 26.277 | 0,00 | 626 | 6,29 | ||||
| 2025-08-13 | 13F | Cresset Asset Management, LLC | 303.843 | -0,12 | 7.235 | 6,26 | ||||
| 2025-08-12 | 13F | Sixth Street Partners Management Company, L.P. | 2.714.226 | 0,00 | 64.626 | 6,39 | ||||
| 2025-08-15 | 13F | Great West Life Assurance Co /can/ | 136.054 | 2,59 | 3 | 50,00 | ||||
| 2025-08-21 | NP | MOFTX - Mercer Opportunistic Fixed Income Fund Class I | 30.000 | 714 | ||||||
| 2025-08-26 | NP | GMOV - GMO U.S. Value ETF | 2.345 | -1,64 | 56 | 3,77 | ||||
| 2025-08-06 | 13F | Texas Yale Capital Corp. | 35.500 | 1,43 | 845 | 7,92 | ||||
| 2025-07-24 | 13F | Us Bancorp \de\ | 25.113 | 0,00 | 598 | 6,23 | ||||
| 2025-08-08 | 13F | Lgt Capital Partners Ltd. | 336.500 | -14,81 | 8.012 | -9,37 | ||||
| 2025-08-12 | 13F | Financial Advocates Investment Management | 0 | -100,00 | 0 | |||||
| 2025-08-14 | 13F | D. E. Shaw & Co., Inc. | 24.606 | 586 | ||||||
| 2025-08-12 | 13F | Proequities, Inc. | Put | 0 | 0 | |||||
| 2025-08-14 | 13F | Boston Private Wealth Llc | 0 | -100,00 | 0 |