Statistiche di base
| Proprietari istituzionali | 133 total, 131 long only, 1 short only, 1 long/short - change of -5,63% MRQ |
| Allocazione media del portafoglio | 0.1609 % - change of -17,07% MRQ |
| Azioni istituzionali (Long) | 24.428.876 (ex 13D/G) - change of -3,84MM shares -13,54% MRQ |
| Valore istituzionale (Long) | $ 222.997 USD ($1000) |
Proprietà istituzionale e azionisti
PennantPark Floating Rate Capital Ltd. (US:PFLT) ha 133 proprietari istituzionali e azionisti che hanno presentato i moduli 13D/G o 13F alla Securities Exchange Commission (SEC). Queste istituzioni detengono un totale di 24,428,876 azioni. I maggiori azionisti includono Sound Income Strategies, LLC, Van Eck Associates Corp, BIZD - VanEck Vectors BDC Income ETF, Altshuler Shaham Ltd, Marshall Wace, Llp, UBS Group AG, Invesco Ltd., KBWD - Invesco KBW High Dividend Yield Financial ETF, Two Sigma Investments, Lp, and Qube Research & Technologies Ltd .
(PennantPark Floating Rate Capital Ltd. (NYSE:PFLT) la struttura proprietaria istituzionale mostra le attuali posizioni nella società da parte di istituzioni e fondi, nonché le ultime variazioni nella dimensione della posizione. I principali azionisti possono essere singoli investitori, fondi comuni, hedge fund o istituzioni. L'allegato 13D indica che l'investitore detiene (o ha detenuto) più del 5% della società e intende (o intendeva) perseguire attivamente un cambiamento nella strategia aziendale. L'allegato 13G indica un investimento passivo superiore al 5%.
The share price as of September 5, 2025 is 10,26 / share. Previously, on September 6, 2024, the share price was 11,44 / share. This represents a decline of 10,31% over that period.

Indice del sentiment dei fondi
L'indice del sentiment dei fondi (anche noto come "indice di accumulo di proprietà") individua i titoli più acquistati dai fondi. È il risultato di un sofisticato modello quantitativo multi-fattore che identifica le società con i più alti livelli di accumulo istituzionale. Il modello utilizza una combinazione dell'aumento totale dei proprietari dichiarati, delle variazioni nelle allocazioni di portafoglio di tali proprietari e di altre metriche. Il punteggio varia da 0 a 100: i numeri più alti indicano un livello di accumulo superiore ad altre società, mentre 50 rappresenta la media.
Frequenza di aggiornamento: giornaliera
Consulta Ownership Explorer per visualizzare l'elenco delle aziende con il ranking più alto.
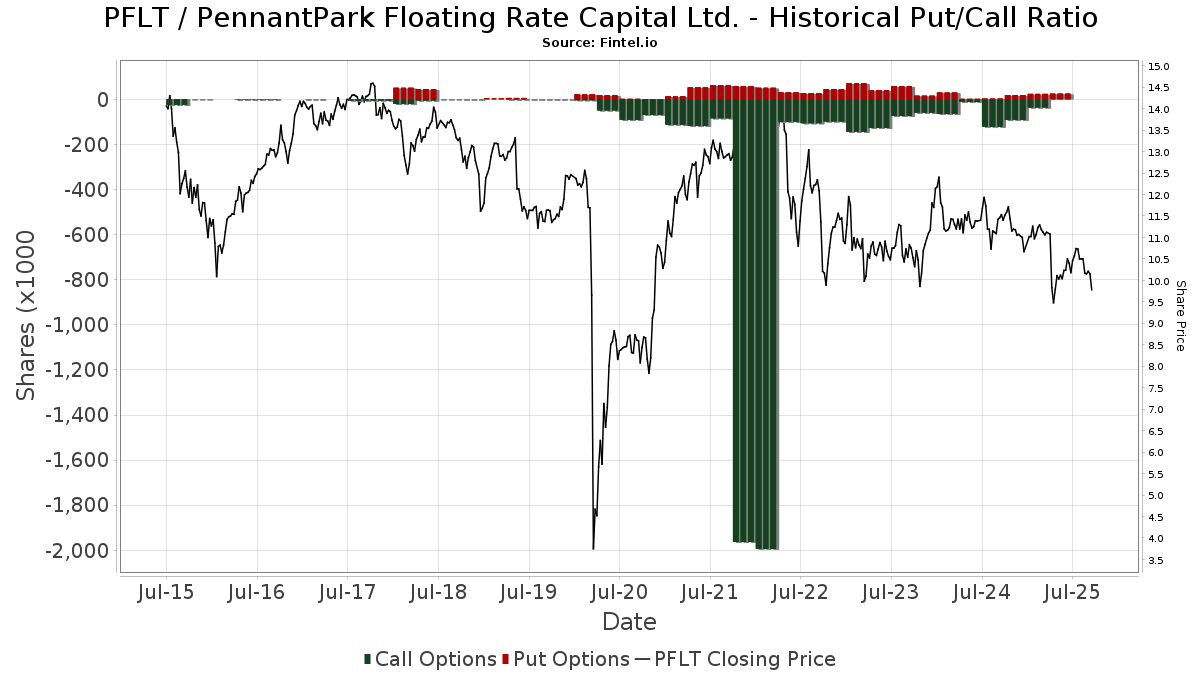
Rapporto put/call istituzionale
Oltre a segnalare le emissioni standard di titoli azionari e di debito, gli istituti con più di 100 milioni di asset in gestione devono anche dichiarare le loro partecipazioni in opzioni put e call. Poiché le opzioni put indicano generalmente un sentiment negativo e le opzioni call un sentiment positivo, possiamo avere un'idea del sentiment istituzionale complessivo attraverso il rapporto tra put e call. Il grafico a destra mostra il rapporto storico put/call per questo strumento.
L'utilizzo del rapporto put/call come indicatore del sentiment degli investitori consente di superare una delle principali lacune dell'utilizzo della proprietà istituzionale totale, ovvero il fatto che una quantità significativa di asset in gestione viene investita passivamente per seguire gli indici. Generalmente, i fondi a gestione passiva non acquistano opzioni, per cui il rapporto put/call riflette più fedelmente il sentiment dei fondi a gestione attiva.
Depositi 13F e NPORT
Le informazioni relative ai depositi 13F sono gratuite. Per accedere alle informazioni relative ai depositi NP è necessario un'abbonamento premium. Le righe verdi indicano le nuove posizioni. Le righe rosse indicano le posizioni chiuse. Fai clic sull'icona del link per visualizzare la cronologia completa delle transazioni.
Esegui l'upgrade
per sbloccare i dati premium ed esportarli in Excel ![]() .
.
| Data di deposito | Fonte | Investitore | Tipo | Prezzo medio (Stima) |
Azioni | Δ Azioni (%) |
Valore dichiarato ($ 1000) |
Δ Valore (%) |
Allocazione del portafoglio (%) |
|
|---|---|---|---|---|---|---|---|---|---|---|
| 2025-08-12 | 13F | Change Path, LLC | 12.006 | 124 | ||||||
| 2025-08-04 | 13F | Muzinich & Co., Inc. | 104.859 | 103,00 | 1.083 | 87,37 | ||||
| 2025-07-29 | 13F | Private Trust Co Na | 2.530 | 0,00 | 26 | -7,14 | ||||
| 2025-07-30 | 13F | FNY Investment Advisers, LLC | 1.200 | 0,00 | 0 | |||||
| 2025-05-15 | 13F | Gwn Securities Inc. | 0 | -100,00 | 0 | -100,00 | ||||
| 2025-08-14 | 13F | Two Sigma Securities, Llc | 0 | -100,00 | 0 | |||||
| 2025-05-14 | 13F | Group One Trading, L.p. | Call | 0 | -100,00 | 0 | -100,00 | |||
| 2025-08-14 | 13F | Van Eck Associates Corp | 2.358.575 | 20,52 | 24 | 14,29 | ||||
| 2025-07-23 | 13F | Fulton Breakefield Broenniman Llc | 11.798 | 0,00 | 122 | -8,33 | ||||
| 2025-08-12 | 13F | Cornerstone Wealth Management, LLC | 64.809 | -12,10 | 669 | -18,91 | ||||
| 2025-08-12 | 13F | LPL Financial LLC | 244.157 | -44,38 | 2.522 | -48,66 | ||||
| 2025-04-22 | 13F | Synergy Financial Management, LLC | 0 | -100,00 | 0 | -100,00 | ||||
| 2025-08-06 | 13F | Commonwealth Equity Services, Llc | 91.475 | 12,50 | 1 | |||||
| 2025-08-11 | 13F | Principal Securities, Inc. | 0 | -100,00 | 0 | |||||
| 2025-05-14 | 13F | Virtus ETF Advisers LLC | 0 | -100,00 | 0 | -100,00 | ||||
| 2025-08-12 | 13F | Trexquant Investment LP | 269.430 | -35,34 | 2.783 | -40,30 | ||||
| 2025-08-07 | 13F | PFG Advisors | 110.108 | 1,81 | 1.137 | -6,03 | ||||
| 2025-07-28 | 13F | BRYN MAWR TRUST Co | 3.363 | 0,00 | 35 | -8,11 | ||||
| 2025-08-05 | 13F | Strategic Financial Concepts, LLC | 63.200 | -1,50 | 648 | -9,76 | ||||
| 2025-08-14 | 13F | D. E. Shaw & Co., Inc. | 0 | -100,00 | 0 | |||||
| 2025-08-13 | 13F | Garner Asset Management Corp | 14.267 | -2,41 | 147 | -9,82 | ||||
| 2025-08-11 | 13F | Pin Oak Investment Advisors Inc | 0 | 0 | ||||||
| 2025-08-08 | 13F | Larson Financial Group LLC | 511 | 41,94 | 5 | 25,00 | ||||
| 2025-08-12 | 13F | Global Retirement Partners, LLC | 3.928 | -79,34 | 41 | -80,68 | ||||
| 2025-08-13 | 13F | Continuum Advisory, LLC | 0 | -100,00 | 0 | |||||
| 2025-04-24 | 13F | Allspring Global Investments Holdings, LLC | 0 | -100,00 | 0 | -100,00 | ||||
| 2025-07-08 | 13F | Parallel Advisors, LLC | 0 | -100,00 | 0 | |||||
| 2025-08-04 | 13F | Creekmur Asset Management LLC | 9 | 12,50 | 0 | |||||
| 2025-08-07 | 13F | Allworth Financial LP | 2.777 | 1.603,68 | 29 | 2.700,00 | ||||
| 2025-08-14 | 13F | Schonfeld Strategic Advisors LLC | 18.126 | 187 | ||||||
| 2025-08-11 | 13F | Empowered Funds, LLC | 10.193 | -8,33 | 105 | -15,32 | ||||
| 2025-07-28 | NP | FXED - Sound Enhanced Fixed Income ETF | 104.495 | 1,12 | 1.076 | -8,11 | ||||
| 2025-04-10 | 13F | Firethorn Wealth Partners, Llc | 0 | -100,00 | 0 | -100,00 | ||||
| 2025-04-23 | 13F | Walkner Condon Financial Advisors LLC | 0 | -100,00 | 0 | -100,00 | ||||
| 2025-07-17 | 13F | Vermillion Wealth Management, Inc. | 500 | 0,00 | 5 | 0,00 | ||||
| 2025-09-04 | 13F/A | Advisor Group Holdings, Inc. | 162.389 | 38,36 | 1.678 | 27,72 | ||||
| 2025-08-13 | 13F | Lido Advisors, LLC | 16.381 | 171 | ||||||
| 2025-08-07 | 13F | Resources Investment Advisors, LLC. | 12.543 | 0,00 | 130 | -7,86 | ||||
| 2025-08-14 | 13F | Aquatic Capital Management LLC | 0 | -100,00 | 0 | |||||
| 2025-08-13 | 13F | Virtus Investment Advisers, Inc. | 88.549 | -10,61 | 915 | -17,51 | ||||
| 2025-08-12 | 13F | BlackRock, Inc. | 500.758 | 30,73 | 5.173 | 20,67 | ||||
| 2025-08-21 | NP | BIZD - VanEck Vectors BDC Income ETF | 2.247.824 | 16,02 | 23.220 | 7,11 | ||||
| 2025-08-06 | 13F | Golden State Wealth Management, LLC | 9.756 | 101 | ||||||
| 2025-08-11 | 13F | Citigroup Inc | 34.398 | 218,56 | 355 | 195,83 | ||||
| 2025-07-10 | 13F | Sovran Advisors, LLC | 34.184 | 2,01 | 361 | 10,77 | ||||
| 2025-08-11 | 13F | Delta Asset Management Llc/tn | 943 | 0,00 | 10 | -10,00 | ||||
| 2025-08-14 | 13F | Mariner, LLC | 13.296 | 137 | ||||||
| 2025-08-13 | 13F | Marshall Wace, Llp | 1.439.742 | -16,75 | 14.873 | -23,15 | ||||
| 2025-08-14 | 13F | Mpwm Advisory Solutions, Llc | 5.000 | 0,00 | 52 | -7,27 | ||||
| 2025-08-14 | 13F | Sunbelt Securities, Inc. | 8.224 | -26,73 | 90 | -28,80 | ||||
| 2025-08-08 | 13F | Investment Partners, Ltd. | 10.000 | 0,00 | 103 | -7,21 | ||||
| 2025-08-14 | 13F | Royal Bank Of Canada | 19.604 | -32,18 | 202 | -37,46 | ||||
| 2025-07-18 | 13F | SOA Wealth Advisors, LLC. | 0 | -100,00 | 0 | |||||
| 2025-08-06 | 13F | AE Wealth Management LLC | 21.641 | 18,74 | 224 | 9,85 | ||||
| 2025-08-14 | 13F | Brevan Howard Capital Management LP | 141.985 | 118,14 | 1.467 | 101,37 | ||||
| 2025-05-08 | 13F | We Are One Seven, LLC | 0 | -100,00 | 0 | -100,00 | ||||
| 2025-08-13 | 13F | Guggenheim Capital Llc | 51.986 | 6,32 | 537 | -1,83 | ||||
| 2025-08-14 | 13F | Financial Network Wealth Advisors LLC | 1.426 | 0,00 | 15 | -6,67 | ||||
| 2025-08-14 | 13F | AllSquare Wealth Management LLC | 9.200 | 0,00 | 95 | -6,86 | ||||
| 2025-08-13 | 13F | Northern Trust Corp | 41.596 | 181,36 | 430 | 160,00 | ||||
| 2025-08-14 | 13F | Glenview Trust Co | 10.650 | 110 | ||||||
| 2025-05-12 | 13F | Simplex Trading, Llc | Call | 0 | -100,00 | 0 | ||||
| 2025-04-29 | 13F | Raleigh Capital Management Inc. | 0 | -100,00 | 0 | -100,00 | ||||
| 2025-08-13 | 13F | M&t Bank Corp | 21.899 | 0,00 | 226 | -7,76 | ||||
| 2025-05-12 | 13F | National Bank Of Canada /fi/ | 0 | -100,00 | 0 | |||||
| 2025-07-18 | 13F | PFG Investments, LLC | 118.908 | 5,61 | 1.228 | -2,46 | ||||
| 2025-05-29 | NP | JAFEX - Total Stock Market Index Trust NAV | 19 | -97,50 | 0 | -100,00 | ||||
| 2025-08-13 | 13F | Quadrature Capital Ltd | 0 | -100,00 | 0 | |||||
| 2025-08-12 | 13F | Entropy Technologies, LP | 12.594 | -80,06 | 130 | -81,59 | ||||
| 2025-06-27 | NP | LBO - WHITEWOLF Publicly Listed Private Equity ETF | 11.119 | 14,28 | 112 | 3,70 | ||||
| 2025-08-12 | 13F | Calton & Associates, Inc. | 10.938 | 113 | ||||||
| 2025-08-08 | 13F | Strategies Wealth Advisors, LLC | 12.921 | 2,96 | 133 | -5,00 | ||||
| 2025-05-08 | 13F | Arkadios Wealth Advisors | 0 | -100,00 | 0 | -100,00 | ||||
| 2025-08-12 | 13F | PSI Advisors, LLC | 0 | -100,00 | 0 | |||||
| 2025-08-13 | 13F | Quantbot Technologies LP | 21.234 | 219 | ||||||
| 2025-08-14 | 13F | Bnp Paribas Arbitrage, Sa | 5.284 | 55 | ||||||
| 2025-08-14 | 13F | Nebula Research & Development LLC | 56.045 | 31,09 | 579 | 20,92 | ||||
| 2025-08-06 | 13F | Yelin Lapidot Holdings Management Ltd. | 19.500 | 0,00 | 201 | -7,80 | ||||
| 2025-05-15 | 13F | Oxford Asset Management Llp | 12.186 | 136 | ||||||
| 2025-08-15 | 13F | Tower Research Capital LLC (TRC) | 358 | -92,84 | 4 | -94,55 | ||||
| 2025-08-14 | 13F | Altshuler Shaham Ltd | 1.730.086 | 9,98 | 17.872 | 1,52 | ||||
| 2025-07-30 | 13F | Mid-American Wealth Advisory Group, Inc. | 485 | 5 | ||||||
| 2025-07-28 | 13F | Harbour Investments, Inc. | 1.000 | 0,00 | 10 | -9,09 | ||||
| 2025-08-13 | 13F | EverSource Wealth Advisors, LLC | 1.452 | 1.257,01 | 15 | 1.300,00 | ||||
| 2025-05-12 | 13F | Fmr Llc | 0 | -100,00 | 0 | |||||
| 2025-08-12 | 13F | Magnetar Financial LLC | 0 | -100,00 | 0 | |||||
| 2025-08-12 | 13F | Advisors Asset Management, Inc. | 329.829 | -0,39 | 3.407 | -8,04 | ||||
| 2025-07-17 | 13F | Sound Income Strategies, LLC | 3.904.625 | 8,91 | 40.335 | 0,54 | ||||
| 2025-08-14 | 13F | Camden Capital, LLC | 26.658 | 0,00 | 275 | -7,72 | ||||
| 2025-07-29 | 13F | TrueMark Investments, LLC | 0 | -100,00 | 0 | -100,00 | ||||
| 2025-08-14 | 13F | Raymond James Financial Inc | 25.177 | -18,34 | 260 | -24,42 | ||||
| 2025-08-11 | 13F | HighTower Advisors, LLC | 95.188 | -1,24 | 983 | -8,81 | ||||
| 2025-08-14 | 13F | Murphy & Mullick Capital Management Corp | 1.038 | 2,67 | 11 | -9,09 | ||||
| 2025-08-14 | 13F | Ameriprise Financial Inc | 69.959 | 7,41 | 707 | -3,28 | ||||
| 2025-08-11 | 13F | NewEdge Wealth, LLC | 295.639 | 3,33 | 3.075 | -3,97 | ||||
| 2025-08-14 | 13F | Hrt Financial Lp | 0 | -100,00 | 0 | |||||
| 2025-08-26 | NP | MCTOX - Modern Capital Tactical Opportunities Fund Class A Shares | 0 | -100,00 | 0 | -100,00 | ||||
| 2025-08-13 | 13F | Russell Investments Group, Ltd. | 0 | -100,00 | 0 | |||||
| 2025-07-17 | 13F | Janney Montgomery Scott LLC | 41.874 | -4,21 | 0 | |||||
| 2025-08-14 | 13F | Balyasny Asset Management Llc | 243.615 | -58,07 | 2.517 | -61,30 | ||||
| 2025-08-14 | 13F | Citadel Advisors Llc | 0 | -100,00 | 0 | |||||
| 2025-04-21 | 13F | Ronald Blue Trust, Inc. | 0 | -100,00 | 0 | -100,00 | ||||
| 2025-08-14 | 13F | Bank Of America Corp /de/ | 14.429 | -3,74 | 149 | -10,78 | ||||
| 2025-08-11 | 13F | Private Advisor Group, LLC | 16.438 | 2,41 | 170 | -5,59 | ||||
| 2025-07-11 | 13F | Farther Finance Advisors, LLC | 1.594 | 5,15 | 16 | 0,00 | ||||
| 2025-08-13 | 13F | ExodusPoint Capital Management, LP | 32.900 | -54,18 | 0 | |||||
| 2025-08-14 | 13F | Group One Trading, L.p. | 95 | 0,00 | 1 | -100,00 | ||||
| 2025-07-18 | 13F | Truist Financial Corp | 15.795 | 5,12 | 163 | -2,98 | ||||
| 2025-08-12 | 13F | MAI Capital Management | 3.296 | -4,79 | 34 | -10,53 | ||||
| 2025-05-16 | 13F/A | Goldman Sachs Group Inc | 0 | -100,00 | 0 | -100,00 | ||||
| 2025-08-13 | 13F | Jump Financial, LLC | 20.995 | 217 | ||||||
| 2025-07-22 | 13F | Miracle Mile Advisors, LLC | 11.388 | 2,97 | 118 | -4,88 | ||||
| 2025-08-01 | 13F | Y-Intercept (Hong Kong) Ltd | 207.207 | 734,74 | 2.140 | 672,56 | ||||
| 2025-08-12 | 13F | Hillsdale Investment Management Inc. | 0 | -100,00 | 0 | |||||
| 2025-08-14 | 13F | Susquehanna International Group, Llp | 110.971 | 328,51 | 1.146 | 296,54 | ||||
| 2025-08-12 | 13F | Dynamic Technology Lab Private Ltd | 14.271 | 5,32 | 147 | -2,65 | ||||
| 2025-08-13 | 13F | PharVision Advisers, LLC | 0 | -100,00 | 0 | |||||
| 2025-08-14 | 13F | Scoggin Management Lp | 0 | -100,00 | 0 | |||||
| 2025-08-06 | 13F | First Horizon Advisors, Inc. | 566 | 6 | ||||||
| 2025-08-12 | 13F | Virtu Financial LLC | 0 | -100,00 | 0 | |||||
| 2025-08-14 | 13F | Wells Fargo & Company/mn | 94.376 | 245,17 | 975 | 219,34 | ||||
| 2025-08-14 | 13F | Stifel Financial Corp | 58.603 | -2,99 | 605 | -10,37 | ||||
| 2025-08-11 | 13F | Synergy Investment Management, LLC | 25.011 | 10,42 | 258 | 1,98 | ||||
| 2025-08-14 | 13F | GWM Advisors LLC | 4.714 | 0,00 | 49 | -7,69 | ||||
| 2025-08-12 | 13F | CIBC Private Wealth Group, LLC | 7.122 | 0,00 | 74 | 12,31 | ||||
| 2025-08-14 | 13F | Millennium Management Llc | 720.074 | -39,83 | 7.438 | -44,46 | ||||
| 2025-08-08 | 13F | Hartland & Co., LLC | 0 | -100,00 | 0 | |||||
| 2025-04-30 | 13F | POM Investment Strategies, LLC | 0 | -100,00 | 0 | -100,00 | ||||
| 2025-08-12 | 13F | Proequities, Inc. | Put | 0 | 0 | |||||
| 2025-08-14 | 13F | Citadel Advisors Llc | Put | 22.900 | 116,04 | 237 | 100,00 | |||
| 2025-08-12 | 13F | Proequities, Inc. | Call | 0 | 0 | |||||
| 2025-08-14 | 13F | Two Sigma Advisers, Lp | 653.075 | -48,63 | 6.746 | -52,58 | ||||
| 2025-08-12 | 13F | Proequities, Inc. | 0 | 0 | ||||||
| 2025-08-14 | 13F | First Foundation Advisors | 12.393 | 0,00 | 128 | -7,25 | ||||
| 2025-07-31 | 13F | Optimum Investment Advisors | 17.500 | 0,00 | 181 | -7,69 | ||||
| 2025-07-31 | 13F | Sumitomo Mitsui Trust Holdings, Inc. | 81.236 | 57,27 | 839 | 45,16 | ||||
| 2025-06-25 | NP | VPC - Virtus Private Credit Strategy ETF | 90.483 | 1,15 | 915 | -8,69 | ||||
| 2025-08-14 | 13F | Citadel Advisors Llc | Call | 0 | -100,00 | 0 | ||||
| 2025-08-05 | 13F | Huntington National Bank | 0 | -100,00 | 0 | |||||
| 2025-08-14 | 13F | UBS Group AG | 1.117.647 | 81,73 | 11.545 | 67,76 | ||||
| 2025-07-17 | 13F | GraniteShares Advisors LLC | 255.250 | 6,67 | 2.637 | -1,53 | ||||
| 2025-08-12 | 13F | XTX Topco Ltd | 0 | -100,00 | 0 | |||||
| 2025-08-26 | NP | FTKI - First Trust Small Cap BuyWrite Income ETF | 0 | -100,00 | 0 | -100,00 | ||||
| 2025-07-16 | 13F | ORG Partners LLC | 1.500 | 0,00 | 16 | -6,25 | ||||
| 2025-08-11 | 13F | Hexagon Capital Partners LLC | 0 | -100,00 | 0 | |||||
| 2025-07-28 | NP | KBWD - Invesco KBW High Dividend Yield Financial ETF This fund is a listed as child fund of Invesco Ltd. and if that institution has disclosed ownership in this security, then these positions will not be double counted when calculating total shares and total value | 1.032.944 | 5,54 | 10.639 | -4,14 | ||||
| 2025-08-14 | 13F | Beacon Investment Advisors Llc | 19.886 | 1,36 | 204 | -7,31 | ||||
| 2025-08-27 | 13F/A | Squarepoint Ops LLC | 0 | -100,00 | 0 | -100,00 | ||||
| 2025-07-15 | 13F | Graypoint LLC | 75.302 | 2,96 | 778 | -5,01 | ||||
| 2025-07-09 | 13F | Westbourne Investments, Inc. | 19.175 | -5,59 | 198 | -12,78 | ||||
| 2025-07-24 | 13F | Us Bancorp \de\ | 4.000 | -0,12 | 41 | -6,82 | ||||
| 2025-08-29 | NP | GraniteShares ETF Trust - GraniteShares HIPS US High Income ETF | 255.250 | 6,67 | 2.637 | -1,53 | ||||
| 2025-08-13 | 13F | Natixis | 44.576 | 0,00 | 460 | -7,63 | ||||
| 2025-08-14 | 13F | Qube Research & Technologies Ltd | 798.816 | -20,27 | 8.252 | -26,40 | ||||
| 2025-08-12 | 13F | Jpmorgan Chase & Co | 51.706 | -41,10 | 534 | -45,62 | ||||
| 2025-07-25 | 13F | Cwm, Llc | 4.771 | 0 | ||||||
| 2025-07-31 | 13F | Cambridge Investment Research Advisors, Inc. | 78.176 | 32,39 | 1 | |||||
| 2025-08-15 | 13F | Morgan Stanley | 388.070 | -30,43 | 4.009 | -35,78 | ||||
| 2025-04-22 | 13F | Jmac Enterprises Llc | 0 | -100,00 | 0 | -100,00 | ||||
| 2025-07-31 | 13F | Caitong International Asset Management Co., Ltd | 177 | 17.600,00 | 2 | |||||
| 2025-08-13 | 13F | Invesco Ltd. | 1.076.310 | 2,52 | 11.118 | -5,35 | ||||
| 2025-08-14 | 13F | Jane Street Group, Llc | 0 | -100,00 | 0 | |||||
| 2025-08-14 | 13F | State Street Corp | 84.170 | 257,74 | 878 | 231,32 | ||||
| 2025-07-30 | 13F | Denali Advisors Llc | 69.103 | -2,61 | 714 | -10,09 | ||||
| 2025-07-24 | 13F | IFP Advisors, Inc | 3.434 | 3,00 | 35 | -5,41 | ||||
| 2025-08-05 | 13F | Simplex Trading, Llc | 30.528 | 2.375,91 | 0 | |||||
| 2025-08-08 | 13F | Cetera Investment Advisers | 63.704 | 2,13 | 658 | -5,60 | ||||
| 2025-08-05 | 13F | Simplex Trading, Llc | Put | 2.400 | 200,00 | 0 | ||||
| 2025-05-30 | NP | ERNZ - TrueShares Active Yield ETF | 310.616 | 735,71 | 3.476 | 755,91 | ||||
| 2025-08-01 | 13F | Envestnet Asset Management Inc | 36.933 | -1,67 | 382 | -9,29 | ||||
| 2025-08-06 | 13F | Wedbush Securities Inc | 139.202 | 5,04 | 1 | 0,00 | ||||
| 2025-05-01 | 13F | MQS Management LLC | 0 | -100,00 | 0 | -100,00 | ||||
| 2025-07-29 | 13F | Harbor Asset Planning, Inc. | 526 | 5 | ||||||
| 2025-08-12 | 13F | Legal & General Group Plc | 578.019 | 4,20 | 5.974 | -3,55 | ||||
| 2025-08-15 | 13F | CI Private Wealth, LLC | 53.747 | 247,00 | 555 | 220,81 | ||||
| 2025-08-14 | 13F | Quarry LP | 0 | -100,00 | 0 | |||||
| 2025-05-16 | 13F | Coppell Advisory Solutions LLC | 0 | -100,00 | 0 | |||||
| 2025-08-08 | 13F | Foundations Investment Advisors, LLC | 16.652 | 172 | ||||||
| 2025-04-24 | 13F | Mirae Asset Global Investments Co., Ltd. | 0 | -100,00 | 0 | -100,00 | ||||
| 2025-08-13 | 13F | Northwestern Mutual Wealth Management Co | 4.000 | 41 | ||||||
| 2025-08-15 | 13F | Great West Life Assurance Co /can/ | 86.588 | 3,37 | 1 | |||||
| 2025-08-14 | 13F | Two Sigma Investments, Lp | 942.801 | -45,81 | 9.739 | -49,97 | ||||
| 2025-07-31 | 13F | Sage Mountain Advisors LLC | 10.000 | 0,00 | 103 | -7,21 | ||||
| 2025-08-14 | 13F | Susquehanna International Group, Llp | Call | 0 | -100,00 | 0 | ||||
| 2025-08-14 | 13F | DRW Securities, LLC | 33.593 | 347 | ||||||
| 2025-08-14 | 13F | Susquehanna International Group, Llp | Put | 0 | -100,00 | 0 | ||||
| 2025-08-14 | 13F | Toroso Investments, LLC | 105.656 | 2,25 | 1.091 | -5,62 | ||||
| 2025-08-05 | 13F | Sigma Planning Corp | 10.439 | 0,53 | 108 | -7,76 | ||||
| 2025-05-12 | 13F | Connor, Clark & Lunn Investment Management Ltd. | 0 | -100,00 | 0 | -100,00 |
Other Listings
| GB:0KH0 | 10,20 USD |