Statistiche di base
| Proprietari istituzionali | 258 total, 258 long only, 0 short only, 0 long/short - change of 3,60% MRQ |
| Allocazione media del portafoglio | 0.2684 % - change of 50,49% MRQ |
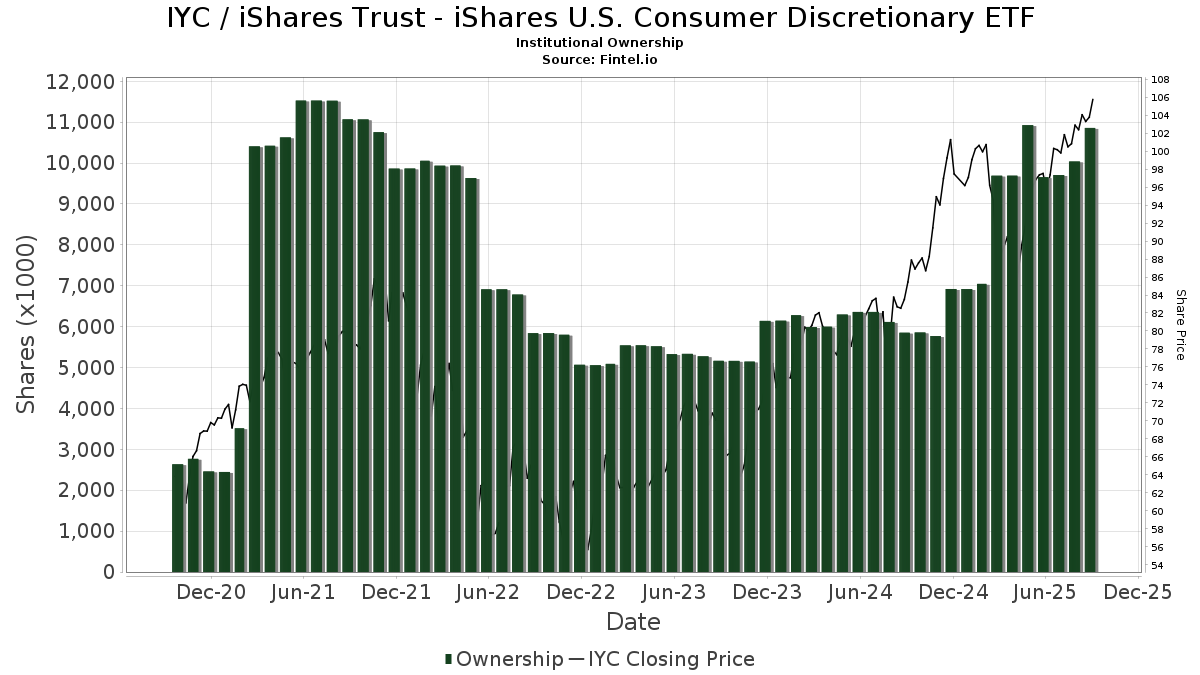
| Azioni istituzionali (Long) | 10.858.895 (ex 13D/G) - change of 1,20MM shares 12,43% MRQ |
| Valore istituzionale (Long) | $ 865.418 USD ($1000) |
Proprietà istituzionale e azionisti
iShares Trust - iShares U.S. Consumer Discretionary ETF (US:IYC) ha 258 proprietari istituzionali e azionisti che hanno presentato i moduli 13D/G o 13F alla Securities Exchange Commission (SEC). Queste istituzioni detengono un totale di 10,858,895 azioni. I maggiori azionisti includono Harel Insurance Investments & Financial Services Ltd., Morgan Stanley, Green Harvest Asset Management LLC, Bank Of America Corp /de/, UBS Group AG, Pinkerton Retirement Specialists, LLC, Mml Investors Services, Llc, Wells Fargo & Company/mn, Royal Bank Of Canada, and Raymond James Financial Inc .
(iShares Trust - iShares U.S. Consumer Discretionary ETF (ARCA:IYC) la struttura proprietaria istituzionale mostra le attuali posizioni nella società da parte di istituzioni e fondi, nonché le ultime variazioni nella dimensione della posizione. I principali azionisti possono essere singoli investitori, fondi comuni, hedge fund o istituzioni. L'allegato 13D indica che l'investitore detiene (o ha detenuto) più del 5% della società e intende (o intendeva) perseguire attivamente un cambiamento nella strategia aziendale. L'allegato 13G indica un investimento passivo superiore al 5%.
The share price as of September 4, 2025 is 104,75 / share. Previously, on September 5, 2024, the share price was 82,91 / share. This represents an increase of 26,34% over that period.
Indice del sentiment dei fondi
L'indice del sentiment dei fondi (anche noto come "indice di accumulo di proprietà") individua i titoli più acquistati dai fondi. È il risultato di un sofisticato modello quantitativo multi-fattore che identifica le società con i più alti livelli di accumulo istituzionale. Il modello utilizza una combinazione dell'aumento totale dei proprietari dichiarati, delle variazioni nelle allocazioni di portafoglio di tali proprietari e di altre metriche. Il punteggio varia da 0 a 100: i numeri più alti indicano un livello di accumulo superiore ad altre società, mentre 50 rappresenta la media.
Frequenza di aggiornamento: giornaliera
Consulta Ownership Explorer per visualizzare l'elenco delle aziende con il ranking più alto.
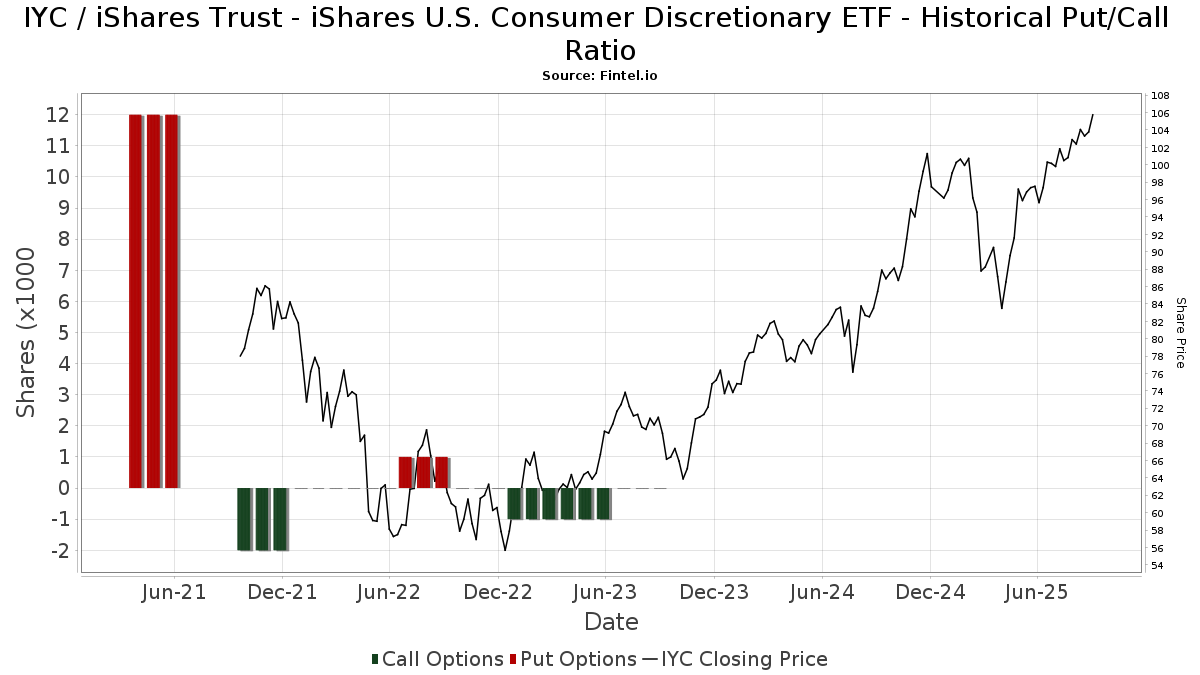
Rapporto put/call istituzionale
Oltre a segnalare le emissioni standard di titoli azionari e di debito, gli istituti con più di 100 milioni di asset in gestione devono anche dichiarare le loro partecipazioni in opzioni put e call. Poiché le opzioni put indicano generalmente un sentiment negativo e le opzioni call un sentiment positivo, possiamo avere un'idea del sentiment istituzionale complessivo attraverso il rapporto tra put e call. Il grafico a destra mostra il rapporto storico put/call per questo strumento.
L'utilizzo del rapporto put/call come indicatore del sentiment degli investitori consente di superare una delle principali lacune dell'utilizzo della proprietà istituzionale totale, ovvero il fatto che una quantità significativa di asset in gestione viene investita passivamente per seguire gli indici. Generalmente, i fondi a gestione passiva non acquistano opzioni, per cui il rapporto put/call riflette più fedelmente il sentiment dei fondi a gestione attiva.
Depositi 13D/G
Presentiamo i depositi 13D/G separatamente dai depositi 13F a causa del diverso trattamento da parte della SEC. I depositi 13D/G possono essere presentati da gruppi di investitori (con un unico leader), mentre i depositi 13F no. Ciò comporta situazioni in cui un investitore può depositare un documento 13D/G riportando un valore per il totale delle azioni (che rappresenta tutte le azioni possedute dal gruppo di investitori), e poi depositare un documento 13F riportando un valore diverso per il totale delle azioni (che rappresenta esclusivamente la propria proprietà). Ciò significa che la proprietà delle azioni nei depositi 13D/G e nei depositi 13F spesso non sono direttamente comparabili, pertanto le presentiamo separatamente.
Nota: a partire dal 16 maggio 2021, non mostriamo più i proprietari che non hanno depositato un documento 13D/G nellultimo anno. In precedenza, mostravamo lintero storico dei depositi 13D/G. In generale, le entità che sono tenute a depositare i documenti 13D/G devono farlo almeno una volta all'anno prima di presentare un deposito di chiusura. Tuttavia, a volte i fondi escono dalle posizioni senza presentare un deposito di chiusura (cioè, procedono a una liquidazione), per cui la visualizzazione dell'intero storico a volte generava confusione sull'attuale proprietà. Per evitare confusione, ora mostriamo solo i proprietari "attuali", ossia quelli che hanno effettuato un deposito nell'ultimo anno.
Upgrade to unlock premium data.
Depositi 13F e NPORT
Le informazioni relative ai depositi 13F sono gratuite. Per accedere alle informazioni relative ai depositi NP è necessario un'abbonamento premium. Le righe verdi indicano le nuove posizioni. Le righe rosse indicano le posizioni chiuse. Fai clic sull'icona del link per visualizzare la cronologia completa delle transazioni.
Esegui l'upgrade
per sbloccare i dati premium ed esportarli in Excel ![]() .
.
| Data di deposito | Fonte | Investitore | Tipo | Prezzo medio (Stima) |
Azioni | Δ Azioni (%) |
Valore dichiarato ($ 1000) |
Δ Valore (%) |
Allocazione del portafoglio (%) |
|
|---|---|---|---|---|---|---|---|---|---|---|
| 2025-08-13 | 13F | Haverford Trust Co | 8.370 | 0,00 | 834 | 12,72 | ||||
| 2025-08-14 | 13F | EP Wealth Advisors, Inc. | 5.563 | 3,61 | 554 | 16,88 | ||||
| 2025-07-25 | 13F | Second Half Financial Partners, LLC | 0 | -100,00 | 0 | |||||
| 2025-07-16 | 13F | Advisors Management Group Inc /adv | 2.912 | 4,34 | 0 | |||||
| 2025-08-14 | 13F | D. E. Shaw & Co., Inc. | 4.658 | 68,89 | 464 | 90,95 | ||||
| 2025-08-18 | 13F/A | National Bank Of Canada /fi/ | 2.164 | -35,52 | 215 | -27,36 | ||||
| 2025-08-14 | 13F | Citadel Advisors Llc | 0 | -100,00 | 0 | |||||
| 2025-07-18 | 13F | USA Financial Portformulas Corp | 35.895 | 3.577 | ||||||
| 2025-07-30 | 13F | IMG Wealth Management, Inc. | 88 | 0,00 | 9 | 14,29 | ||||
| 2025-08-07 | 13F | Fountainhead AM, LLC | 2.193 | -62,79 | 219 | -58,08 | ||||
| 2025-07-28 | 13F | Patten & Patten Inc/tn | 7.732 | -1,65 | 770 | 10,95 | ||||
| 2025-07-30 | 13F | Canvas Wealth Advisors, LLC | 5.584 | 0,00 | 568 | 19,37 | ||||
| 2025-08-05 | 13F | Tiaa Trust, National Association | 4.260 | 0,00 | 424 | 12,77 | ||||
| 2025-04-22 | 13F | Synergy Financial Management, LLC | 0 | -100,00 | 0 | |||||
| 2025-08-06 | 13F | Simmons Bank | 12.050 | -1,95 | 1.201 | 10,60 | ||||
| 2025-07-22 | 13F | Beacon Financial Advisory LLC | 2.926 | 0,03 | 292 | 12,79 | ||||
| 2025-08-05 | 13F | Bank Of Montreal /can/ | 10.598 | 20,13 | 1.056 | 35,43 | ||||
| 2025-05-01 | 13F | WESPAC Advisors, LLC | 0 | -100,00 | 0 | |||||
| 2025-04-11 | 13F | Davis Capital Management | 348 | 0,00 | 31 | -9,09 | ||||
| 2025-08-04 | 13F | Spinnaker Trust | 13.928 | 0,00 | 1.388 | 12,76 | ||||
| 2025-08-12 | 13F | Pathstone Holdings, LLC | 0 | -100,00 | 0 | |||||
| 2025-05-12 | 13F | Americana Partners, LLC | 0 | -100,00 | 0 | |||||
| 2025-07-31 | 13F | Oppenheimer & Co Inc | 2.956 | 0,00 | 295 | 12,64 | ||||
| 2025-08-06 | 13F | Golden State Wealth Management, LLC | 143 | 0,00 | 14 | 16,67 | ||||
| 2025-08-11 | 13F | Private Advisor Group, LLC | 29.278 | 14,11 | 2.917 | 28,73 | ||||
| 2025-08-06 | 13F | Maltin Wealth Management, Inc. | 3.260 | 0,12 | 325 | 12,89 | ||||
| 2025-07-31 | 13F | Cambridge Investment Research Advisors, Inc. | 84.666 | 31,13 | 8 | 60,00 | ||||
| 2025-08-07 | 13F | Ibex Wealth Advisors | 8.957 | -14,79 | 892 | -3,88 | ||||
| 2025-08-14 | 13F | Ameriprise Financial Inc | 47.934 | -1,11 | 4.776 | 11,56 | ||||
| 2025-07-28 | 13F | Duncker Streett & Co Inc | 70 | 0,00 | 7 | 0,00 | ||||
| 2025-08-06 | 13F | Garrison Point Advisors, Llc | 13.870 | -2,05 | 1.382 | 10,56 | ||||
| 2025-07-22 | 13F | DAVENPORT & Co LLC | 14.426 | 18,94 | 1.437 | 34,17 | ||||
| 2025-08-13 | 13F | M&t Bank Corp | 6.001 | -30,89 | 598 | -22,06 | ||||
| 2025-05-14 | 13F | Hsbc Holdings Plc | 0 | -100,00 | 0 | |||||
| 2025-08-11 | 13F | GKV Capital Management Co., Inc. | 0 | -100,00 | 0 | |||||
| 2025-07-14 | 13F | U.S. Capital Wealth Advisors, LLC | 8.565 | -21,07 | 853 | -10,96 | ||||
| 2025-07-09 | 13F | Lifestyle Asset Management, Inc. | 10.004 | 997 | ||||||
| 2025-07-22 | 13F | Mascoma Wealth Management LLC | 1.000 | 0,00 | 100 | 12,50 | ||||
| 2025-05-14 | 13F | Snowden Capital Advisors LLC | 0 | -100,00 | 0 | |||||
| 2025-07-07 | 13F | Greenfield Savings Bank | 3.512 | 0,00 | 350 | 12,58 | ||||
| 2025-08-19 | 13F | Anchor Investment Management, LLC | 8.951 | -4,94 | 892 | 7,22 | ||||
| 2025-08-01 | 13F | Financial Counselors Inc | 0 | -100,00 | 0 | |||||
| 2025-08-05 | 13F | NewSquare Capital LLC | 36 | 4 | ||||||
| 2025-04-29 | 13F | Bank of New York Mellon Corp | 0 | -100,00 | 0 | -100,00 | ||||
| 2025-08-13 | 13F | Russell Investments Group, Ltd. | 28 | 3 | ||||||
| 2025-07-25 | 13F | Muirfield Wealth Advisors Llc | 6.307 | -12,15 | 628 | -0,95 | ||||
| 2025-08-06 | 13F | AE Wealth Management LLC | 49.247 | 32,41 | 4.907 | 49,35 | ||||
| 2025-08-12 | 13F | Holderness Investments Co | 2.632 | 0,04 | 262 | 12,93 | ||||
| 2025-07-10 | 13F | Wealth Enhancement Advisory Services, Llc | 2.801 | -7,89 | 282 | 5,22 | ||||
| 2025-07-24 | 13F | Ronald Blue Trust, Inc. | 375 | 0,00 | 37 | 12,12 | ||||
| 2025-08-12 | 13F | Park Square Financial Group, LLC | 72 | 0,00 | 7 | 16,67 | ||||
| 2025-08-12 | 13F | Founders Financial Alliance, LLC | 158 | -71,43 | 16 | -68,75 | ||||
| 2025-08-12 | 13F | O'shaughnessy Asset Management, Llc | 170 | 17 | ||||||
| 2025-08-15 | 13F | Morgan Stanley | 1.070.505 | 12,94 | 106.665 | 27,41 | ||||
| 2025-07-30 | 13F | Financial Perspectives, Inc | 760 | 0,00 | 76 | 11,94 | ||||
| 2025-08-14 | 13F | Susquehanna International Group, Llp | 0 | -100,00 | 0 | |||||
| 2025-07-10 | 13F | Global Financial Private Client, LLC | 0 | -100,00 | 0 | |||||
| 2025-07-17 | 13F | LexAurum Advisors, LLC | 2.899 | 2,22 | 289 | 15,20 | ||||
| 2025-07-30 | 13F | WESPAC Advisors SoCal, LLC | 9.904 | -65,57 | 987 | -61,18 | ||||
| 2025-07-23 | 13F | Prime Capital Investment Advisors, LLC | 5.580 | -35,28 | 556 | -26,94 | ||||
| 2025-08-07 | 13F | Samalin Investment Counsel, LLC | 3.883 | 1,86 | 387 | 14,88 | ||||
| 2025-08-12 | 13F | Pettyjohn, Wood & White, Inc | 5.500 | 0,00 | 548 | 12,99 | ||||
| 2025-08-19 | 13F | National Asset Management, Inc. | 3.264 | -36,01 | 325 | -33,67 | ||||
| 2025-08-14 | 13F | Goldman Sachs Group Inc | 112.178 | 26,12 | 11.177 | 42,27 | ||||
| 2025-08-08 | 13F | MTM Investment Management, LLC | 884 | 0,00 | 88 | 12,82 | ||||
| 2025-07-25 | 13F | Cwm, Llc | 6.812 | -0,80 | 1 | |||||
| 2025-07-16 | 13F | Minichmacgregor Wealth Management, Llc | 191.409 | 12,11 | 19.072 | 26,47 | ||||
| 2025-08-04 | 13F | Pinnacle Associates Ltd | 2.600 | 0,00 | 259 | 13,10 | ||||
| 2025-08-14 | 13F | Aqr Capital Management Llc | 2.688 | 268 | ||||||
| 2025-07-17 | 13F | Janney Montgomery Scott LLC | 5.717 | 0,32 | 1 | |||||
| 2025-08-05 | 13F | Huntington National Bank | 1.340 | 43,67 | ||||||
| 2025-08-14 | 13F | Stifel Financial Corp | 159.492 | 8,70 | 15.894 | 22,62 | ||||
| 2025-08-14 | 13F | Mariner, LLC | 33.137 | 166,72 | 3.302 | 200,91 | ||||
| 2025-07-28 | 13F | Hudson Capital Management LLC | 2.665 | 266 | ||||||
| 2025-05-12 | 13F | Simplex Trading, Llc | 0 | -100,00 | 0 | |||||
| 2025-08-12 | 13F | Proequities, Inc. | 0 | 0 | ||||||
| 2025-08-08 | 13F | Citizens Financial Group Inc/ri | 4.909 | 0,00 | 489 | 12,93 | ||||
| 2025-08-12 | 13F | Gladstone Institutional Advisory LLC | 4.492 | 73,64 | 448 | 96,05 | ||||
| 2025-07-15 | 13F | Well Done, LLC | 58.871 | 5.866 | ||||||
| 2025-08-07 | 13F | Allworth Financial LP | 1.180 | 0,00 | 118 | 12,50 | ||||
| 2025-07-24 | 13F | Blair William & Co/il | 5.433 | -0,80 | 541 | 12,01 | ||||
| 2025-08-06 | 13F | Moors & Cabot, Inc. | 6.408 | -81,69 | 638 | 1.578,95 | ||||
| 2025-08-06 | 13F | Commonwealth Equity Services, Llc | 70.143 | -2,10 | 7 | 0,00 | ||||
| 2025-08-14 | 13F | Sunbelt Securities, Inc. | 15.589 | -6,53 | 1.499 | 1,70 | ||||
| 2025-08-14 | 13F | UBS Group AG | 537.662 | -3,68 | 53.573 | 8,66 | ||||
| 2025-08-14 | 13F | Tudor Financial Inc. | 0 | -100,00 | 0 | |||||
| 2025-07-29 | 13F | Balboa Wealth Partners | 26.599 | 2.650 | ||||||
| 2025-07-17 | 13F/A | Capital Investment Advisors, LLC | 9.408 | 0,01 | 937 | 12,89 | ||||
| 2025-08-08 | 13F | Family Firm, Inc. | 0 | -100,00 | 0 | |||||
| 2025-08-15 | 13F | SkyView Investment Advisors, LLC | 0 | -100,00 | 0 | |||||
| 2025-07-16 | 13F | Dakota Wealth Management | 3.604 | 0,00 | 359 | 12,89 | ||||
| 2025-08-11 | 13F | TD Waterhouse Canada Inc. | 300 | 0,00 | 30 | 11,54 | ||||
| 2025-05-02 | 13F | Apollon Wealth Management, LLC | 0 | -100,00 | 0 | |||||
| 2025-07-16 | 13F | Southern Capital Advisors, Llc | 41.887 | 1,16 | 4.174 | 14,11 | ||||
| 2025-08-15 | 13F | CI Private Wealth, LLC | 20.814 | -23,49 | 2.074 | -13,70 | ||||
| 2025-08-19 | 13F | Advisory Services Network, LLC | 119.013 | -6,78 | 11.899 | 5,52 | ||||
| 2025-05-06 | 13F | Navellier & Associates Inc | 0 | -100,00 | 0 | |||||
| 2025-08-15 | 13F | Captrust Financial Advisors | 2.429 | -98,34 | 242 | -98,13 | ||||
| 2025-07-16 | 13F | West Branch Capital LLC | 68 | 0,00 | 7 | 0,00 | ||||
| 2025-08-01 | 13F | Gwn Securities Inc. | 0 | -100,00 | 0 | |||||
| 2025-08-13 | 13F | Marshall Wace, Llp | 2.594 | 258 | ||||||
| 2025-08-14 | 13F | Betterment LLC | 2.171 | 0 | ||||||
| 2025-08-14 | 13F | Wells Fargo & Company/mn | 334.853 | -10,23 | 33.365 | 1,27 | ||||
| 2025-05-07 | 13F | Norden Group Llc | 0 | -100,00 | 0 | |||||
| 2025-07-23 | 13F | West Paces Advisors Inc. | 422 | 100,95 | 42 | 133,33 | ||||
| 2025-07-28 | 13F | Harbour Investments, Inc. | 3.907 | 593,96 | 389 | 693,88 | ||||
| 2025-08-14 | 13F | Fmr Llc | 12.681 | 10,98 | 1.264 | 25,17 | ||||
| 2025-08-01 | 13F | Advisory Alpha, LLC | 2.187 | 218 | ||||||
| 2025-04-24 | 13F | Wright Fund Managment, LLC | 0 | -100,00 | 0 | |||||
| 2025-08-14 | 13F | Smartleaf Asset Management LLC | 18.989 | 22,22 | 1.891 | 38,26 | ||||
| 2025-04-28 | 13F | Clear Creek Financial Management, LLC | 0 | -100,00 | 0 | |||||
| 2025-07-17 | 13F | Patton Albertson Miller Group, Llc | 12.112 | 0,00 | 1.207 | 12,82 | ||||
| 2025-08-07 | 13F | Kestra Private Wealth Services, Llc | 2.350 | -35,86 | 234 | -27,55 | ||||
| 2025-08-14 | 13F | Bank Of America Corp /de/ | 853.831 | 9,09 | 85.076 | 23,06 | ||||
| 2025-08-04 | 13F | Spire Wealth Management | 0 | -100,00 | 0 | |||||
| 2025-07-23 | 13F | 1 North Wealth Services Llc | 615 | -34,22 | 61 | -25,61 | ||||
| 2025-08-14 | 13F | Wiley Bros.-aintree Capital, Llc | 10.066 | -3,92 | 1.003 | 8,68 | ||||
| 2025-05-09 | 13F | L & S Advisors Inc | 0 | -100,00 | 0 | |||||
| 2025-08-11 | 13F | Greykasell Wealth Strategies, Inc. | 2.896 | 0,00 | 289 | 12,94 | ||||
| 2025-08-14 | 13F | Mercer Global Advisors Inc /adv | 2.750 | 2,61 | 274 | 16,10 | ||||
| 2025-08-14 | 13F | Vivaldi Capital Management, LLC | 5.377 | 7,82 | 536 | 21,59 | ||||
| 2025-05-12 | 13F | Sandy Spring Bank | 1.660 | 0,00 | 147 | -8,18 | ||||
| 2025-08-13 | 13F | Continuum Advisory, LLC | 0 | -100,00 | 0 | |||||
| 2025-08-29 | 13F | Centaurus Financial, Inc. | 8.705 | 127,34 | 1 | |||||
| 2025-07-08 | 13F | Nbc Securities, Inc. | 200 | 0,00 | 0 | |||||
| 2025-08-12 | 13F | MAI Capital Management | 2.961 | -14,96 | 295 | -3,91 | ||||
| 2025-08-07 | 13F | Summit X, LLC | 4.821 | -3,70 | 480 | 8,60 | ||||
| 2025-08-14 | 13F | Essential Planning, LLC. | 2.160 | -10,00 | 215 | 1,90 | ||||
| 2025-04-29 | 13F | Resources Investment Advisors, LLC. | 0 | -100,00 | 0 | -100,00 | ||||
| 2025-07-24 | 13F | IFP Advisors, Inc | 2.216 | 0,82 | 221 | 13,40 | ||||
| 2025-08-08 | 13F | Hartland & Co., LLC | 655 | 0,00 | 65 | 14,04 | ||||
| 2025-08-15 | 13F | Kestra Advisory Services, LLC | 18.711 | 403,12 | 1.864 | 468,29 | ||||
| 2025-08-06 | 13F | Prospera Financial Services Inc | 127.384 | -38,06 | 12.693 | -30,12 | ||||
| 2025-08-13 | 13F | Virtue Capital Management, LLC | 11.688 | 24,34 | 1.165 | 40,24 | ||||
| 2025-07-29 | 13F | Koshinski Asset Management, Inc. | 11.145 | 0,01 | 1.111 | 12,80 | ||||
| 2025-08-18 | 13F | Front Row Advisors LLC | 1.390 | -24,86 | 138 | -15,34 | ||||
| 2025-05-02 | 13F | Fortis Group Advisors, LLC | 0 | -100,00 | 0 | |||||
| 2025-04-04 | 13F | Three Seasons Wealth, LLC | 0 | -100,00 | 0 | -100,00 | ||||
| 2025-08-14 | 13F | Mml Investors Services, Llc | 343.195 | 35,15 | 34 | 54,55 | ||||
| 2025-08-04 | 13F | AMG National Trust Bank | 12.452 | -0,40 | 1.241 | 12,32 | ||||
| 2025-08-14 | 13F | Glenview Trust Co | 3.158 | -40,59 | 315 | -33,05 | ||||
| 2025-07-29 | 13F | Signature Estate & Investment Advisors Llc | 6.317 | 0,14 | 629 | 12,93 | ||||
| 2025-07-30 | 13F | Clifford Swan Investment Counsel Llc | 4.000 | 0,00 | 399 | 12,75 | ||||
| 2025-07-25 | 13F | Genesee Capital Advisors, LLC | 14.396 | 65,03 | 1.434 | 86,23 | ||||
| 2025-07-29 | 13F | Stephens Inc /ar/ | 2.868 | 0,00 | 286 | 12,65 | ||||
| 2025-07-23 | 13F | Sax Wealth Advisors, Llc | 2.124 | 212 | ||||||
| 2025-07-30 | 13F | Cookson Peirce & Co Inc | 6.146 | -4,24 | 612 | 8,13 | ||||
| 2025-07-21 | 13F | Ameritas Advisory Services, LLC | 684 | 68 | ||||||
| 2025-07-24 | 13F | Wealthstar Advisors, Llc | 19.219 | 1.915 | ||||||
| 2025-08-01 | 13F | Zhang Financial LLC | 2.734 | 272 | ||||||
| 2025-07-02 | 13F | Central Pacific Bank - Trust Division | 81 | 0,00 | 8 | 14,29 | ||||
| 2025-04-30 | 13F | Moloney Securities Asset Management, LLC | 0 | -100,00 | 0 | |||||
| 2025-08-13 | 13F | VestGen Advisors, LLC | 23.124 | 10,61 | 2.304 | 24,81 | ||||
| 2025-06-30 | NP | Two Roads Shared Trust - Anfield U.S. Equity Sector Rotation ETF | 49.467 | 4.430 | ||||||
| 2025-08-14 | 13F | CoreCap Advisors, LLC | 5.843 | 15,63 | 582 | 30,49 | ||||
| 2025-05-12 | 13F | Townsquare Capital Llc | 0 | -100,00 | 0 | |||||
| 2025-09-04 | 13F/A | Advisor Group Holdings, Inc. | 150.149 | 1,39 | 14.961 | 14,38 | ||||
| 2025-07-08 | 13F | Arlington Trust Co LLC | 175 | 0,00 | 17 | 13,33 | ||||
| 2025-07-16 | 13F | Cadent Capital Advisors, LLC | 49.157 | 1,04 | 4.898 | 13,99 | ||||
| 2025-08-01 | 13F | Planning Directions Inc | 4.233 | 0,14 | 422 | 12,87 | ||||
| 2025-08-14 | 13F | Hrt Financial Lp | 0 | -100,00 | 0 | |||||
| 2025-08-14 | 13F | Zurich Insurance Group Ltd/FI | 40.500 | 4.059 | ||||||
| 2025-07-21 | 13F | Pflug Koory, LLC | 136 | 0,00 | 14 | 8,33 | ||||
| 2025-08-11 | 13F | Rothschild Investment Llc | 150 | 0,00 | 15 | 7,69 | ||||
| 2025-08-14 | 13F | Fwl Investment Management, Llc | 400 | 0,00 | 40 | 11,43 | ||||
| 2025-08-12 | 13F | Global Retirement Partners, LLC | 2.710 | 284,94 | 270 | 302,99 | ||||
| 2025-08-27 | 13F/A | Brinker Capital Investments, LLC | 4.595 | 458 | ||||||
| 2025-07-17 | 13F | Global Trust Asset Management, LLC | 0 | -100,00 | 0 | |||||
| 2025-08-12 | 13F | Jpmorgan Chase & Co | 28.568 | -64,00 | 2.847 | -59,40 | ||||
| 2025-08-14 | 13F | KKM Financial LLC | 9.693 | -8,20 | 966 | 3,54 | ||||
| 2025-05-01 | 13F | Coastal Investment Advisors, Inc. | 0 | -100,00 | 0 | |||||
| 2025-08-04 | 13F | Adell Harriman & Carpenter Inc | 5.560 | 0,00 | 554 | 12,63 | ||||
| 2025-08-14 | 13F | MGB Wealth Management, LLC | 1.936 | 0,00 | 193 | 12,94 | ||||
| 2025-07-14 | 13F | AdvisorNet Financial, Inc | 12.337 | -1,41 | 1.229 | 11,22 | ||||
| 2025-05-09 | 13F | J. Safra Sarasin Holding AG | 0 | -100,00 | 0 | |||||
| 2025-08-14 | 13F | Raymond James Financial Inc | 229.648 | 10,40 | 22.882 | 24,55 | ||||
| 2025-07-28 | 13F | Chesapeake Wealth Management | 3.220 | -6,12 | 321 | 5,96 | ||||
| 2025-08-01 | 13F | Envestnet Asset Management Inc | 54.465 | 41,27 | 5.427 | 59,35 | ||||
| 2025-08-15 | 13F | Cooksen Wealth, LLC | 21 | -93,84 | 2 | -92,59 | ||||
| 2025-07-23 | 13F | Independent Solutions Wealth Management, LLC | 2.786 | 9,77 | 278 | 23,66 | ||||
| 2025-08-05 | 13F | Optivise Advisory Services LLC | 13.034 | 0,00 | 1.299 | 12,77 | ||||
| 2025-08-08 | 13F | Pnc Financial Services Group, Inc. | 3.714 | -4,25 | 370 | 8,19 | ||||
| 2025-08-11 | 13F | Citigroup Inc | 6.505 | -42,13 | 648 | -34,68 | ||||
| 2025-07-29 | 13F | Private Trust Co Na | 352 | 0,00 | 35 | 12,90 | ||||
| 2025-07-15 | 13F | Eaton Financial Holdings Company, LLC | 30.083 | 0,00 | 2.997 | 12,80 | ||||
| 2025-08-18 | 13F | Geneos Wealth Management Inc. | 4.680 | 200,00 | 466 | 240,15 | ||||
| 2025-07-25 | 13F | Concurrent Investment Advisors, LLC | 5.723 | 29,57 | 570 | 46,15 | ||||
| 2025-08-12 | 13F | CIBC Private Wealth Group, LLC | 928 | -53,32 | 92 | -41,40 | ||||
| 2025-07-29 | 13F | Cottonwood Capital Advisors, Llc | 24.815 | -1,07 | 2.473 | 11,60 | ||||
| 2025-08-11 | 13F | Principal Securities, Inc. | 38.049 | 393,31 | 3.791 | 411,61 | ||||
| 2025-05-05 | 13F | Diversify Advisory Services, LLC | 0 | -100,00 | 0 | |||||
| 2025-08-04 | 13F | Eubel Brady & Suttman Asset Management Inc | 4.000 | 0,00 | 0 | |||||
| 2025-08-14 | 13F | Bnp Paribas Arbitrage, Sa | 51.400 | -48,96 | 5.121 | -42,42 | ||||
| 2025-08-14 | 13F | Royal Bank Of Canada | 261.507 | 1,20 | 26.056 | 14,16 | ||||
| 2025-08-06 | 13F | Csenge Advisory Group | 3.886 | 7,38 | 376 | 22,95 | ||||
| 2025-08-08 | 13F | Cetera Investment Advisers | 44.848 | 230,96 | 4.469 | 273,58 | ||||
| 2025-08-08 | 13F | Capital Investment Advisory Services, LLC | 1.260 | 0,16 | 126 | 12,61 | ||||
| 2025-05-07 | 13F | Vista Private Wealth Partners. LLC | 0 | -100,00 | 0 | |||||
| 2025-07-18 | 13F | TruNorth Capital Management, LLC | 0 | -100,00 | 0 | |||||
| 2025-07-14 | 13F | Whitener Capital Management, Inc. | 11.508 | -3,74 | 1.147 | 8,63 | ||||
| 2025-08-06 | 13F | Rps Advisory Solutions Llc | 2.062 | 205 | ||||||
| 2025-07-09 | 13F | Summit Financial Consulting LLC | 58.273 | -3,42 | 5.806 | 8,95 | ||||
| 2025-08-14 | 13F | Quantinno Capital Management LP | 7.794 | 23,24 | 777 | 39,07 | ||||
| 2025-07-17 | 13F | Tritonpoint Wealth, Llc | 21.301 | -4,36 | 2.122 | 7,88 | ||||
| 2025-07-10 | 13F | Focus Financial Network, Inc. | 2.942 | 4,62 | 293 | 18,15 | ||||
| 2025-07-10 | 13F | Ferguson Wellman Capital Management, Inc | 57.089 | -2,67 | 5.688 | 9,81 | ||||
| 2025-07-17 | 13F | Sound Income Strategies, LLC | 50 | -86,23 | 5 | -84,37 | ||||
| 2025-08-15 | 13F | Equitable Holdings, Inc. | 30.551 | 161,88 | 3.044 | 195,53 | ||||
| 2025-08-08 | 13F | Foundations Investment Advisors, LLC | 199.897 | 5,40 | 19.918 | 18,91 | ||||
| 2025-07-28 | 13F | Harbour Trust & Investment Management Co | 2.056 | 205 | ||||||
| 2025-05-15 | 13F | Lido Advisors, LLC | 0 | -100,00 | 0 | -100,00 | ||||
| 2025-08-12 | 13F | Wealthbridge Capital Management, Llc | 4.980 | -14,43 | 496 | -3,50 | ||||
| 2025-07-18 | 13F | Truist Financial Corp | 13.358 | -10,04 | 1.331 | 1,45 | ||||
| 2025-08-11 | 13F | HighTower Advisors, LLC | 14.012 | 2,11 | 1.396 | 15,18 | ||||
| 2025-07-18 | 13F | SOA Wealth Advisors, LLC. | 497 | 0,20 | 50 | 13,95 | ||||
| 2025-07-10 | 13F | Piscataqua Savings Bank | 40 | 0,00 | 4 | 0,00 | ||||
| 2025-08-13 | 13F | Pinkerton Retirement Specialists, LLC | 344.097 | 34.286 | ||||||
| 2025-08-26 | 13F/A | Thrivent Financial For Lutherans | 23.202 | 37,46 | 2 | 100,00 | ||||
| 2025-08-05 | 13F | Harel Insurance Investments & Financial Services Ltd. | 1.593.101 | 21,02 | 159 | 36,21 | ||||
| 2025-08-13 | 13F | Baird Financial Group, Inc. | 2.864 | -17,77 | 285 | -7,17 | ||||
| 2025-08-13 | 13F | Jones Financial Companies Lllp | 14.949 | 25,38 | 1.488 | 41,85 | ||||
| 2025-08-13 | 13F | Northwestern Mutual Wealth Management Co | 39.641 | 4,27 | 3.950 | 17,60 | ||||
| 2025-08-13 | 13F | Colonial Trust Advisors | 255 | 0,00 | 25 | 13,64 | ||||
| 2025-07-25 | 13F | SPC Financial, Inc. | 184.343 | 0,70 | 18.368 | 13,60 | ||||
| 2025-07-18 | 13F | Trust Co Of Vermont | 0 | -100,00 | 0 | |||||
| 2025-08-06 | 13F | Atlantic Union Bankshares Corp | 1.660 | 165 | ||||||
| 2025-08-11 | 13F | Ritter Daniher Financial Advisory LLC / DE | 190 | 0,00 | 19 | 12,50 | ||||
| 2025-08-14 | 13F | Jane Street Group, Llc | 28.030 | 71,83 | 2.793 | 93,89 | ||||
| 2025-08-07 | 13F | Midwest Trust Co | 3.560 | 355 | ||||||
| 2025-04-08 | 13F | Parallel Advisors, LLC | 0 | -100,00 | 0 | |||||
| 2025-07-30 | 13F | Gimbal Financial | 156.124 | 15.556 | ||||||
| 2025-08-08 | 13F | Gts Securities Llc | 4.083 | -73,21 | 407 | -69,84 | ||||
| 2025-07-30 | 13F | Whittier Trust Co Of Nevada Inc | 5.520 | 0,00 | 550 | 12,94 | ||||
| 2025-07-11 | 13F | Farther Finance Advisors, LLC | 1.796 | -19,82 | 179 | -10,55 | ||||
| 2025-07-30 | 13F | Brookstone Capital Management | 3.919 | -33,64 | 390 | -25,14 | ||||
| 2025-08-14 | 13F | Camarda Financial Advisors, LLC | 137.272 | 13.678 | ||||||
| 2025-04-30 | 13F | Sofos Investments, Inc. | 204 | -29,17 | 18 | -21,74 | ||||
| 2025-08-08 | 13F | Creative Planning | 9.261 | 3,95 | 923 | 17,30 | ||||
| 2025-08-13 | 13F | Flow Traders U.s. Llc | 0 | -100,00 | 0 | |||||
| 2025-07-30 | 13F | Sonata Capital Group Inc | 6.596 | 0,00 | 1 | |||||
| 2025-08-12 | 13F | BlackRock, Inc. | 27.606 | -41,23 | 2.751 | -33,70 | ||||
| 2025-08-13 | 13F | AMJ Financial Wealth Management | 3.443 | 7,39 | 343 | 21,20 | ||||
| 2025-08-04 | 13F | Buck Wealth Strategies, LLC | 10.163 | 52,92 | 1.013 | 72,40 | ||||
| 2025-08-05 | 13F | Transatlantique Private Wealth Llc | 32.653 | 7,08 | 3.254 | 20,79 | ||||
| 2025-07-18 | 13F | Bartlett & Co. Wealth Management Llc | 6.680 | 0,00 | 666 | 12,71 | ||||
| 2025-08-12 | 13F | AlphaCore Capital LLC | 11 | 0,00 | 1 | |||||
| 2025-08-15 | 13F | Tower Research Capital LLC (TRC) | 0 | -100,00 | 0 | |||||
| 2025-07-11 | 13F | Spence Asset Management | 11.879 | 10,25 | 1 | |||||
| 2025-07-30 | 13F | Wbh Advisory Inc | 0 | -100,00 | 0 | |||||
| 2025-08-06 | 13F | SOUTH STATE Corp | 320 | 0,00 | 32 | 10,71 | ||||
| 2025-08-14 | 13F | Quartz Partners, LLC | 2.228 | 222 | ||||||
| 2025-08-05 | 13F | Allstate Corp | 3.850 | 384 | ||||||
| 2025-08-07 | 13F | CENTRAL TRUST Co | 200 | 0,00 | 20 | 11,76 | ||||
| 2025-05-12 | 13F | FIL Ltd | 0 | -100,00 | 0 | |||||
| 2025-05-16 | 13F | Laidlaw Wealth Management LLC | 0 | -100,00 | 0 | |||||
| 2025-08-13 | 13F | Cresset Asset Management, LLC | 3.584 | 0,00 | 357 | 12,97 | ||||
| 2025-08-14 | 13F | Federation des caisses Desjardins du Quebec | 0 | -100,00 | 0 | |||||
| 2025-08-04 | 13F | Migdal Insurance & Financial Holdings Ltd. | 2.331 | -11,70 | 0 | |||||
| 2025-08-15 | 13F | Blue Chip Partners, Inc. | 2.205 | 220 | ||||||
| 2025-07-14 | 13F | Argentarii, LLC | 2.400 | 0,00 | 239 | 13,27 | ||||
| 2025-07-23 | 13F | Tyche Wealth Partners LLC | 2.321 | 0,04 | 231 | 13,24 | ||||
| 2025-08-13 | 13F | Quadrature Capital Ltd | 0 | -100,00 | 0 | |||||
| 2025-08-11 | 13F | Strategic Wealth Partners, Ltd. | 4.878 | 16,78 | 486 | 15,44 | ||||
| 2025-08-12 | 13F | LPL Financial LLC | 215.011 | 16,13 | 21.424 | 31,01 | ||||
| 2025-07-21 | 13F | Yeomans Consulting Group, Inc. | 10.240 | 1.023 | ||||||
| 2025-04-24 | 13F | First Merchants Corp | 0 | -100,00 | 0 | |||||
| 2025-08-13 | 13F | Renaissance Technologies Llc | 2.600 | 259 | ||||||
| 2025-08-12 | 13F | One Charles Private Wealth Services, LLC | 4.836 | -0,66 | 482 | 12,12 | ||||
| 2025-07-29 | 13F | Chevy Chase Trust Holdings, Inc. | 6.924 | 0,00 | 690 | 12,77 | ||||
| 2025-05-16 | 13F | Great Lakes Advisors, Llc | 0 | -100,00 | 0 | |||||
| 2025-08-12 | 13F | Sierra Summit Advisors Llc | 2.235 | 223 | ||||||
| 2025-07-29 | 13F | Chicago Partners Investment Group LLC | 3.001 | 0,13 | 306 | 11,31 | ||||
| 2025-07-16 | 13F | Stillwater Capital Advisors, LLC | 27.663 | -0,23 | 2.756 | 12,58 | ||||
| 2025-08-07 | 13F | Parkside Financial Bank & Trust | 661 | 535,58 | 66 | 622,22 | ||||
| 2025-08-14 | 13F | GWM Advisors LLC | 13.057 | -5,64 | 1.301 | 6,38 | ||||
| 2025-08-08 | 13F | Financial Gravity Companies, Inc. | 68 | -66,67 | 7 | -68,42 | ||||
| 2025-07-08 | 13F | Atlas Brown,Inc. | 2.515 | 0,16 | 251 | 13,12 | ||||
| 2025-08-05 | 13F | GPS Wealth Strategies Group, LLC | 1.931 | 0,10 | 192 | 12,94 | ||||
| 2025-08-13 | 13F | StoneX Group Inc. | 0 | -100,00 | 0 | -100,00 | ||||
| 2025-08-07 | 13F | Apeiron RIA LLC | 8.098 | 116,00 | 807 | 143,50 | ||||
| 2025-07-16 | 13F/A | CX Institutional | 165 | 243,75 | 0 | |||||
| 2025-08-06 | 13F | Stonebridge Financial Planning Group, LLC | 26.438 | -5,52 | 2.634 | 6,60 | ||||
| 2025-08-11 | 13F | Anfield Capital Management, LLC | 49.789 | -1,28 | 4.961 | 11,36 | ||||
| 2025-07-23 | 13F | Ameliora Wealth Management Ltd. | 11.000 | 0,00 | 1.096 | 12,87 | ||||
| 2025-07-28 | 13F | Private Wealth Asset Management, LLC | 2.400 | 0,00 | 239 | 13,27 | ||||
| 2025-07-15 | 13F | Patriot Investment Management Inc. | 4.853 | -7,08 | 484 | 4,77 | ||||
| 2025-07-07 | 13F | First Citizens Financial Corp | 51.740 | -13,28 | 5.155 | -2,16 | ||||
| 2025-08-14 | 13F | Comerica Bank | 7.607 | 0,11 | 758 | 12,82 | ||||
| 2025-07-17 | 13F | Lee Johnson Capital Management, Llc | 17.077 | 1.702 | ||||||
| 2025-08-08 | 13F | Symphony Financial Services, Inc. | 2.321 | 0,00 | 231 | 12,68 | ||||
| 2025-08-14 | 13F | Financial Engines Advisors L.L.C. | 3.331 | 332 | ||||||
| 2025-07-30 | 13F | Atlantic Edge Private Wealth Management, LLC | 580 | 0,00 | 58 | 11,76 | ||||
| 2025-08-04 | 13F | Atria Investments Llc | 8.765 | -1,73 | 873 | 10,93 | ||||
| 2025-04-02 | 13F/A | Picton Mahoney Asset Management | 0 | -100,00 | 0 | |||||
| 2025-07-28 | 13F | WJ Wealth Management, LLC | 3.880 | 0,00 | 387 | 12,87 | ||||
| 2025-04-25 | 13F | Westfuller Advisors, LLC | 0 | -100,00 | 0 | -100,00 | ||||
| 2025-07-15 | 13F | North Star Investment Management Corp. | 4.307 | 0,05 | 429 | 12,89 | ||||
| 2025-05-09 | 13F | Atria Wealth Solutions, Inc. | 0 | -100,00 | 0 | |||||
| 2025-08-11 | 13F | Bellwether Advisors, LLC | 1 | 0 | ||||||
| 2025-08-12 | 13F | Coldstream Capital Management Inc | 4.932 | 0,00 | 491 | 12,87 | ||||
| 2025-07-14 | 13F | Armstrong Advisory Group, Inc | 114 | 11 | ||||||
| 2025-07-23 | 13F | Lakeshore Capital Group, Inc. | 11.466 | -9,04 | 1.143 | 2,61 | ||||
| 2025-08-07 | 13F | Commerce Bank | 5.285 | 1,93 | 527 | 15,10 | ||||
| 2025-08-07 | 13F | Montag A & Associates Inc | 696 | 0,00 | 69 | 13,11 | ||||
| 2025-07-22 | 13F | Gsa Capital Partners Llp | 3.796 | 38,79 | 0 | |||||
| 2025-08-14 | 13F | Qube Research & Technologies Ltd | 58.146 | -15,58 | 5.794 | -4,77 | ||||
| 2025-07-28 | 13F | Mutual Advisors, LLC | 18.129 | 15,75 | 1.839 | 31,57 | ||||
| 2025-08-12 | 13F | Steward Partners Investment Advisory, Llc | 24.482 | 183,13 | 2.439 | 219,66 | ||||
| 2025-08-11 | 13F | United Capital Financial Advisers, Llc | 53.429 | 0,22 | 5.324 | 13,06 | ||||
| 2025-08-13 | 13F | Green Harvest Asset Management LLC | 1.027.290 | 5,45 | 102.359 | 18,96 | ||||
| 2025-08-26 | NP | Forethought Variable Insurance Trust - Global Atlantic BlackRock Selects Managed Risk Portfolio (formerly Global Atlantic BlackRock Global Allocation Managed Risk Portfolio) Global Atlantic BlackRock Global Allocation Managed Risk Portfolio | 27.286 | -38,39 | 2.719 | -30,50 | ||||
| 2025-08-19 | 13F | Newbridge Financial Services Group, Inc. | 155 | 15 | ||||||
| 2025-07-14 | 13F | Farmers & Merchants Investments Inc | 864 | 0,00 | 86 | 13,16 |