Statistiche di base
| Proprietari istituzionali | 127 total, 123 long only, 1 short only, 3 long/short - change of 2,40% MRQ |
| Allocazione media del portafoglio | 0.2807 % - change of 7,12% MRQ |
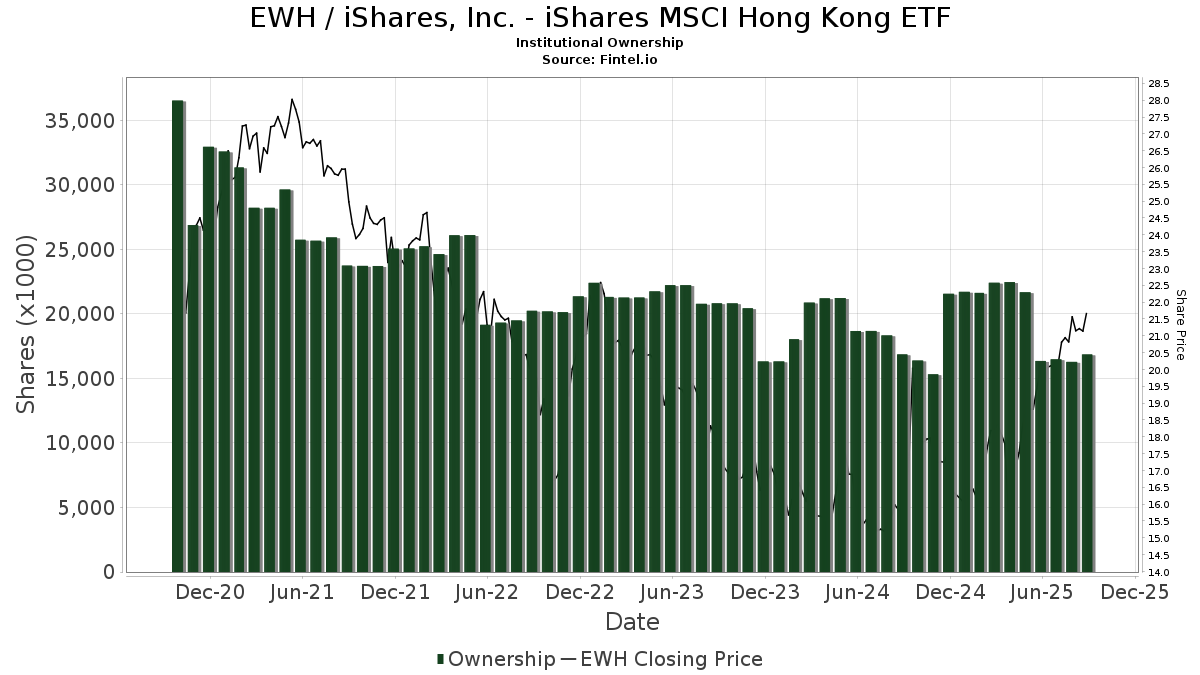
| Azioni istituzionali (Long) | 16.862.291 (ex 13D/G) - change of 0,51MM shares 3,09% MRQ |
| Valore istituzionale (Long) | $ 299.577 USD ($1000) |
Proprietà istituzionale e azionisti
iShares, Inc. - iShares MSCI Hong Kong ETF (US:EWH) ha 127 proprietari istituzionali e azionisti che hanno presentato i moduli 13D/G o 13F alla Securities Exchange Commission (SEC). Queste istituzioni detengono un totale di 16,862,291 azioni. I maggiori azionisti includono Wright Fund Managment, LLC, Morgan Stanley, Bank Julius Baer & Co. Ltd, Zurich, SG Americas Securities, LLC, D. E. Shaw & Co., Inc., Catalyst Capital Advisors LLC, MBXAX - Catalyst/Millburn Hedge Strategy Fund Class A, Millburn Ridgefield Corp, Northern Lights Fund Trust - Sierra Tactical Risk Spectrum 50 Fund Investor Class, and Quadrature Capital Ltd .
(iShares, Inc. - iShares MSCI Hong Kong ETF (ARCA:EWH) la struttura proprietaria istituzionale mostra le attuali posizioni nella società da parte di istituzioni e fondi, nonché le ultime variazioni nella dimensione della posizione. I principali azionisti possono essere singoli investitori, fondi comuni, hedge fund o istituzioni. L'allegato 13D indica che l'investitore detiene (o ha detenuto) più del 5% della società e intende (o intendeva) perseguire attivamente un cambiamento nella strategia aziendale. L'allegato 13G indica un investimento passivo superiore al 5%.
The share price as of September 5, 2025 is 21,18 / share. Previously, on September 6, 2024, the share price was 15,82 / share. This represents an increase of 33,88% over that period.
Indice del sentiment dei fondi
L'indice del sentiment dei fondi (anche noto come "indice di accumulo di proprietà") individua i titoli più acquistati dai fondi. È il risultato di un sofisticato modello quantitativo multi-fattore che identifica le società con i più alti livelli di accumulo istituzionale. Il modello utilizza una combinazione dell'aumento totale dei proprietari dichiarati, delle variazioni nelle allocazioni di portafoglio di tali proprietari e di altre metriche. Il punteggio varia da 0 a 100: i numeri più alti indicano un livello di accumulo superiore ad altre società, mentre 50 rappresenta la media.
Frequenza di aggiornamento: giornaliera
Consulta Ownership Explorer per visualizzare l'elenco delle aziende con il ranking più alto.
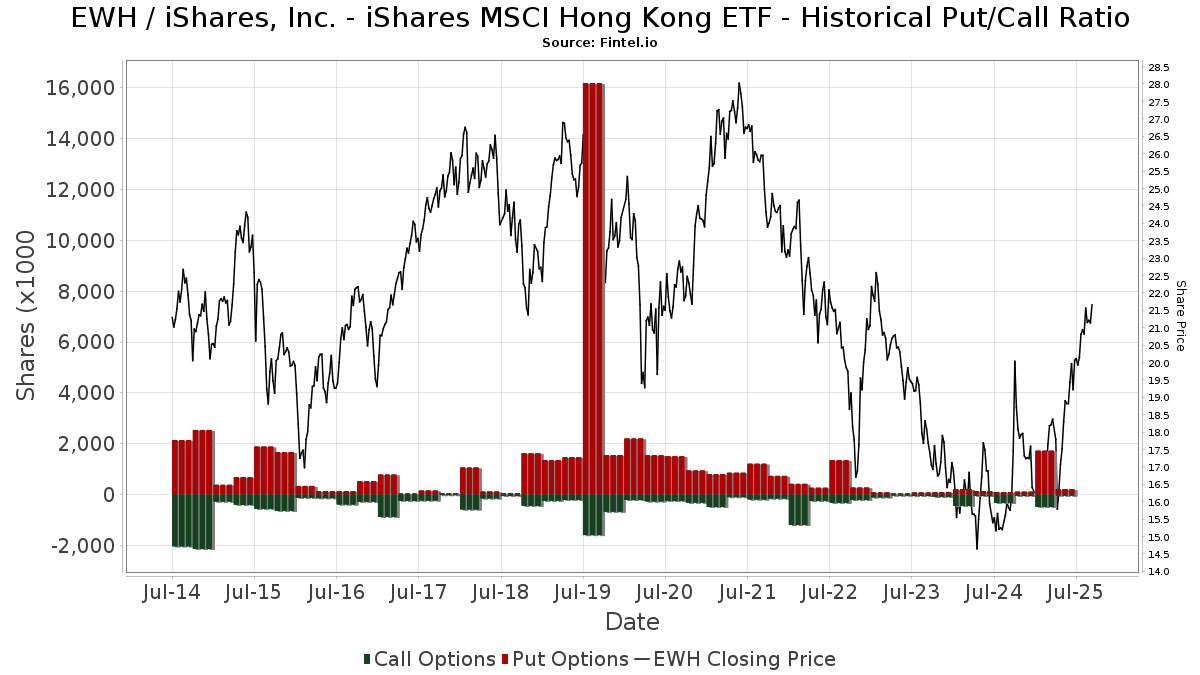
Rapporto put/call istituzionale
Oltre a segnalare le emissioni standard di titoli azionari e di debito, gli istituti con più di 100 milioni di asset in gestione devono anche dichiarare le loro partecipazioni in opzioni put e call. Poiché le opzioni put indicano generalmente un sentiment negativo e le opzioni call un sentiment positivo, possiamo avere un'idea del sentiment istituzionale complessivo attraverso il rapporto tra put e call. Il grafico a destra mostra il rapporto storico put/call per questo strumento.
L'utilizzo del rapporto put/call come indicatore del sentiment degli investitori consente di superare una delle principali lacune dell'utilizzo della proprietà istituzionale totale, ovvero il fatto che una quantità significativa di asset in gestione viene investita passivamente per seguire gli indici. Generalmente, i fondi a gestione passiva non acquistano opzioni, per cui il rapporto put/call riflette più fedelmente il sentiment dei fondi a gestione attiva.
Depositi 13F e NPORT
Le informazioni relative ai depositi 13F sono gratuite. Per accedere alle informazioni relative ai depositi NP è necessario un'abbonamento premium. Le righe verdi indicano le nuove posizioni. Le righe rosse indicano le posizioni chiuse. Fai clic sull'icona del link per visualizzare la cronologia completa delle transazioni.
Esegui l'upgrade
per sbloccare i dati premium ed esportarli in Excel ![]() .
.
| Data di deposito | Fonte | Investitore | Tipo | Prezzo medio (Stima) |
Azioni | Δ Azioni (%) |
Valore dichiarato ($ 1000) |
Δ Valore (%) |
Allocazione del portafoglio (%) |
|
|---|---|---|---|---|---|---|---|---|---|---|
| 2025-08-12 | 13F | MAI Capital Management | 208 | 1,96 | 4 | 33,33 | ||||
| 2025-07-08 | 13F | Parallel Advisors, LLC | 500 | 0,00 | 10 | 12,50 | ||||
| 2025-08-14 | 13F | SummitTX Capital, L.P. | 11.200 | 222 | ||||||
| 2025-08-14 | 13F | Wellington Management Group Llp | 54.028 | 243,62 | 1.073 | 289,82 | ||||
| 2025-08-13 | 13F | Barclays Plc | Put | 0 | -100,00 | 0 | ||||
| 2025-07-23 | 13F | Viewpoint Capital Management LLC | 6.241 | 0,00 | 124 | 12,84 | ||||
| 2025-08-14 | 13F | Ameriprise Financial Inc | 76.862 | -60,42 | 4.229 | 24,38 | ||||
| 2025-04-16 | 13F | Wealth Enhancement Advisory Services, Llc | Put | 0 | -100,00 | 0 | ||||
| 2025-08-12 | 13F | Zacks Investment Management | 21.664 | 430 | ||||||
| 2025-08-11 | 13F | Rahlfs Capital, Llc | 11.050 | 219 | ||||||
| 2025-07-10 | 13F | Wealth Enhancement Advisory Services, Llc | 15.937 | 0,31 | 321 | 15,47 | ||||
| 2025-08-14 | 13F | Fmr Llc | 5.916 | 8,91 | 117 | 23,16 | ||||
| 2025-08-13 | 13F | Scotia Capital Inc. | 16.352 | 325 | ||||||
| 2025-08-14 | 13F | Quantitative Investment Management, LLC | 59.004 | 1 | ||||||
| 2025-08-04 | 13F | JDM Financial Group LLC | 550 | 0,00 | 11 | 11,11 | ||||
| 2025-08-06 | 13F | Pekin Hardy Strauss, Inc. | 0 | -100,00 | 0 | |||||
| 2025-03-26 | NP | MNERX - MainStay Conservative ETF Allocation Fund Class R3 | 61.191 | 9,50 | 1.010 | 1,10 | ||||
| 2025-05-29 | NP | Northern Lights Fund Trust - Sierra Tactical Risk Spectrum 70 Fund Investor Class | 152.100 | 2.663 | ||||||
| 2025-08-13 | 13F | Korea Investment CORP | 132.000 | 0,00 | 2.622 | 13,41 | ||||
| 2025-07-21 | 13F | J. Safra Sarasin Holding AG | 0 | -100,00 | 0 | |||||
| 2025-07-31 | 13F | Wright Fund Managment, LLC | 1.407.375 | 0,00 | 24.643 | 0,00 | ||||
| 2025-08-12 | 13F | Elo Mutual Pension Insurance Co | 504.498 | 0,00 | 10.019 | 13,43 | ||||
| 2025-08-05 | 13F | Huntington National Bank | 0 | |||||||
| 2025-05-29 | NP | SIRAX - Sierra Tactical All Asset Fund Class A | 517.500 | 9.061 | ||||||
| 2025-07-29 | 13F | Tradewinds Capital Management, LLC | 102 | 0,00 | 2 | 100,00 | ||||
| 2025-07-31 | 13F | Glass Jacobson Investment Advisors llc | 1.925 | 0,00 | 38 | 18,75 | ||||
| 2025-08-14 | 13F/A | Bank Julius Baer & Co. Ltd, Zurich | 1.210.055 | 24.032 | ||||||
| 2025-07-22 | 13F | Chung Wu Investment Group, LLC | 8.500 | 169 | ||||||
| 2025-07-08 | 13F/A | Salem Investment Counselors Inc | 400 | 0,00 | 8 | 0,00 | ||||
| 2025-07-31 | 13F | Sharper & Granite LLC | 82.575 | -1,19 | 1.661 | 13,47 | ||||
| 2025-08-05 | 13F | Advisors Preferred, LLC | 1.411 | 28 | ||||||
| 2025-05-14 | 13F | Flow Traders U.s. Llc | 0 | -100,00 | 0 | |||||
| 2025-08-12 | 13F | CIBC Private Wealth Group, LLC | 0 | -100,00 | 0 | |||||
| 2025-08-14 | 13F | Federation des caisses Desjardins du Quebec | 144.176 | 3.780,92 | 2.863 | 4.373,44 | ||||
| 2025-08-13 | 13F | Mount Yale Investment Advisors, LLC | 138 | 3 | ||||||
| 2025-03-26 | NP | MWFQX - MainStay Equity ETF Allocation Fund Class R3 | 129.177 | 14,38 | 2.131 | 5,60 | ||||
| 2025-05-13 | 13F | HighTower Advisors, LLC | 0 | -100,00 | 0 | |||||
| 2025-05-02 | 13F | Whittier Trust Co | 0 | -100,00 | 0 | |||||
| 2025-08-14 | 13F | UBS Group AG | 428.667 | -45,34 | 8.513 | -38,01 | ||||
| 2025-07-07 | 13F | Upper Left Wealth Management, LLC | 14.066 | 2,55 | 279 | 16,25 | ||||
| 2025-04-22 | 13F | Cambridge Investment Research Advisors, Inc. | 0 | -100,00 | 0 | |||||
| 2025-07-30 | 13F | Exencial Wealth Advisors, Llc | 46.936 | 6,80 | 932 | 21,20 | ||||
| 2025-08-13 | 13F | Provida Pension Fund Administrator | 0 | -100,00 | 0 | -100,00 | ||||
| 2025-07-31 | 13F | Catalyst Capital Advisors LLC | 646.987 | -12,03 | 12.849 | -0,23 | ||||
| 2025-08-29 | NP | MBXAX - Catalyst/Millburn Hedge Strategy Fund Class A | 646.987 | -12,03 | 12.849 | -0,23 | ||||
| 2025-08-29 | NP | CGHIX - Timber Point Global Allocations Fund Institutional Class Shares | 10.000 | -50,00 | 199 | -43,43 | ||||
| 2025-08-15 | 13F | Morgan Stanley | 1.212.315 | -14,04 | 24.077 | -2,51 | ||||
| 2025-08-12 | 13F | Picton Mahoney Asset Management | 5.970 | -21,24 | 0 | |||||
| 2025-08-14 | 13F | Royal Bank Of Canada | 117.644 | 85,41 | 2.335 | 110,17 | ||||
| 2025-07-31 | 13F | United Community Bank | 0 | -100,00 | 0 | |||||
| 2025-08-12 | 13F | BlackRock, Inc. | 42.251 | -95,07 | 839 | -94,41 | ||||
| 2025-08-13 | 13F | Hsbc Holdings Plc | 12.720 | -4,68 | 253 | 8,15 | ||||
| 2025-08-13 | 13F | National Bank Of Canada /fi/ | 0 | -100,00 | 0 | |||||
| 2025-08-12 | 13F | LPL Financial LLC | 30.307 | -55,28 | 602 | -49,33 | ||||
| 2025-08-14 | 13F | Kovitz Investment Group Partners, LLC | 94.548 | 62,56 | 1.878 | 84,38 | ||||
| 2025-06-26 | NP | SSXU - Day Hagan/Ned Davis Research Smart Sector International ETF | 128.246 | 2.247 | ||||||
| 2025-07-11 | 13F | Farther Finance Advisors, LLC | 3.600 | 0,00 | 71 | 12,70 | ||||
| 2025-09-04 | 13F/A | Advisor Group Holdings, Inc. | 16.234 | 20,02 | 323 | 36,44 | ||||
| 2025-04-22 | 13F | Moisand Fitzgerald Tamayo, LLC | 0 | -100,00 | 0 | |||||
| 2025-08-12 | 13F | Prudential Plc | 199.443 | 3.961 | ||||||
| 2025-08-13 | 13F | Walleye Trading LLC | Put | 0 | -100,00 | 0 | ||||
| 2025-08-14 | 13F | D. E. Shaw & Co., Inc. | 742.520 | 284,26 | 14.746 | 335,89 | ||||
| 2025-08-08 | 13F | Larson Financial Group LLC | 0 | -100,00 | 0 | |||||
| 2025-08-11 | 13F | Aptus Capital Advisors, LLC | 268 | 5 | ||||||
| 2025-08-13 | 13F | Jones Financial Companies Lllp | 214 | -38,86 | 4 | -33,33 | ||||
| 2025-08-13 | 13F | Quadrature Capital Ltd | 564.759 | -13,02 | 11.219 | -1,39 | ||||
| 2025-08-14 | 13F | Prelude Capital Management, Llc | 0 | -100,00 | 0 | |||||
| 2025-08-14 | 13F | Citadel Advisors Llc | Put | 20.400 | 29,94 | 405 | 47,81 | |||
| 2025-05-08 | 13F | New York Life Investment Management Llc | 0 | -100,00 | 0 | |||||
| 2025-07-24 | 13F | Blair William & Co/il | 2.896 | -22,21 | 58 | -12,31 | ||||
| 2025-07-21 | 13F | Mirae Asset Global Investments Co., Ltd. | 27.834 | 316,74 | 553 | 371,79 | ||||
| 2025-07-10 | 13F | Contravisory Investment Management, Inc. | 25.720 | 511 | ||||||
| 2025-08-14 | 13F | Citadel Advisors Llc | Call | 16.800 | -93,32 | 334 | -92,44 | |||
| 2025-08-14 | 13F | Susquehanna International Group, Llp | Call | 0 | -100,00 | 0 | ||||
| 2025-08-28 | NP | TFAFX - Tactical Growth Allocation Fund Class I | 1.600 | 32 | ||||||
| 2025-08-05 | 13F | Harel Insurance Investments & Financial Services Ltd. | 5.000 | 108,33 | 0 | |||||
| 2025-08-14 | 13F | Raymond James Financial Inc | 322.199 | -16,08 | 6.399 | -4,82 | ||||
| 2025-07-16 | 13F | Banque Pictet & Cie Sa | 215.913 | 0,00 | 4.288 | 13,44 | ||||
| 2025-07-28 | 13F | Harbour Investments, Inc. | 556 | 0,00 | 11 | 22,22 | ||||
| 2025-08-06 | 13F | Golden State Wealth Management, LLC | 115 | 0,00 | 2 | 0,00 | ||||
| 2025-05-14 | 13F | Walleye Trading LLC | 0 | -100,00 | 0 | -100,00 | ||||
| 2025-08-12 | 13F | O'shaughnessy Asset Management, Llc | 220 | -37,85 | 4 | -33,33 | ||||
| 2025-08-06 | 13F | Commonwealth Equity Services, Llc | 26.525 | 12,75 | 1 | |||||
| 2025-08-08 | 13F | Foundations Investment Advisors, LLC | 0 | -100,00 | 0 | |||||
| 2025-06-26 | NP | BlackRock ETF Trust - iShares International Country Rotation Active ETF | 2.415 | -27,24 | 42 | -22,22 | ||||
| 2025-08-14 | 13F | CIBC World Markets Inc. | 476.469 | -1,35 | 9.463 | 11,88 | ||||
| 2025-08-28 | NP | ICCIX - Dynamic International Opportunity Fund Class I | 29.101 | -19,19 | 578 | -8,41 | ||||
| 2025-08-13 | 13F | Invesco Ltd. | 10.233 | -7,18 | 203 | 5,18 | ||||
| 2025-04-25 | 13F | Mmbg Investment Advisors Co. | 0 | -100,00 | 0 | |||||
| 2025-03-26 | NP | MDAKX - MainStay Moderate ETF Allocation Fund Class C | 194.616 | 11,09 | 3.211 | 2,59 | ||||
| 2025-08-18 | 13F | Wolverine Trading, Llc | Call | 0 | -100,00 | 0 | ||||
| 2025-07-23 | 13F | Vontobel Holding Ltd. | 333.736 | -1,18 | 6.628 | 12,08 | ||||
| 2025-07-28 | 13F | Twin Tree Management, LP | 0 | -100,00 | 0 | |||||
| 2025-08-06 | 13F | Texas Yale Capital Corp. | 0 | -100,00 | 0 | |||||
| 2025-08-12 | 13F | Rhumbline Advisers | 1.431 | 0,00 | 28 | 12,00 | ||||
| 2025-08-13 | 13F | Taikang Asset Management (Hong Kong) Co Ltd | 55.029 | 0,00 | 1.093 | 13,40 | ||||
| 2025-08-13 | 13F | Capital Fund Management S.a. | 33.788 | 49,29 | 671 | 69,44 | ||||
| 2025-08-05 | 13F | Sigma Planning Corp | 24.004 | 33,87 | 477 | 52,08 | ||||
| 2025-05-15 | 13F | Optiver Holding B.V. | 0 | -100,00 | 0 | -100,00 | ||||
| 2025-08-14 | 13F | Glen Eagle Advisors, LLC | 58 | 1 | ||||||
| 2025-08-11 | 13F | TD Waterhouse Canada Inc. | 1.455 | 0,00 | 29 | 12,00 | ||||
| 2025-08-12 | 13F | Steward Partners Investment Advisory, Llc | 616 | 0,00 | 12 | 20,00 | ||||
| 2025-07-22 | 13F | 4Thought Financial Group Inc. | 184 | 3,37 | 4 | 0,00 | ||||
| 2025-08-08 | 13F | Creative Planning | 10.553 | -0,01 | 210 | 13,59 | ||||
| 2025-08-14 | 13F | Susquehanna International Group, Llp | Put | 10.100 | -79,72 | 201 | -77,04 | |||
| 2025-08-05 | 13F | Castlekeep Investment Advisors Llc | 20.757 | -3,42 | 412 | 9,57 | ||||
| 2025-08-14 | 13F | Susquehanna International Group, Llp | 12.229 | -92,56 | 243 | -91,59 | ||||
| 2025-08-14 | 13F | Tudor Investment Corp Et Al | 0 | -100,00 | 0 | |||||
| 2025-08-13 | 13F | Capital Fund Management S.a. | Call | 14.400 | -54,29 | 286 | -48,28 | |||
| 2025-05-15 | 13F | Dai-ichi Life Holdings, Inc. | 0 | -100,00 | 0 | |||||
| 2025-08-14 | 13F | Hrt Financial Lp | 179.958 | 4 | ||||||
| 2025-08-08 | 13F | SG Americas Securities, LLC | 1.195.271 | 738,32 | 24 | 1.050,00 | ||||
| 2025-08-13 | 13F | Marshall Wace, Llp | 43.000 | 854 | ||||||
| 2025-07-14 | 13F | Legacy Capital Group California, Inc. | 25.470 | 506 | ||||||
| 2025-08-14 | 13F | Bnp Paribas Arbitrage, Sa | 63.032 | -49,05 | 1.252 | -42,24 | ||||
| 2025-08-11 | 13F | Covestor Ltd | 7 | 0,00 | 0 | |||||
| 2025-08-14 | 13F | Evergreen Capital Management Llc | 124.720 | 6,09 | 2.477 | 20,31 | ||||
| 2025-08-06 | 13F | Prospera Financial Services Inc | 0 | -100,00 | 0 | |||||
| 2025-08-12 | 13F | Barings Llc | 208.539 | -8,67 | 4.142 | 3,58 | ||||
| 2025-07-29 | 13F | Millburn Ridgefield Corp | 646.987 | -12,03 | 12.849 | -0,23 | ||||
| 2025-08-13 | 13F | Baker Avenue Asset Management, LP | Put | 150.000 | -55,88 | 8 | -97,92 | |||
| 2025-05-07 | 13F | Drive Wealth Management, Llc | 0 | -100,00 | 0 | |||||
| 2025-08-14 | 13F | Citadel Advisors Llc | 0 | -100,00 | 0 | |||||
| 2025-08-05 | 13F | Bank Of Montreal /can/ | 81.957 | 0,28 | 1.628 | 13,70 | ||||
| 2025-08-13 | 13F | Cresset Asset Management, LLC | 29.020 | 8,78 | 576 | 23,34 | ||||
| 2025-08-06 | 13F | Innealta Capital, Llc | 29.101 | -19,19 | 578 | -8,41 | ||||
| 2025-08-14 | 13F | Jane Street Group, Llc | 544.097 | -22,59 | 10.806 | -12,21 | ||||
| 2025-08-14 | 13F | Gotham Asset Management, LLC | 10.426 | 0,00 | 207 | 13,74 | ||||
| 2025-08-13 | 13F | Idaho Trust Bank | 29.514 | 25,87 | 586 | 42,93 | ||||
| 2025-08-14 | 13F | Group One Trading, L.p. | 9.036 | 179 | ||||||
| 2025-08-27 | 13F/A | Squarepoint Ops LLC | 48.311 | 29,52 | 959 | 46,86 | ||||
| 2025-08-14 | 13F | Old Mission Capital Llc | 0 | -100,00 | 0 | |||||
| 2025-08-15 | 13F | Tower Research Capital LLC (TRC) | 1.837 | -37,81 | 36 | -41,94 | ||||
| 2025-08-12 | 13F | Jpmorgan Chase & Co | 192.022 | -3,68 | 3.814 | 9,26 | ||||
| 2025-07-31 | 13F | GenTrust, LLC | 20.561 | 6,03 | 408 | 20,35 | ||||
| 2025-08-14 | 13F | Comerica Bank | 1.112 | 11,87 | 22 | 29,41 | ||||
| 2025-08-05 | 13F | Tsfg, Llc | 500 | 0,00 | 0 | |||||
| 2025-08-12 | 13F | Proequities, Inc. | 0 | 0 | ||||||
| 2025-08-13 | 13F | Walleye Trading LLC | Call | 0 | -100,00 | 0 | ||||
| 2025-08-08 | 13F | Abc Arbitrage Sa | 17.827 | -80,52 | 354 | -77,90 | ||||
| 2025-07-29 | NP | HFND - Unlimited HFND Multi-Strategy Return Tracker ETF | 2.959 | 866,99 | 56 | 1.020,00 | ||||
| 2025-08-14 | 13F | Qube Research & Technologies Ltd | 927 | -98,35 | 18 | -98,17 | ||||
| 2025-07-17 | 13F | Albion Financial Group /ut | 63.000 | 0,00 | 1.251 | 13,42 | ||||
| 2025-08-13 | 13F | Renaissance Technologies Llc | 434.900 | 76,22 | 8.637 | 99,88 | ||||
| 2025-08-11 | 13F | Citigroup Inc | 26.239 | -72,07 | 521 | -68,33 | ||||
| 2025-07-18 | 13F | USA Financial Portformulas Corp | 7.706 | -38,75 | 153 | -30,45 | ||||
| 2025-08-11 | 13F | Principal Securities, Inc. | 29 | 1 | ||||||
| 2025-03-26 | NP | MOEAX - MainStay Growth ETF Allocation Fund Class A | 163.359 | 11,17 | 2.695 | 2,67 | ||||
| 2025-08-05 | 13F | Gould Asset Management Llc /ca/ | 39.511 | -3,26 | 785 | 9,65 | ||||
| 2025-08-07 | 13F | Allworth Financial LP | 20 | 0,00 | 0 | |||||
| 2025-08-14 | 13F | Two Sigma Securities, Llc | 17.106 | -68,19 | 340 | -63,97 | ||||
| 2025-05-29 | NP | Northern Lights Fund Trust - Sierra Tactical Core Growth Fund Investor Class Shares | 26.075 | 457 | ||||||
| 2025-05-29 | NP | Northern Lights Fund Trust - Sierra Tactical Risk Spectrum 50 Fund Investor Class | 568.800 | 9.960 | ||||||
| 2025-08-14 | 13F | Jane Street Group, Llc | Put | 33.500 | 665 | |||||
| 2025-07-24 | 13F | Cyndeo Wealth Partners, LLC | 15.626 | -2,78 | 310 | 10,32 | ||||
| 2025-08-14 | 13F | Wells Fargo & Company/mn | 165.021 | 382,84 | 3.277 | 447,99 | ||||
| 2025-05-15 | 13F | Barclays Plc | 0 | -100,00 | 0 | |||||
| 2025-08-14 | 13F | Integrated Wealth Concepts LLC | 54.406 | -41,23 | 1.080 | -33,33 | ||||
| 2025-05-01 | 13F | Cwm, Llc | 0 | -100,00 | 0 | |||||
| 2025-08-12 | 13F | BlackRock, Inc. | Put | 0 | -100,00 | 0 | -100,00 | |||
| 2025-08-14 | 13F | Horizon Investments, LLC | 27 | 107,69 | 1 | |||||
| 2025-08-14 | 13F | Goldman Sachs Group Inc | 87.564 | -46,51 | 1.739 | -39,32 | ||||
| 2025-05-29 | NP | Northern Lights Fund Trust - Sierra Tactical Risk Spectrum 30 Fund Instl Class | 142.900 | 2.502 | ||||||
| 2025-08-08 | NP | QALTX - Quantified Alternative Investment Fund Investor Class Shares | 1.411 | 28 | ||||||
| 2025-08-13 | 13F | Amundi | 23.414 | 7,90 | 471 | 24,01 | ||||
| 2025-08-12 | 13F | Atlas Capital Advisors Llc | 0 | -100,00 | 0 | |||||
| 2025-08-14 | 13F | Bank Of America Corp /de/ | 70.005 | -21,62 | 1.390 | -11,07 | ||||
| 2025-08-12 | 13F | XTX Topco Ltd | 15.828 | 314 | ||||||
| 2025-08-14 | 13F | Headlands Technologies LLC | 0 | -100,00 | 0 | -100,00 | ||||
| 2025-04-28 | 13F | Pictet North America Advisors SA | 0 | -100,00 | 0 | |||||
| 2025-07-16 | 13F/A | CX Institutional | 584 | -32,56 | 0 | |||||
| 2025-05-15 | 13F | Crestline Management, LP | 0 | -100,00 | 0 |