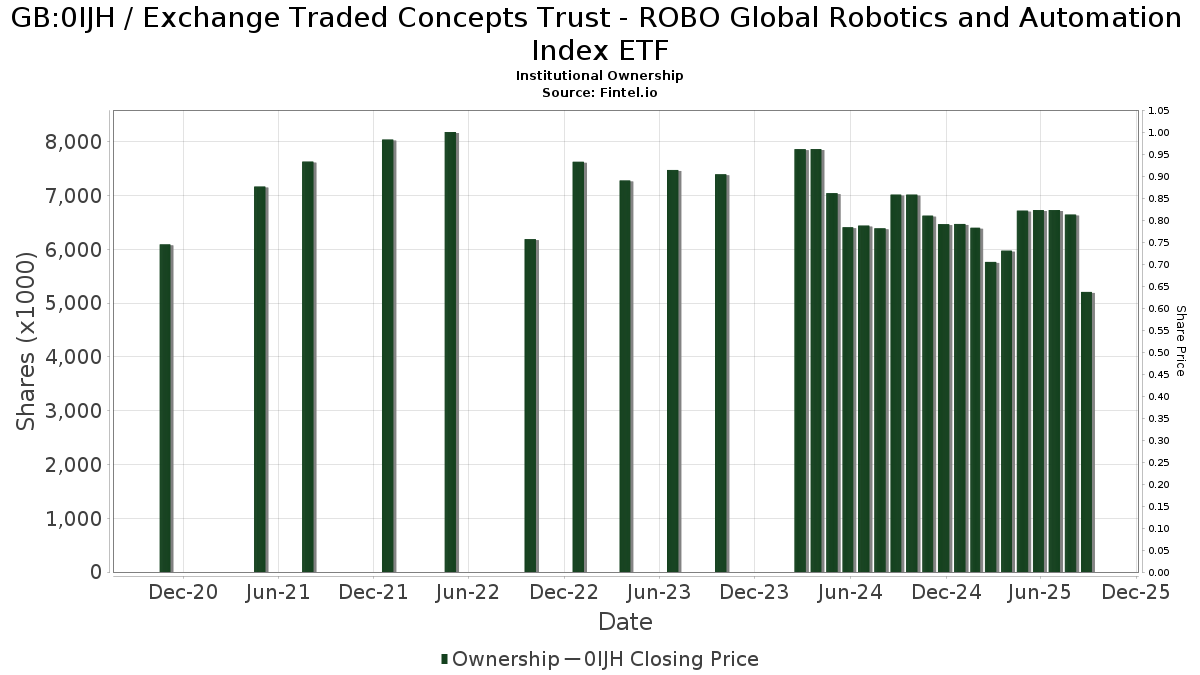
Statistiche di base
| Proprietari istituzionali | 242 total, 240 long only, 0 short only, 2 long/short - change of 8,48% MRQ |
| Allocazione media del portafoglio | 0.1206 % - change of 14,77% MRQ |
| Azioni istituzionali (Long) | 5.464.193 (ex 13D/G) - change of 0,21MM shares 3,98% MRQ |
| Valore istituzionale (Long) | $ 364.109 USD ($1000) |
Proprietà istituzionale e azionisti
Exchange Traded Concepts Trust - ROBO Global Robotics and Automation Index ETF (GB:0IJH) ha 242 proprietari istituzionali e azionisti che hanno presentato i moduli 13D/G o 13F alla Securities Exchange Commission (SEC). Queste istituzioni detengono un totale di 5,464,193 azioni. I maggiori azionisti includono UBS Group AG, Morgan Stanley, LPL Financial LLC, CI Private Wealth, LLC, Raymond James Financial Inc, Gray Foundation, Biltmore Family Office, LLC, Royal Bank Of Canada, M & L Capital Management Ltd, and Armstrong Advisory Group, Inc .
(Exchange Traded Concepts Trust - ROBO Global Robotics and Automation Index ETF (LSE:0IJH) la struttura proprietaria istituzionale mostra le attuali posizioni nella società da parte di istituzioni e fondi, nonché le ultime variazioni nella dimensione della posizione. I principali azionisti possono essere singoli investitori, fondi comuni, hedge fund o istituzioni. L'allegato 13D indica che l'investitore detiene (o ha detenuto) più del 5% della società e intende (o intendeva) perseguire attivamente un cambiamento nella strategia aziendale. L'allegato 13G indica un investimento passivo superiore al 5%.
Indice del sentiment dei fondi
L'indice del sentiment dei fondi (anche noto come "indice di accumulo di proprietà") individua i titoli più acquistati dai fondi. È il risultato di un sofisticato modello quantitativo multi-fattore che identifica le società con i più alti livelli di accumulo istituzionale. Il modello utilizza una combinazione dell'aumento totale dei proprietari dichiarati, delle variazioni nelle allocazioni di portafoglio di tali proprietari e di altre metriche. Il punteggio varia da 0 a 100: i numeri più alti indicano un livello di accumulo superiore ad altre società, mentre 50 rappresenta la media.
Frequenza di aggiornamento: giornaliera
Consulta Ownership Explorer per visualizzare l'elenco delle aziende con il ranking più alto.
AI+ Ask Fintel’s AI assistant about Exchange Traded Concepts Trust - ROBO Global Robotics and Automation Index ETF.
Select a question to share a public post with an AI-crafted answer.
Thinking of good questions…
Depositi 13F e NPORT
Le informazioni relative ai depositi 13F sono gratuite. Per accedere alle informazioni relative ai depositi NP è necessario un'abbonamento premium. Le righe verdi indicano le nuove posizioni. Le righe rosse indicano le posizioni chiuse. Fai clic sull'icona del link per visualizzare la cronologia completa delle transazioni.
Esegui l'upgrade
per sbloccare i dati premium ed esportarli in Excel ![]() .
.
| Data di deposito | Fonte | Investitore | Tipo | Prezzo medio (Stima) |
Azioni | Δ Azioni (%) |
Valore dichiarato ($ 1000) |
Δ Valore (%) |
Allocazione del portafoglio (%) |
|
|---|---|---|---|---|---|---|---|---|---|---|
| 2026-01-29 | 13F | Gray Foundation | 205.000 | 0,00 | 14.209 | 5,72 | ||||
| 2026-02-18 | 13F | Garton & Associates Financial Advisors LLC | 47 | 3 | ||||||
| 2026-02-13 | 13F | SRS Capital Advisors, Inc. | 381 | 26 | ||||||
| 2026-02-26 | 13F | Ssa Swiss Advisors Ag | 0 | -100,00 | 0 | |||||
| 2026-02-05 | 13F | Wilson & Boucher Capital Management, LLC | 3.375 | -5,59 | 234 | -0,43 | ||||
| 2026-02-17 | 13F | Cresset Asset Management, LLC | 0 | -100,00 | 0 | |||||
| 2026-01-20 | 13F | Stratos Wealth Partners, LTD. | 58.003 | 0,17 | 4.020 | 5,90 | ||||
| 2026-02-10 | 13F | Bnp Paribas Arbitrage, Sa | 1.114 | 77 | ||||||
| 2026-02-17 | 13F | Captrust Financial Advisors | 18.231 | -8,88 | 1.264 | -3,66 | ||||
| 2026-01-14 | 13F | Wolff Wiese Magana Llc | 202 | -47,40 | 14 | -44,00 | ||||
| 2026-01-23 | 13F | Bellevue Asset Management, Llc | 517 | 0,00 | 36 | 6,06 | ||||
| 2025-11-14 | 13F | Old Mission Capital Llc | 0 | -100,00 | 0 | |||||
| 2026-01-30 | 13F | Smart Portfolios, LLC | 3.075 | 0,00 | 213 | 5,97 | ||||
| 2026-02-18 | 13F | EP Wealth Advisors, Inc. | 7.047 | 15,96 | 488 | 34,44 | ||||
| 2026-01-20 | 13F | Nvwm, Llc | 39 | 0,00 | 3 | 0,00 | ||||
| 2026-02-12 | 13F | Summit Financial, LLC | 29.800 | -4,04 | 2.065 | 1,47 | ||||
| 2026-02-13 | 13F | Parkside Financial Bank & Trust | 16 | 0,00 | 1 | 0,00 | ||||
| 2026-02-17 | 13F | Qube Research & Technologies Ltd | 2.863 | 198 | ||||||
| 2026-02-17 | 13F | Cahill Financial Advisors Inc | 4.692 | 0,04 | 325 | 5,86 | ||||
| 2026-02-17 | 13F | Mustico Financial Group, Inc. | 6.208 | 2,48 | 454 | 12,38 | ||||
| 2026-02-11 | 13F | Gordian Capital Singapore Pte Ltd | 1.550 | 107 | ||||||
| 2025-11-03 | 13F | Golden State Wealth Management, LLC | 0 | 0 | ||||||
| 2026-02-04 | 13F | American Institute for Advanced Investment Management, LLP | 2.923 | -4,57 | 204 | 2,00 | ||||
| 2026-01-23 | 13F | Avion Wealth | 159 | -5,92 | 0 | |||||
| 2026-01-29 | 13F | UMA Financial Services, Inc. | 1.250 | 0,00 | 87 | 6,17 | ||||
| 2026-02-09 | 13F | Wiser Advisor Group LLC | 0 | -100,00 | 0 | |||||
| 2026-01-23 | 13F | Altfest L J & Co Inc | 2.980 | 207 | ||||||
| 2026-02-17 | 13F | Bank OZK | 23.959 | 0,00 | 1.661 | 5,73 | ||||
| 2026-02-13 | 13F | Pathstone Holdings, LLC | 3.023 | 210 | ||||||
| 2026-02-17 | 13F | Blair William & Co/il | 3.602 | 8,43 | 250 | 14,75 | ||||
| 2025-11-14 | 13F | Citadel Advisors Llc | 0 | -100,00 | 0 | |||||
| 2026-02-05 | 13F | Bessemer Group Inc | 12.940 | 0,00 | 1 | |||||
| 2026-01-27 | 13F | Duncker Streett & Co Inc | 340 | 0,00 | 24 | 4,55 | ||||
| 2026-02-02 | 13F | Ellis Investment Partners, LLC | 0 | -100,00 | 0 | |||||
| 2025-11-14 | 13F | Jane Street Group, Llc | 0 | -100,00 | 0 | |||||
| 2025-11-17 | 13F | FSA Wealth Management LLC | 154 | -31,25 | 10 | -23,08 | ||||
| 2025-11-13 | 13F | Total Investment Management Inc | 0 | -100,00 | 0 | |||||
| 2025-10-22 | 13F | McIlrath & Eck, LLC | 0 | -100,00 | 0 | |||||
| 2026-02-13 | 13F | National Bank Of Canada /fi/ | 75.161 | -11,35 | 5.201 | -6,44 | ||||
| 2026-01-30 | 13F | Citizens Financial Group Inc/ri | 5.354 | 0,02 | 371 | 6,00 | ||||
| 2026-01-20 | 13F | Signaturefd, Llc | 397 | 43,32 | 27 | 50,00 | ||||
| 2026-01-30 | 13F | Archer Investment Corp | 435 | 30 | ||||||
| 2026-02-09 | 13F | Powell Investment Advisors, LLC | 754 | 14,42 | 52 | 20,93 | ||||
| 2026-01-23 | 13F | Farther Finance Advisors, LLC | 5.200 | 15,53 | 360 | 22,03 | ||||
| 2026-02-03 | 13F | International Assets Investment Management, Llc | 611 | 42 | ||||||
| 2026-02-10 | 13F | Bank of New York Mellon Corp | 13.185 | 1,41 | 914 | 7,16 | ||||
| 2026-02-17 | 13F | Snowden Capital Advisors LLC | 3.970 | 275 | ||||||
| 2026-02-02 | 13F | Mutual Advisors, LLC | 5.660 | -1,67 | 392 | -1,01 | ||||
| 2025-11-14 | 13F | Flow Traders U.s. Llc | 0 | -100,00 | 0 | |||||
| 2026-01-27 | 13F | First Horizon Corp | 0 | -100,00 | 0 | |||||
| 2026-02-12 | 13F | Wealthspire Advisors, LLC | 0 | -100,00 | 0 | |||||
| 2026-01-23 | 13F | Assetmark, Inc | 75 | 1,35 | 5 | 25,00 | ||||
| 2026-02-13 | 13F | AlTi Global, Inc. | 5.665 | 0,00 | 393 | 5,66 | ||||
| 2026-02-17 | 13F | Mercer Global Advisors Inc /adv | 65.450 | -2,54 | 4.536 | 3,04 | ||||
| 2026-01-30 | 13F | Us Bancorp \de\ | 1.464 | 0,00 | 101 | 6,32 | ||||
| 2026-01-30 | 13F | North Star Investment Management Corp. | 4.350 | 0,00 | 301 | 5,61 | ||||
| 2026-02-17 | 13F | Hancock Prospecting Pty Ltd | 21.793 | 0,00 | 1.510 | 5,74 | ||||
| 2026-01-16 | 13F | Matauro, Llc | 4.110 | 0,00 | 285 | 5,58 | ||||
| 2026-02-12 | 13F | Steward Partners Investment Advisory, Llc | 4.493 | 19,37 | 311 | 26,42 | ||||
| 2026-01-09 | 13F | Pacifica Partners Inc. | 158 | 0,00 | 11 | 10,00 | ||||
| 2026-01-22 | 13F | Brookwood Investment Group LLC | 0 | -100,00 | 0 | |||||
| 2026-01-28 | 13F | Cranbrook Wealth Management, LLC | 189 | 13 | ||||||
| 2026-02-13 | 13F | Gts Securities Llc | 4.032 | -51,15 | 279 | -48,43 | ||||
| 2026-02-11 | 13F | Simplex Trading, Llc | 0 | -100,00 | 0 | |||||
| 2026-02-18 | 13F | Beacon Pointe Advisors, LLC | 0 | -100,00 | 0 | |||||
| 2026-01-20 | 13F | Rainier Family Wealth Inc | 30.213 | 19,62 | 2.094 | 26,53 | ||||
| 2026-01-29 | 13F | Comprehensive Financial Consultants Institutional, Inc. | 3.661 | -5,47 | 254 | 0,00 | ||||
| 2026-01-20 | 13F | Thurston, Springer, Miller, Herd & Titak, Inc. | 200 | 14 | ||||||
| 2026-02-13 | 13F | Baird Financial Group, Inc. | 4.200 | -15,70 | 291 | -10,74 | ||||
| 2026-02-17 | 13F | Raymond James Financial Inc | 217.761 | 5,77 | 15.093 | 11,82 | ||||
| 2025-11-10 | 13F | New Millennium Group LLC | 0 | -100,00 | 0 | |||||
| 2026-02-02 | 13F | CENTRAL TRUST Co | 1.000 | 0,00 | 69 | 6,15 | ||||
| 2026-02-05 | 13F | Thrivent Financial For Lutherans | 6.077 | 8,11 | 0 | |||||
| 2026-02-11 | 13F | Group One Trading, L.p. | 0 | -100,00 | 0 | |||||
| 2026-01-23 | 13F | Curbstone Financial Management Corp | 24.480 | 3,99 | 1.697 | 9,92 | ||||
| 2025-11-12 | 13F | Park Square Financial Group, LLC | 0 | -100,00 | 0 | |||||
| 2026-01-28 | 13F | Key Client Fiduciary Advisors, LLC | 0 | -100,00 | 0 | |||||
| 2026-02-03 | 13F | Winch Advisory Services, LLC | 1.926 | -43,98 | 134 | -40,89 | ||||
| 2026-01-21 | 13F | Sound Income Strategies, LLC | 271 | 594,87 | 20 | 900,00 | ||||
| 2025-10-02 | 13F | Bank of New Hampshire | 305 | 0,00 | 20 | 5,56 | ||||
| 2026-01-05 | 13F | Noble Wealth Management PBC | 880 | 0,00 | 61 | 5,26 | ||||
| 2026-02-13 | 13F | Atlas Capital Advisors Llc | 556 | 39 | ||||||
| 2026-02-13 | 13F | Beck Capital Management, Llc | 10.544 | 4,14 | 731 | 10,11 | ||||
| 2025-11-10 | 13F | Koshinski Asset Management, Inc. | 0 | -100,00 | 0 | |||||
| 2026-02-11 | 13F | Commonwealth Retirement Investments LLC | 250 | 17 | ||||||
| 2026-01-08 | 13F | Adirondack Trust Co | 221 | 15 | ||||||
| 2026-02-13 | 13F | Solstein Capital, LLC | 1.175 | 0,00 | 81 | 5,19 | ||||
| 2026-02-03 | 13F | Crestwood Advisors Group LLC | 58.674 | -0,45 | 4.067 | 5,23 | ||||
| 2026-02-12 | 13F | Principal Securities, Inc. | 66.589 | 6,00 | 4.615 | 12,07 | ||||
| 2026-01-21 | 13F | Crews Bank & Trust | 454 | 0,00 | 31 | 6,90 | ||||
| 2026-02-17 | 13F | Private Advisor Group, LLC | 4.810 | -74,08 | 333 | -72,62 | ||||
| 2026-02-12 | 13F | CIBC Private Wealth Group, LLC | 1.602 | 3,56 | 111 | 9,90 | ||||
| 2025-10-22 | 13F | GoalVest Advisory LLC | 0 | -100,00 | 0 | |||||
| 2026-02-04 | 13F | First Foundation Advisors | 5.211 | 0,00 | 361 | 5,87 | ||||
| 2026-02-18 | 13F | GWM Advisors LLC | 8.041 | 2,91 | 557 | 8,79 | ||||
| 2026-02-12 | 13F | Commonwealth Equity Services, Llc | 90.574 | -1,92 | 6.278 | 104.516,67 | ||||
| 2026-01-20 | 13F | Toth Financial Advisory Corp | 360 | 0,00 | 25 | 4,35 | ||||
| 2026-02-17 | 13F | Advisor Group Holdings, Inc. | 55.727 | 12,79 | 3.863 | 21,33 | ||||
| 2026-01-16 | 13F | Ronald Blue Trust, Inc. | 3.024 | 1,20 | 210 | 7,18 | ||||
| 2026-02-17 | 13F | Strive Financial Group ,LLC | 3.805 | 264 | ||||||
| 2026-01-13 | 13F | Dakota Wealth Management | 4.713 | 0,00 | 327 | 5,84 | ||||
| 2026-02-12 | 13F | BRYN MAWR TRUST Co | 906 | 0,00 | 63 | 5,08 | ||||
| 2026-02-10 | 13F | WCG Wealth Advisors LLC | 12.037 | 834 | ||||||
| 2025-11-25 | 13F | Kimelman & Baird, LLC | 0 | -100,00 | 0 | |||||
| 2026-02-04 | 13F | Biltmore Family Office, LLC | 201.667 | 0,08 | 13.978 | 5,81 | ||||
| 2026-02-04 | 13F | Fourth Dimension Wealth, LLC | 64 | 0,00 | 4 | 0,00 | ||||
| 2026-02-10 | 13F | Ritter Daniher Financial Advisory LLC / DE | 79 | 5 | ||||||
| 2026-02-13 | 13F | Clay Northam Wealth Management, LLC | 13.408 | -7,71 | 929 | -2,42 | ||||
| 2026-02-17 | 13F | Fmr Llc | 11.146 | 15,04 | 772 | 21,57 | ||||
| 2026-02-13 | 13F | Ubs Asset Management Americas Inc | 82 | 6 | ||||||
| 2026-02-13 | 13F | Stifel Financial Corp | 37.367 | -6,28 | 2.590 | -0,96 | ||||
| 2026-02-12 | 13F | Triumph Capital Management | 314 | -1,57 | 22 | 5,00 | ||||
| 2026-01-27 | 13F | Aspiring Ventures, LLC | 7.500 | 0,00 | 520 | 5,70 | ||||
| 2026-01-09 | 13F | SG Americas Securities, LLC | 50.103 | 0,21 | 3 | 0,00 | ||||
| 2026-02-11 | 13F | Parallel Advisors, LLC | 300 | 21 | ||||||
| 2026-01-20 | 13F | Whalen Wealth Management Inc. | 0 | -100,00 | 0 | |||||
| 2026-02-11 | 13F | Cedar Mountain Advisors, LLC | 212 | 0,47 | 15 | 7,69 | ||||
| 2026-01-21 | 13F | TOWER TRUST & INVESTMENT Co | 325 | 0,00 | 23 | 4,76 | ||||
| 2026-01-30 | 13F | Camden Capital, LLC | 6.950 | -25,28 | 482 | -21,02 | ||||
| 2026-02-12 | 13F | Rossby Financial, LCC | 302 | 0,00 | 21 | 0,00 | ||||
| 2026-02-17 | 13F | Fountainhead AM, LLC | 5.083 | -83,40 | 352 | -82,46 | ||||
| 2026-01-23 | 13F | LOM Asset Management Ltd | 550 | 0,00 | 38 | 5,56 | ||||
| 2026-01-23 | 13F | Eagle Strategies LLC | 26.869 | 9,15 | 1.862 | 15,44 | ||||
| 2026-02-11 | 13F | Flagship Wealth Advisors, Llc | 188 | 0,00 | 13 | 8,33 | ||||
| 2026-02-06 | 13F | Global Retirement Partners, LLC | 201 | 0,50 | 14 | 0,00 | ||||
| 2026-02-11 | 13F | VVR Holdings LLC | 4.589 | 318 | ||||||
| 2026-02-13 | 13F | Creekside Partners | 7.114 | 0,06 | 493 | 5,79 | ||||
| 2026-01-23 | 13F | James J. Burns & Company, LLC | 10.913 | 10,71 | 756 | 17,03 | ||||
| 2026-02-17 | 13F | Equitable Holdings, Inc. | 13.178 | -1,20 | 913 | 4,46 | ||||
| 2026-02-09 | 13F | Clearwater Capital Advisors, LLC | 3.818 | 0,00 | 265 | 5,60 | ||||
| 2026-02-09 | 13F | Avalon Trust Co | 850 | 0,00 | 59 | 5,45 | ||||
| 2026-02-04 | 13F | Pensionmark Financial Group, Llc | 10.217 | 75,94 | 700 | 84,21 | ||||
| 2025-11-05 | 13F | SPC Financial, Inc. | 0 | -100,00 | 0 | |||||
| 2026-01-14 | 13F | Spire Wealth Management | 9.167 | 0,00 | 635 | 5,83 | ||||
| 2026-02-13 | 13F | Mariner, LLC | 8.708 | -7,11 | 604 | -1,79 | ||||
| 2026-02-13 | 13F | MAI Capital Management | 1.340 | 3,88 | 93 | 9,52 | ||||
| 2026-02-17 | 13F | Millennium Management Llc | 20.914 | 208,38 | 1.450 | 226,35 | ||||
| 2026-02-13 | 13F | Morgan Stanley | 561.572 | 9,36 | 38.923 | 15,62 | ||||
| 2026-01-15 | 13F | Lodestone Wealth Management LLC | 61 | 4 | ||||||
| 2026-02-09 | 13F | Huntington National Bank | 36 | -50,68 | ||||||
| 2026-02-06 | 13F | Creative Financial Designs Inc /adv | 5 | 0,00 | 0 | |||||
| 2026-02-12 | 13F | Cloud Capital Management, LLC | 0 | -100,00 | 0 | |||||
| 2026-01-26 | 13F | AE Wealth Management LLC | 1.041 | 72 | ||||||
| 2026-02-04 | 13F | Ameritas Advisory Services, LLC | 0 | -100,00 | 0 | |||||
| 2026-02-10 | 13F | CIBC World Markets Inc. | 8.651 | -1,88 | 600 | 3,63 | ||||
| 2026-01-08 | 13F | Armstrong Advisory Group, Inc | 161.977 | 3,78 | 11.227 | 9,71 | ||||
| 2026-02-12 | 13F | Scotia Capital Inc. | 10.647 | 2,61 | 738 | 8,38 | ||||
| 2026-02-17 | 13F | Cetera Investment Advisers | 56.120 | -0,76 | 3.890 | 4,91 | ||||
| 2026-02-13 | 13F | Vontobel Holding Ltd. | 7.516 | 19,78 | 521 | 26,52 | ||||
| 2026-02-03 | 13F | SBI Securities Co., Ltd. | 508 | -15,05 | 35 | -10,26 | ||||
| 2025-11-14 | 13F | Great Valley Advisor Group, Inc. | 0 | -100,00 | 0 | -100,00 | ||||
| 2026-02-09 | 13F | Solutions 4 Wealth, Ltd | 18.070 | 0,26 | 1.252 | 6,01 | ||||
| 2026-01-21 | 13F | Newbridge Financial Services Group, Inc. | 152 | 0,66 | 11 | 11,11 | ||||
| 2026-01-07 | 13F | Vigilare Wealth Management | 3.668 | 0,03 | 254 | 5,83 | ||||
| 2026-01-08 | 13F | Wedmont Private Capital | 6.400 | 0,00 | 465 | 7,39 | ||||
| 2026-02-17 | 13F | Hyposwiss Advisors SA | 35.356 | 2.451 | ||||||
| 2026-01-20 | 13F | RPG Investment Advisory, LLC | 23.179 | -0,52 | 1.607 | 5,17 | ||||
| 2026-02-11 | 13F | LPL Financial LLC | 337.119 | 2,64 | 23.366 | 8,51 | ||||
| 2026-02-17 | 13F | Main Street Financial Solutions, LLC | 21.101 | -1,36 | 1.462 | 4,28 | ||||
| 2026-01-29 | 13F | Nbc Securities, Inc. | 0 | -100,00 | 0 | |||||
| 2026-02-12 | 13F | Ankerstar Wealth, LLC | 18 | 1 | ||||||
| 2026-02-17 | 13F | Citadel Advisors Llc | Put | 3.100 | 215 | |||||
| 2026-02-17 | 13F | Citadel Advisors Llc | Call | 4.300 | 298 | |||||
| 2025-10-14 | 13F | Berkshire Money Management, Inc. | 0 | -100,00 | 0 | |||||
| 2026-02-11 | 13F | Prudential Plc | 0 | -100,00 | 0 | |||||
| 2026-02-03 | 13F | Washington Trust Advisors, Inc. | 223 | 8,25 | 15 | 15,38 | ||||
| 2026-02-05 | 13F | Allworth Financial LP | 704 | 8,47 | 49 | 14,29 | ||||
| 2026-02-06 | 13F | HighTower Advisors, LLC | 20.876 | 40,27 | 1.447 | 48,31 | ||||
| 2026-02-17 | 13F | Ameriprise Financial Inc | 144.722 | 16,62 | 10.031 | 23,28 | ||||
| 2025-11-12 | 13F | Creekmur Asset Management LLC | 1.445 | -0,76 | 95 | 8,05 | ||||
| 2026-02-26 | 13F | Anchor Investment Management, LLC | 50 | 0,00 | 3 | 0,00 | ||||
| 2026-02-05 | 13F | Cambridge Investment Research Advisors, Inc. | 48.973 | -13,90 | 3 | 0,00 | ||||
| 2026-02-13 | 13F | Acumen Wealth Advisors, LLC | 12 | 1 | ||||||
| 2026-01-30 | 13F | SOL Capital Management CO | 6.555 | -19,67 | 0 | |||||
| 2026-02-13 | 13F | Kilter Group LLC | 76 | 0,00 | 5 | 25,00 | ||||
| 2026-02-05 | 13F | Western Wealth Management, LLC | 3.449 | 0,17 | 239 | 6,22 | ||||
| 2026-02-17 | 13F | Susquehanna International Group, Llp | Put | 14.900 | 192,16 | 1.033 | 208,98 | |||
| 2026-02-13 | 13F | Colony Group, LLC | 37.153 | -6,77 | 2.495 | -4,48 | ||||
| 2026-02-17 | 13F | Susquehanna International Group, Llp | Call | 74.700 | 457,46 | 5.177 | 489,64 | |||
| 2026-01-26 | 13F | Milestones Private Investment Advisors LLC | 7.312 | 0,10 | 507 | 5,86 | ||||
| 2026-02-18 | 13F | Vermillion & White Wealth Management Group, LLC | 34 | 0,00 | 2 | 0,00 | ||||
| 2026-02-17 | 13F | Susquehanna International Group, Llp | 28.562 | 127,42 | 1.980 | 140,46 | ||||
| 2026-02-14 | 13F | Rockefeller Capital Management L.P. | 20.978 | 23,23 | 1.454 | 30,29 | ||||
| 2026-02-17 | 13F | D. E. Shaw & Co., Inc. | 6.758 | -6,89 | 468 | -1,47 | ||||
| 2025-11-06 | 13F | Financial Advocates Investment Management | 0 | -100,00 | 0 | |||||
| 2026-01-16 | 13F | M3 Advisory Group, LLC | 3.918 | 5,18 | 272 | 11,07 | ||||
| 2026-02-02 | 13F | Pinnacle Wealth Management Advisory Group, LLC | 10.380 | 0,00 | 719 | 5,74 | ||||
| 2026-02-17 | 13F | Ameriflex Group, Inc. | 455 | 32 | ||||||
| 2026-02-12 | 13F | Burke & Herbert Bank & Trust Co | 3.871 | -78,20 | 268 | -76,98 | ||||
| 2026-01-20 | 13F | Quintet Private Bank (Europe) S.A. | 600 | 0,00 | 42 | 5,13 | ||||
| 2026-02-17 | 13F | Safe Harbor Fiduciary, LLC | 100 | -50,00 | 7 | -45,45 | ||||
| 2026-01-22 | 13F | Bartlett & Co. Wealth Management Llc | 800 | 0,00 | 55 | 5,77 | ||||
| 2026-01-26 | 13F | Main Street Group, LTD | 0 | -100,00 | 0 | |||||
| 2026-02-12 | 13F | Financial Engines Advisors L.L.C. | 3.917 | 271 | ||||||
| 2026-02-17 | 13F | Ancora Advisors, LLC | 801 | 33,50 | 56 | 41,03 | ||||
| 2026-02-10 | 13F/A | Northwestern Mutual Wealth Management Co | 85.187 | -1,34 | 5.904 | 4,31 | ||||
| 2026-02-06 | 13F | Larson Financial Group LLC | 300 | 0,00 | 21 | 5,26 | ||||
| 2026-03-04 | 13F | SHP Wealth Management | 337 | 23 | ||||||
| 2026-01-28 | 13F | CAPROCK Group, Inc. | 7.908 | -5,78 | 548 | 2,43 | ||||
| 2026-02-06 | 13F | GPS Wealth Strategies Group, LLC | 266 | -88,25 | 18 | -87,84 | ||||
| 2026-02-09 | 13F | Summit Asset Management, LLC | 6.084 | 4,21 | 422 | 10,21 | ||||
| 2026-02-17 | 13F | Royal Bank Of Canada | 196.876 | 2,13 | 13.646 | 7,97 | ||||
| 2026-02-17 | 13F | IHT Wealth Management, LLC | 9.177 | -1,38 | 636 | 4,26 | ||||
| 2026-01-20 | 13F | Ntv Asset Management Llc | 88.510 | 0,97 | 6.135 | 6,75 | ||||
| 2026-02-17 | 13F | CHICAGO TRUST Co NA | 0 | -100,00 | 0 | |||||
| 2025-11-14 | 13F | Strategic Wealth Partners, Ltd. | 600 | 0,00 | 39 | 11,43 | ||||
| 2026-01-22 | 13F | Fiduciary Alliance LLC | 0 | -100,00 | 0 | |||||
| 2026-01-12 | 13F | M & L Capital Management Ltd | 185.810 | 4,06 | 12.878 | 10,01 | ||||
| 2026-02-17 | 13F | Creative Planning | 11.840 | -18,65 | 821 | -14,05 | ||||
| 2026-02-13 | 13F | Johnson Investment Counsel Inc | 0 | -100,00 | 0 | |||||
| 2026-01-20 | 13F | AdvisorNet Financial, Inc | 752 | -3,59 | 52 | 1,96 | ||||
| 2026-02-09 | 13F | Blue Bell Private Wealth Management, Llc | 15 | 0,00 | 1 | |||||
| 2026-02-06 | 13F | Fortis Group Advisors, LLC | 18.647 | -0,38 | 1.348 | 3,61 | ||||
| 2026-01-16 | 13F | PFS Partners, LLC | 600 | 0,00 | 42 | 5,13 | ||||
| 2026-02-12 | 13F | Bank Of Montreal /can/ | 1.475 | 102 | ||||||
| 2026-01-26 | 13F | Wealth Effects Llc | 3.080 | 0,10 | 213 | 5,97 | ||||
| 2026-01-15 | 13F | Trust Co | 79 | 0,00 | 5 | 0,00 | ||||
| 2026-02-10 | 13F | Envestnet Asset Management Inc | 20.820 | 15,00 | 1.443 | 21,67 | ||||
| 2026-02-17 | 13F | Bank Of America Corp /de/ | 7.741 | -2,91 | 537 | 2,68 | ||||
| 2026-01-22 | 13F | Evermay Wealth Management Llc | 1.010 | 0,00 | 70 | 6,06 | ||||
| 2026-02-10 | 13F | Lido Advisors, LLC | 22.696 | 1.565 | ||||||
| 2026-02-05 | 13F | Pacific Sun Financial Corp | 37.809 | -0,54 | 2.621 | 5,14 | ||||
| 2026-02-13 | 13F | Resources Investment Advisors, LLC. | 31.166 | -32,24 | 2.160 | -28,36 | ||||
| 2026-02-06 | 13F | Pnc Financial Services Group, Inc. | 5.426 | 106,63 | 376 | 118,60 | ||||
| 2026-02-11 | 13F | Jpmorgan Chase & Co | 10.084 | 2,88 | 699 | 8,72 | ||||
| 2026-02-02 | 13F | Fifth Third Bancorp | 101 | 0,00 | 7 | 16,67 | ||||
| 2026-01-12 | 13F | Roble, Belko & Company, Inc | 87 | 0,00 | 0 | |||||
| 2026-02-10 | 13F | Peapack Gladstone Financial Corp | 6.846 | 22,25 | 0 | |||||
| 2026-01-28 | 13F | Glassman Wealth Services | 30 | 0,00 | 2 | 100,00 | ||||
| 2026-02-10 | 13F | Greenwich Wealth Management LLC | 7.939 | 0,00 | 1 | |||||
| 2026-02-13 | 13F | Mml Investors Services, Llc | 12.217 | 10,12 | 847 | 16,37 | ||||
| 2026-01-13 | 13F | CoreCap Advisors, LLC | 208 | 246,67 | 14 | 366,67 | ||||
| 2026-02-03 | 13F | Costello Asset Management, INC | 326 | 0,31 | 23 | 4,76 | ||||
| 2026-01-26 | 13F | PFG Investments, LLC | 4.961 | 5,82 | 344 | 11,73 | ||||
| 2026-02-06 | 13F | IFP Advisors, Inc | 1.415 | 224,54 | 98 | 250,00 | ||||
| 2026-02-11 | 13F | Janney Montgomery Scott LLC | 5.805 | 14,29 | 0 | |||||
| 2026-02-13 | 13F | Citigroup Inc | 39.200 | -3,88 | 2.717 | 1,61 | ||||
| 2026-02-11 | 13F | Capital Analysts, Inc. | 0 | -100,00 | 0 | |||||
| 2026-02-17 | 13F | Hilltop Holdings Inc. | 14.274 | 989 | ||||||
| 2026-02-02 | 13F | Oppenheimer & Co Inc | 17.345 | 66,43 | 1.202 | 75,99 | ||||
| 2026-01-26 | 13F | Cwm, Llc | 3.019 | -7,11 | 0 | |||||
| 2026-02-04 | 13F | Atlantic Union Bankshares Corp | 299 | 0,00 | 21 | 5,26 | ||||
| 2026-02-13 | 13F | Kestra Advisory Services, LLC | 0 | -100,00 | 0 | |||||
| 2026-02-17 | 13F | Russell Investments Group, Ltd. | 706 | 0,00 | 49 | 4,35 | ||||
| 2026-02-17 | 13F | Tower Research Capital LLC (TRC) | 4 | 0 | ||||||
| 2026-02-02 | 13F | Objectivity Squared, LLC | 9.715 | 0,42 | 673 | 6,15 | ||||
| 2026-02-05 | 13F | Pinnacle Associates Ltd | 44.137 | -1,49 | 3.059 | 4,15 | ||||
| 2026-01-26 | 13F | Mirae Asset Global Investments Co., Ltd. | 33.000 | 2.287 | ||||||
| 2026-02-02 | 13F | Truist Financial Corp | 5.446 | -2,91 | 377 | 2,72 | ||||
| 2026-02-04 | 13F | Strategic Family Wealth Counselors, L.L.C. | 3.057 | 221 | ||||||
| 2026-01-28 | 13F | Carmel Capital Management L.L.C. | 98.940 | 0,82 | 6.858 | 6,57 | ||||
| 2026-02-13 | 13F | Wells Fargo & Company/mn | 2.851 | -73,34 | 198 | -71,90 | ||||
| 2026-01-23 | 13F | Brown, Lisle/cummings, Inc. | 117 | 0,00 | 8 | 14,29 | ||||
| 2026-02-11 | 13F | Cerity Partners LLC | 5.265 | 6,13 | 365 | 12,00 | ||||
| 2026-02-19 | 13F | CI Private Wealth, LLC | 244.820 | 32,06 | 12.760 | 4,99 | ||||
| 2026-02-13 | 13F | Glen Eagle Advisors, LLC | 60 | 0,00 | 4 | 33,33 | ||||
| 2026-02-09 | 13F | Kingsview Wealth Management, LLC | 4.229 | 36,42 | 293 | 44,33 | ||||
| 2026-02-09 | 13F | Hartland & Co., LLC | 625 | 0,48 | 43 | 7,50 | ||||
| 2026-02-11 | 13F | Manchester Capital Management LLC | 2.640 | 183 | ||||||
| 2026-02-11 | 13F | Modus Advisors, LLC | 55 | 4 | ||||||
| 2026-02-10 | 13F | Fort Sheridan Advisors Llc | 5.218 | -0,08 | 362 | 5,56 | ||||
| 2026-01-29 | 13F | Comerica Bank | 3.939 | -18,16 | 273 | -13,33 | ||||
| 2026-02-13 | 13F | Barclays Plc | 3.500 | 0,00 | 243 | 5,68 | ||||
| 2026-02-12 | 13F | Federation des caisses Desjardins du Quebec | 2.215 | 15,67 | 153 | 22,40 | ||||
| 2026-01-20 | 13F | Ethos Financial Group, LLC | 4.280 | 1,01 | 297 | 6,86 | ||||
| 2026-02-03 | 13F | Coston, McIsaac & Partners | 5 | 0,00 | 0 | |||||
| 2026-02-13 | 13F | Financial Freedom, LLC | 6.997 | 0,00 | 485 | 5,68 | ||||
| 2026-01-23 | 13F | Valley National Advisers Inc | 564 | 1,44 | 0 | |||||
| 2026-01-27 | 13F | TD Waterhouse Canada Inc. | 3.687 | 40,73 | 255 | 47,40 | ||||
| 2026-01-26 | 13F | Harbor Asset Planning, Inc. | 50 | 3 | ||||||
| 2026-01-23 | 13F | Steigerwald, Gordon & Koch Inc. | 43 | 3 | ||||||
| 2026-01-30 | 13F | Joel Isaacson & Co., LLC | 7.929 | -15,66 | 550 | -10,88 | ||||
| 2026-02-17 | 13F | Advisory Services Network, LLC | 11.831 | 1.820,62 | 820 | 1.950,00 | ||||
| 2026-01-08 | 13F | Wealth Enhancement Advisory Services, Llc | 6.263 | 3,78 | 458 | 11,98 | ||||
| 2026-01-28 | 13F | Geneos Wealth Management Inc. | 21.225 | 0,00 | 1.471 | 5,75 | ||||
| 2026-02-17 | 13F | Prosperity Consulting Group, LLC | 8.556 | 1,58 | 593 | 7,43 | ||||
| 2026-01-05 | 13F | Chesapeake Asset Management Llc | 0 | -100,00 | 0 | -100,00 | ||||
| 2026-01-23 | 13F | Westside Investment Management, Inc. | 100 | 0,00 | 7 | 0,00 | ||||
| 2026-01-29 | 13F | UBS Group AG | 666.350 | -0,65 | 46.185 | 5,03 | ||||
| 2026-02-17 | 13F | Humankind Investments LLC | 41.500 | 0,00 | 2.876 | 5,74 | ||||
| 2026-02-02 | 13F | Pittenger & Anderson Inc | 875 | 0,00 | 61 | 5,26 | ||||
| 2026-02-03 | 13F | Anfield Capital Management, LLC | 133 | 0,00 | 9 | 12,50 | ||||
| 2026-02-13 | 13F | Banque Transatlantique SA | 1.534 | -2,17 | 107 | 4,90 | ||||
| 2026-02-09 | 13F | Harbour Investments, Inc. | 2.388 | -18,89 | 165 | -14,06 | ||||
| 2026-01-30 | 13F | Strategic Blueprint, LLC | 0 | -100,00 | 0 | |||||
| 2026-01-21 | 13F | BIP Wealth, LLC | 45.331 | 3.142 |
Other Listings
| US:ROBO | 71,98 USD |