Statistiche di base
| Proprietari istituzionali | 223 total, 223 long only, 0 short only, 0 long/short - change of 5,19% MRQ |
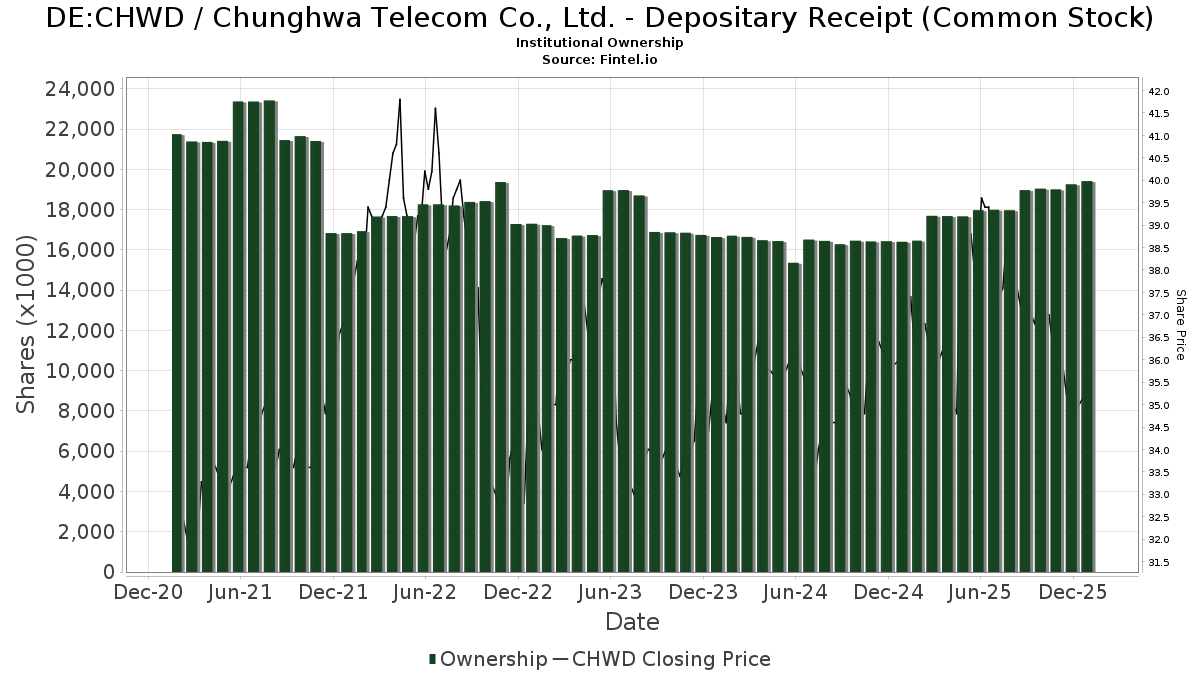
| Prezzo dell'azione | 34,80 |
| Allocazione media del portafoglio | 0.0706 % - change of -13,24% MRQ |
| Azioni istituzionali (Long) | 19.325.816 (ex 13D/G) - change of 0,27MM shares 1,44% MRQ |
| Valore istituzionale (Long) | $ 810.774 USD ($1000) |
Proprietà istituzionale e azionisti
Chunghwa Telecom Co., Ltd. - Depositary Receipt (Common Stock) (DE:CHWD) ha 223 proprietari istituzionali e azionisti che hanno presentato i moduli 13D/G o 13F alla Securities Exchange Commission (SEC). Queste istituzioni detengono un totale di 19,325,816 azioni. I maggiori azionisti includono BlackRock, Inc., Renaissance Technologies Llc, Vanguard Group Inc, Morgan Stanley, Connor, Clark & Lunn Investment Management Ltd., VEIEX - Vanguard Emerging Markets Stock Index Fund Investor Shares, Northern Trust Corp, Schroder Investment Management Group, Td Asset Management Inc, and Dimensional Fund Advisors Lp .
(Chunghwa Telecom Co., Ltd. - Depositary Receipt (Common Stock) (DB:CHWD) la struttura proprietaria istituzionale mostra le attuali posizioni nella società da parte di istituzioni e fondi, nonché le ultime variazioni nella dimensione della posizione. I principali azionisti possono essere singoli investitori, fondi comuni, hedge fund o istituzioni. L'allegato 13D indica che l'investitore detiene (o ha detenuto) più del 5% della società e intende (o intendeva) perseguire attivamente un cambiamento nella strategia aziendale. L'allegato 13G indica un investimento passivo superiore al 5%.
The share price as of February 6, 2026 is 34,80 / share. Previously, on February 10, 2025, the share price was 37,00 / share. This represents a decline of 5,95% over that period.
Indice del sentiment dei fondi
L'indice del sentiment dei fondi (anche noto come "indice di accumulo di proprietà") individua i titoli più acquistati dai fondi. È il risultato di un sofisticato modello quantitativo multi-fattore che identifica le società con i più alti livelli di accumulo istituzionale. Il modello utilizza una combinazione dell'aumento totale dei proprietari dichiarati, delle variazioni nelle allocazioni di portafoglio di tali proprietari e di altre metriche. Il punteggio varia da 0 a 100: i numeri più alti indicano un livello di accumulo superiore ad altre società, mentre 50 rappresenta la media.
Frequenza di aggiornamento: giornaliera
Consulta Ownership Explorer per visualizzare l'elenco delle aziende con il ranking più alto.
AI+ Ask Fintel’s AI assistant about Chunghwa Telecom Co., Ltd. - Depositary Receipt (Common Stock).
Select a question to share a public post with an AI-crafted answer.
Thinking of good questions…
Depositi 13F e NPORT
Le informazioni relative ai depositi 13F sono gratuite. Per accedere alle informazioni relative ai depositi NP è necessario un'abbonamento premium. Le righe verdi indicano le nuove posizioni. Le righe rosse indicano le posizioni chiuse. Fai clic sull'icona del link per visualizzare la cronologia completa delle transazioni.
Esegui l'upgrade
per sbloccare i dati premium ed esportarli in Excel ![]() .
.
| Data di deposito | Fonte | Investitore | Tipo | Prezzo medio (Stima) |
Azioni | Δ Azioni (%) |
Valore dichiarato ($ 1000) |
Δ Valore (%) |
Allocazione del portafoglio (%) |
|
|---|---|---|---|---|---|---|---|---|---|---|
| 2025-09-25 | NP | VEU - Vanguard FTSE All-World ex-US Index Fund ETF Shares | 381.442 | 0,00 | 16.555 | 7,32 | ||||
| 2025-11-14 | 13F | Quantinno Capital Management LP | 173.821 | 34,29 | 7.582 | 25,68 | ||||
| 2025-11-14 | 13F | Public Employees Retirement System Of Ohio | 144.314 | 0,62 | 6.295 | -5,85 | ||||
| 2026-01-28 | 13F | B. Metzler seel. Sohn & Co. AG | 157.095 | 6.554 | ||||||
| 2026-01-26 | 13F | Cwm, Llc | 3.922 | 28,46 | 0 | |||||
| 2025-11-13 | 13F | Renaissance Technologies Llc | 2.807.867 | -2,98 | 122.479 | -9,20 | ||||
| 2025-11-13 | 13F | Wells Fargo & Company/mn | 2.399 | -17,95 | 105 | -23,53 | ||||
| 2025-08-26 | NP | Profunds - Profund Vp Emerging Markets | 6.484 | 9,27 | 302 | 30,17 | ||||
| 2025-09-25 | NP | TIER - T. Rowe Price International Equity Research ETF | 318 | 14 | ||||||
| 2025-11-14 | 13F | Axa S.a. | 0 | -100,00 | 0 | |||||
| 2026-01-15 | 13F | Highline Wealth Partners Llc | 158 | 0,00 | 7 | 0,00 | ||||
| 2025-09-25 | NP | DFA INVESTMENT DIMENSIONS GROUP INC - World ex U.S. Core Equity Portfolio Institutional Class Shares | 3.400 | 0,00 | 148 | 7,30 | ||||
| 2025-09-25 | NP | Dfa Investment Trust Co - The Emerging Markets Series This fund is a listed as child fund of Dimensional Fund Advisors Lp and if that institution has disclosed ownership in this security, then these positions will not be double counted when calculating total shares and total value | 111.161 | 0,00 | 4.824 | 7,32 | ||||
| 2026-01-23 | 13F | Robeco Institutional Asset Management B.V. | 136.807 | 0,00 | 5.706 | -4,37 | ||||
| 2025-11-13 | 13F | Guggenheim Capital Llc | 42.025 | -2,36 | 1.833 | -8,62 | ||||
| 2025-11-14 | 13F | CI Private Wealth, LLC | 32.505 | 6,72 | 1.418 | -0,14 | ||||
| 2026-02-03 | 13F | Sageworth Trust Co | 0 | -100,00 | 0 | |||||
| 2026-01-13 | 13F | Kathmere Capital Management, LLC | 47.392 | -1,34 | 1.977 | -5,68 | ||||
| 2025-11-12 | 13F | Xponance, Inc. | 6.403 | 8,54 | 279 | 1,82 | ||||
| 2025-11-12 | 13F | Barclays Plc | 0 | -100,00 | 0 | |||||
| 2025-11-14 | 13F | United Capital Financial Advisers, Llc | 7.825 | 1,10 | 341 | -5,28 | ||||
| 2026-01-16 | 13F | Ronald Blue Trust, Inc. | 18.157 | -16,17 | 757 | -19,81 | ||||
| 2025-11-10 | 13F | Resources Investment Advisors, LLC. | 7.615 | -1,96 | 332 | -8,29 | ||||
| 2026-02-04 | 13F | D'Orazio & Associates, Inc. | 6.691 | -0,93 | 279 | -5,10 | ||||
| 2026-02-03 | 13F | Ethic Inc. | 83.581 | 21,64 | 3.486 | 16,32 | ||||
| 2026-01-20 | 13F | AdvisorNet Financial, Inc | 142 | 0,00 | 6 | -16,67 | ||||
| 2025-11-14 | 13F | Northern Trust Corp | 727.983 | 3,06 | 31.755 | -3,55 | ||||
| 2025-11-13 | 13F | O'shaughnessy Asset Management, Llc | 112.977 | 5,11 | 4.928 | -1,62 | ||||
| 2025-09-25 | NP | HFIGX - Hartford Schroders Diversified Growth Fund Class I | 3.751 | -1,99 | 163 | 5,19 | ||||
| 2026-02-05 | 13F | Bessemer Group Inc | 11.470 | 4,46 | 0 | |||||
| 2025-11-17 | 13F | GWM Advisors LLC | 166 | 1,84 | 7 | 0,00 | ||||
| 2025-08-11 | 13F | Morling Financial Advisors, LLC | 0 | -100,00 | 0 | |||||
| 2026-01-08 | 13F | True Wealth Design, LLC | 321 | 29,96 | 13 | 30,00 | ||||
| 2026-01-20 | 13F | Signaturefd, Llc | 36.394 | -3,69 | 1.518 | -7,95 | ||||
| 2025-11-12 | 13F | Simplex Trading, Llc | Put | 0 | -100,00 | 0 | ||||
| 2025-11-13 | 13F | Bnp Paribas Arbitrage, Sa | 8.567 | -34,91 | 374 | -39,15 | ||||
| 2025-11-12 | 13F | Simplex Trading, Llc | 0 | -100,00 | 0 | |||||
| 2025-09-29 | NP | AIM INTERNATIONAL MUTUAL FUNDS (INVESCO INTERNATIONAL MUTUAL FUNDS) - Invesco Oppenheimer Global Multi-Asset Growth Fund Class R6 | 10.496 | 65,29 | 456 | 77,73 | ||||
| 2025-11-04 | 13F | High Note Wealth, LLC | 0 | -100,00 | 0 | |||||
| 2025-09-25 | NP | DEXC - Dimensional Emerging Markets ex China Core Equity ETF | 7.000 | 18,64 | 304 | 27,31 | ||||
| 2025-11-12 | 13F | American Century Companies Inc | 371.284 | 12,69 | 16.195 | 5,46 | ||||
| 2025-11-12 | 13F | Allianz Se | 6.083 | 265 | ||||||
| 2026-01-21 | 13F | Yousif Capital Management, Llc | 12.229 | 0,00 | 518 | -2,81 | ||||
| 2025-08-29 | NP | MPLAX - Praxis International Index Fund Class A | 139.043 | -7,55 | 6.481 | 9,89 | ||||
| 2025-11-13 | 13F | Hsbc Holdings Plc | 0 | -100,00 | 0 | |||||
| 2025-11-10 | 13F | Td Asset Management Inc | 533.177 | -18,36 | 23.257 | -23,60 | ||||
| 2025-11-13 | 13F | Natixis Advisors, L.p. | 39.646 | 1,40 | 2 | 0,00 | ||||
| 2026-01-26 | 13F | Mirae Asset Global Investments Co., Ltd. | 6.275 | 218,04 | 262 | 203,49 | ||||
| 2025-08-14 | 13F | Citadel Advisors Llc | Call | 0 | -100,00 | 0 | -100,00 | |||
| 2025-11-03 | 13F | Summit Global Investments | 12.999 | 0,00 | 1 | |||||
| 2026-01-09 | 13F | SG Americas Securities, LLC | 3.115 | 0 | ||||||
| 2025-10-15 | 13F | Private Trust Co Na | 0 | -100,00 | 0 | |||||
| 2025-11-10 | 13F | Rossby Financial, LCC | 25 | 1 | ||||||
| 2025-11-13 | 13F | Parallel Advisors, LLC | 24.456 | 3,52 | 1.067 | -3,18 | ||||
| 2025-11-14 | 13F | National Bank Of Canada /fi/ | 145 | -30,95 | 6 | -33,33 | ||||
| 2025-11-13 | 13F | Vise Technologies, Inc. | 5.588 | 1,60 | 244 | -5,08 | ||||
| 2025-10-31 | 13F | Whittier Trust Co | 0 | -100,00 | 0 | |||||
| 2026-02-03 | 13F/A | Bank Of America Corp /de/ | 339.330 | 9,21 | 14.802 | 2,21 | ||||
| 2025-11-14 | 13F | SRS Capital Advisors, Inc. | 1.027 | 40,88 | 45 | 33,33 | ||||
| 2025-11-14 | 13F | Morgan Stanley | 1.365.343 | 4,95 | 59.556 | -1,78 | ||||
| 2026-01-05 | 13F | GoalVest Advisory LLC | 4 | 0,00 | 0 | |||||
| 2025-11-13 | 13F | GeoWealth Management, LLC | 0 | -100,00 | 0 | -100,00 | ||||
| 2025-09-25 | NP | DFSE - Dimensional Emerging Markets Sustainability Core 1 ETF | 5.574 | 20,83 | 242 | 29,57 | ||||
| 2025-11-14 | 13F | Wellington Management Group Llp | 0 | -100,00 | 0 | |||||
| 2025-11-14 | 13F | Wealthspire Advisors, LLC | 247 | 11 | ||||||
| 2026-02-06 | 13F | Profund Advisors Llc | 9.001 | -5,75 | 375 | -9,86 | ||||
| 2025-11-05 | 13F | Key FInancial Inc | 227 | 0,00 | 10 | -10,00 | ||||
| 2025-11-13 | 13F | Fmr Llc | 49.559 | 3,60 | 2.162 | -3,05 | ||||
| 2025-11-19 | 13F | Caitong International Asset Management Co., Ltd | 8 | 0 | ||||||
| 2025-11-14 | 13F | Jane Street Group, Llc | 22.424 | 978 | ||||||
| 2025-11-13 | 13F | Riggs Asset Managment Co. Inc. | 0 | -100,00 | 0 | |||||
| 2025-11-12 | 13F | First Trust Advisors Lp | 98.929 | 342,22 | 4.315 | 314,11 | ||||
| 2026-01-12 | 13F | Foster Group, Inc. | 10.039 | -18,01 | 419 | -21,72 | ||||
| 2025-10-30 | 13F | Twin Peaks Wealth Advisors, LLC | 0 | -100,00 | 0 | |||||
| 2025-11-12 | 13F | West Family Investments, Inc. | 48.077 | 0,43 | 2.097 | -6,01 | ||||
| 2025-11-17 | 13F | Morningstar Investment Management LLC | 0 | -100,00 | 0 | |||||
| 2025-11-10 | 13F | Atomi Financial Group, Inc. | 9.802 | 2,63 | 428 | -4,04 | ||||
| 2025-11-13 | 13F | Legal & General Group Plc | 1.240 | 0,00 | 54 | -5,26 | ||||
| 2025-09-25 | NP | DFEM - Dimensional Emerging Markets Core Equity 2 ETF | 51.212 | 34,10 | 2.223 | 43,91 | ||||
| 2025-11-26 | 13F/A | Jpmorgan Chase & Co | 713 | 32,04 | 31 | 24,00 | ||||
| 2025-08-14 | 13F | Boston Private Wealth Llc | 0 | -100,00 | 0 | |||||
| 2025-11-13 | 13F | Marshall Wace, Llp | 40.985 | -5,64 | 1.788 | -11,71 | ||||
| 2025-11-14 | 13F | Driehaus Capital Management Llc | 36.471 | 0,00 | 1.591 | -6,42 | ||||
| 2025-11-07 | 13F | Mondrian Investment Partners LTD | 226.153 | 12,43 | 9.865 | 25,07 | ||||
| 2025-11-06 | 13F | Advisors Asset Management, Inc. | 11.231 | 202,64 | 490 | 184,30 | ||||
| 2025-11-12 | 13F | NewSquare Capital LLC | 0 | -100,00 | 0 | -100,00 | ||||
| 2026-01-12 | 13F | Abound Wealth Management | 38 | 18,75 | 2 | 0,00 | ||||
| 2025-11-14 | 13F | Advisor Group Holdings, Inc. | 4.192 | -0,07 | 183 | -6,67 | ||||
| 2026-02-03 | 13F | Sequoia Financial Advisors, LLC | 35.278 | -12,84 | 1.471 | -16,66 | ||||
| 2025-11-18 | 13F | Advisory Services Network, LLC | 59 | 3 | ||||||
| 2025-11-14 | 13F | Brevan Howard Capital Management LP | 7.653 | 334 | ||||||
| 2025-11-12 | 13F | Brinker Capital Investments, LLC | 55.730 | -0,50 | 2.431 | -6,90 | ||||
| 2025-10-28 | 13F | BRYN MAWR TRUST Co | 78 | 0,00 | 3 | 0,00 | ||||
| 2025-08-12 | 13F | XTX Topco Ltd | 0 | -100,00 | 0 | |||||
| 2025-10-03 | 13F | Aaron Wealth Advisors LLC | 0 | -100,00 | 0 | |||||
| 2025-11-13 | 13F | Sei Investments Co | 40.588 | -33,50 | 1.770 | -37,76 | ||||
| 2025-09-25 | NP | DFA INVESTMENT DIMENSIONS GROUP INC - Emerging Markets Social Core Equity Portfolio Shares | 12.202 | 0,00 | 530 | 7,30 | ||||
| 2025-10-30 | 13F | Simplicity Wealth,LLC | 0 | -100,00 | 0 | |||||
| 2025-08-13 | 13F | Townsquare Capital Llc | 0 | -100,00 | 0 | -100,00 | ||||
| 2025-08-12 | 13F | Proequities, Inc. | Put | 0 | 0 | |||||
| 2025-08-12 | 13F | Proequities, Inc. | Call | 0 | 0 | |||||
| 2025-11-19 | 13F | Coldstream Capital Management Inc | 6.055 | 264 | ||||||
| 2025-08-12 | 13F | Proequities, Inc. | 0 | 0 | ||||||
| 2026-02-06 | 13F | HighTower Advisors, LLC | 5.784 | 241 | ||||||
| 2025-11-13 | 13F | Connor, Clark & Lunn Investment Management Ltd. | 1.185.031 | -5,45 | 51.691 | -11,51 | ||||
| 2025-08-27 | 13F/A | Squarepoint Ops LLC | 0 | -100,00 | 0 | -100,00 | ||||
| 2026-01-30 | 13F | Ares Financial Consulting, LLC | 30 | 1 | ||||||
| 2025-11-12 | 13F | Steward Partners Investment Advisory, Llc | 144 | 0,00 | 6 | 0,00 | ||||
| 2025-11-13 | 13F | Russell Investments Group, Ltd. | 32 | 0,00 | 1 | 0,00 | ||||
| 2025-11-14 | 13F | Rockefeller Capital Management L.P. | 155 | 7 | ||||||
| 2025-10-21 | 13F | Simon Quick Advisors, Llc | 0 | -100,00 | 0 | -100,00 | ||||
| 2025-08-14 | 13F | D. E. Shaw & Co., Inc. | 0 | -100,00 | 0 | -100,00 | ||||
| 2026-02-03 | 13F | SBI Securities Co., Ltd. | 474 | 0,00 | 20 | -5,00 | ||||
| 2025-08-27 | NP | THRIVENT SERIES FUND INC - Thrivent International Allocation Portfolio Class A | 5.226 | 116,94 | 244 | 158,51 | ||||
| 2026-02-05 | 13F | May Hill Capital, LLC | 6.396 | 267 | ||||||
| 2025-09-24 | NP | EMQAX - Ashmore Emerging Markets Active Equity Fund CLASS A | 7.097 | 308 | ||||||
| 2025-11-14 | 13F | Millennium Management Llc | 67.113 | 921,51 | 2.927 | 856,54 | ||||
| 2025-08-14 | 13F | Citadel Advisors Llc | Put | 0 | -100,00 | 0 | -100,00 | |||
| 2025-11-13 | 13F | Bank Of Montreal /can/ | 37.558 | 4,82 | 1.638 | -1,92 | ||||
| 2025-11-14 | 13F | Vident Advisory, LLC | 128.045 | 16,57 | 5.585 | 9,10 | ||||
| 2025-11-14 | 13F | Mml Investors Services, Llc | 13.845 | 19,20 | 604 | |||||
| 2025-09-25 | NP | Thrivent Core Funds - Thrivent Core Emerging Markets Equity Fund | 34.021 | 255,27 | 1.477 | 281,40 | ||||
| 2026-02-03 | 13F | Navigoe, LLC | 39 | 0,00 | 0 | |||||
| 2025-10-31 | 13F | JustInvest LLC | 129.205 | 9,07 | 5.636 | 2,06 | ||||
| 2025-11-14 | 13F | Verition Fund Management LLC | 19.916 | 171,41 | 869 | 153,80 | ||||
| 2026-01-26 | 13F | Harbor Asset Planning, Inc. | 167 | 0,00 | 7 | -14,29 | ||||
| 2026-01-29 | 13F | UMA Financial Services, Inc. | 533 | -8,26 | 22 | -12,00 | ||||
| 2025-09-25 | NP | DFCEX - Emerging Markets Core Equity Portfolio - Institutional Class This fund is a listed as child fund of Dimensional Fund Advisors Lp and if that institution has disclosed ownership in this security, then these positions will not be double counted when calculating total shares and total value | 64.400 | 0,00 | 2.795 | 7,33 | ||||
| 2025-11-07 | 13F | Syon Capital Llc | 8.937 | 82,16 | 390 | 70,61 | ||||
| 2026-02-03 | 13F | Gallacher Capital Management LLC | 9.153 | -20,44 | 382 | -23,95 | ||||
| 2025-11-14 | 13F | State Street Corp | 78.573 | 5,44 | 3.427 | -1,32 | ||||
| 2025-11-06 | 13F | Ameritas Advisory Services, LLC | 0 | -100,00 | 0 | -100,00 | ||||
| 2026-02-06 | 13F | Global Retirement Partners, LLC | 5.022 | 209 | ||||||
| 2025-11-04 | 13F | Jones Financial Companies Lllp | 110 | -74,48 | 5 | -80,00 | ||||
| 2025-11-21 | 13F | Bell Investment Advisors, Inc | 458 | 0,66 | 20 | -9,52 | ||||
| 2026-01-23 | 13F | Farther Finance Advisors, LLC | 4.225 | 387,88 | 176 | 375,68 | ||||
| 2025-11-14 | 13F | Ieq Capital, Llc | 51.053 | 79,62 | 2.227 | 68,13 | ||||
| 2025-11-14 | 13F | Binnacle Investments Inc | 302 | 0,00 | 13 | -7,14 | ||||
| 2025-11-13 | 13F | Glenmede Investment Management, LP | 0 | -100,00 | 0 | |||||
| 2025-09-26 | NP | HAOSX - Harbor Overseas Fund Institutional Class | 9.461 | 17,15 | 411 | 25,77 | ||||
| 2025-08-29 | NP | John Hancock Hedged Equity & Income Fund | 15.087 | 703 | ||||||
| 2025-10-28 | 13F | Campbell & CO Investment Adviser LLC | 19.645 | -26,99 | 857 | -31,74 | ||||
| 2025-09-25 | NP | DFAX - Dimensional World ex U.S. Core Equity 2 ETF | 7.515 | 0,00 | 326 | 7,59 | ||||
| 2025-11-07 | 13F | Sierra Ocean, Llc | 0 | -100,00 | 0 | -100,00 | ||||
| 2025-11-14 | 13F | Two Sigma Investments, Lp | 19.846 | 866 | ||||||
| 2025-10-31 | 13F | Whittier Trust Co Of Nevada Inc | 0 | -100,00 | 0 | -100,00 | ||||
| 2026-01-29 | 13F | UBS Group AG | 25.056 | -41,45 | 1.045 | -44,00 | ||||
| 2025-11-05 | 13F | Hantz Financial Services, Inc. | 3.907 | 365,12 | 0 | |||||
| 2025-11-13 | 13F | Pathstone Holdings, LLC | 43.124 | -1,76 | 1.881 | -8,06 | ||||
| 2026-01-27 | 13F | Evergreen Capital Management Llc | 0 | -100,00 | 0 | |||||
| 2025-11-14 | 13F | Principal Street Partners, LLC | 0 | -100,00 | 0 | |||||
| 2026-01-30 | 13F | CBOE Vest Financial, LLC | 5.423 | 226 | ||||||
| 2025-11-13 | 13F | Acadian Asset Management Llc | 436.258 | -23,80 | 19 | -26,92 | ||||
| 2025-09-25 | NP | VEIEX - Vanguard Emerging Markets Stock Index Fund Investor Shares | 1.176.664 | 0,00 | 51.067 | 7,32 | ||||
| 2026-02-04 | 13F | Drive Wealth Management, Llc | 7.465 | -14,01 | 311 | -17,72 | ||||
| 2026-02-05 | 13F | Tucker Asset Management Llc | 53 | 2 | ||||||
| 2026-01-05 | 13F | GAMMA Investing LLC | 8.396 | -11,13 | 350 | -15,05 | ||||
| 2025-08-28 | NP | CWI - SPDR(R) MSCI ACWI EX-US ETF | 47.194 | 0,35 | 2.200 | 19,25 | ||||
| 2026-02-06 | 13F | EverSource Wealth Advisors, LLC | 8.109 | -5,46 | 338 | -9,63 | ||||
| 2025-11-13 | 13F | Arrowstreet Capital, Limited Partnership | 134.412 | -54,85 | 5.863 | -57,74 | ||||
| 2026-02-06 | 13F | Bare Financial Services, Inc | 215 | 0,00 | 9 | -11,11 | ||||
| 2026-02-06 | 13F | Larson Financial Group LLC | 1.540 | -2,90 | 64 | -7,25 | ||||
| 2026-01-30 | 13F | R Squared Ltd | 27.964 | 18,89 | 1.166 | 13,76 | ||||
| 2026-02-06 | 13F | Pnc Financial Services Group, Inc. | 28.791 | 23,42 | 1.201 | 17,99 | ||||
| 2026-01-29 | 13F | Deltec Asset Management Llc | 10.398 | 0,00 | 434 | -4,42 | ||||
| 2025-08-27 | NP | THRIVENT SERIES FUND INC - Thrivent Partner Emerging Markets Equity Portfolio Class A | 2.214 | 107,11 | 103 | 151,22 | ||||
| 2025-09-24 | NP | SNTKX - Steward International Enhanced Index Fund Class A | 17.653 | -60,42 | 766 | -57,52 | ||||
| 2025-10-29 | 13F | Root Financial Partners, LLC | 22 | 1 | ||||||
| 2025-08-28 | NP | SPGM - SPDR(R) Portfolio MSCI Global Stock Market ETF | 21.889 | 2,96 | 1.020 | 22,45 | ||||
| 2026-02-06 | 13F | IFP Advisors, Inc | 103 | 0,00 | 4 | 0,00 | ||||
| 2025-11-10 | 13F | Advyzon Investment Management, LLC | 4.774 | 208 | ||||||
| 2026-01-29 | 13F | Vanguard Group Inc | 1.972.894 | -2,51 | 82.289 | -6,78 | ||||
| 2026-02-03 | 13F | Crossmark Global Holdings, Inc. | 57.970 | -18,76 | 2.418 | -22,33 | ||||
| 2025-11-14 | 13F | Lido Advisors, LLC | 7.566 | 330 | ||||||
| 2025-11-13 | 13F | EntryPoint Capital, LLC | 5.790 | 253 | ||||||
| 2026-01-16 | 13F | Augustine Asset Management Inc | 17.659 | 0,00 | 737 | -4,42 | ||||
| 2026-01-27 | 13F/A | Capital Performance Advisors Llp | 5.573 | -10,66 | 232 | -14,71 | ||||
| 2025-11-12 | 13F | BlackRock, Inc. | 3.130.560 | 16,83 | 136.555 | 9,34 | ||||
| 2025-11-06 | 13F | Wealthstream Advisors, Inc. | 5.844 | 15,20 | 255 | 7,63 | ||||
| 2025-11-12 | 13F | Principal Securities, Inc. | 30 | 1 | ||||||
| 2026-01-16 | 13F | Crewe Advisors LLC | 194 | 0,00 | 8 | 0,00 | ||||
| 2025-08-14 | 13F | Two Sigma Advisers, Lp | 0 | -100,00 | 0 | |||||
| 2025-11-14 | 13F | Royal Bank Of Canada | 1.528 | 16,82 | 68 | 11,48 | ||||
| 2026-01-06 | 13F | Fulcrum Equity Management | 5.374 | 0,00 | 224 | -4,27 | ||||
| 2025-10-30 | 13F | Parkside Financial Bank & Trust | 296 | 0,00 | 13 | -7,69 | ||||
| 2025-11-10 | 13F | Citigroup Inc | 18.042 | 29,43 | 787 | 21,11 | ||||
| 2025-09-26 | NP | UUPIX - Ultraemerging Markets Profund Investor Class | 1.853 | 16,54 | 80 | 25,00 | ||||
| 2026-01-23 | 13F | Lester Murray Antman dba SimplyRich | 14.885 | 0,00 | 1 | |||||
| 2026-01-15 | 13F | Frank, Rimerman Advisors LLC | 0 | -100,00 | 0 | |||||
| 2025-11-14 | 13F | AXA Investment Managers S.A. | 14.848 | 648 | ||||||
| 2025-11-12 | 13F | Geode Capital Management, Llc | 4.734 | 206 | ||||||
| 2026-01-14 | 13F | Generali Investments CEE, investicni spolecnost, a.s. | 11.429 | -32,49 | 477 | -35,50 | ||||
| 2025-11-13 | 13F | Deutsche Bank Ag\ | 29.521 | 0,00 | 1.288 | -6,40 | ||||
| 2025-11-13 | 13F | Invesco Ltd. | 14.042 | 36,09 | 613 | 27,50 | ||||
| 2025-11-14 | 13F | Creative Planning | 380.892 | 20,02 | 16.615 | 12,32 | ||||
| 2026-01-20 | 13F | Ascent Group, LLC | 20.269 | -6,84 | 845 | -10,96 | ||||
| 2025-11-14 | 13F | Colony Group, LLC | 3.280 | 420 | ||||||
| 2026-02-03 | 13F | Ballentine Partners, LLC | 32.213 | -17,55 | 1.344 | -21,19 | ||||
| 2026-02-04 | 13F | Tsfg, Llc | 98 | 0,00 | 0 | |||||
| 2025-11-04 | 13F | Hazlett, Burt & Watson, Inc. | 250 | 0,00 | 0 | |||||
| 2026-01-22 | 13F | Financial Consulate, Inc | 33 | 1 | ||||||
| 2025-09-29 | NP | SPWO - SP Funds S&P World (ex-US) ETF | 5.043 | 41,14 | 219 | 51,39 | ||||
| 2025-11-05 | 13F | Smartleaf Asset Management LLC | 1.133 | 0,00 | 49 | -7,55 | ||||
| 2025-11-14 | 13F | Goldman Sachs Group Inc | 219.928 | -14,18 | 9.593 | -19,68 | ||||
| 2025-10-22 | 13F | Geneos Wealth Management Inc. | 0 | -100,00 | 0 | |||||
| 2025-11-20 | 13F | First Affirmative Financial Network | 33.932 | 4,23 | 1.480 | -2,44 | ||||
| 2025-09-25 | NP | VMNVX - Vanguard Global Minimum Volatility Fund Admiral Shares | 114.346 | 0,00 | 4.963 | 7,31 | ||||
| 2025-11-12 | 13F | Dimensional Fund Advisors Lp | 476.602 | 5,21 | 20.790 | -1,58 | ||||
| 2025-11-12 | 13F | Modern Wealth Management, LLC | 5.455 | -9,22 | 238 | -15,36 | ||||
| 2025-09-25 | NP | DAADX - Emerging Markets ex China Core Equity Portfolio Institutional Class | 18.891 | 0,00 | 820 | 7,34 | ||||
| 2025-11-13 | 13F | Quadrant Capital Group Llc | 64.263 | 31,57 | 2.803 | 23,15 | ||||
| 2026-01-15 | 13F | Trust Co | 26 | 1 | ||||||
| 2025-10-16 | 13F | Hoese & Co LLP | 0 | -100,00 | 0 | |||||
| 2026-01-22 | 13F | V-Square Quantitative Management LLC | 4.065 | 170 | ||||||
| 2025-09-25 | NP | TWAAX - Thrivent International Allocation Fund Class A | 4.613 | 254,30 | 200 | 284,62 | ||||
| 2025-10-10 | 13F | Putnam Fl Investment Management Co | 4.951 | -33,78 | 216 | -38,22 | ||||
| 2025-10-20 | 13F | Sivia Capital Partners, LLC | 7.484 | -3,46 | 326 | -9,70 | ||||
| 2025-11-07 | 13F | Texas Yale Capital Corp. | 9.000 | 0,00 | 393 | -6,44 | ||||
| 2026-01-08 | 13F | Wealth Enhancement Advisory Services, Llc | 6.274 | 261 | ||||||
| 2025-11-10 | 13F | MAI Capital Management | 1.274 | -67,32 | 56 | -69,61 | ||||
| 2025-11-13 | 13F | Brown Brothers Harriman & Co | 0 | -100,00 | 0 | |||||
| 2025-09-25 | NP | VGTSX - Vanguard Total International Stock Index Fund Investor Shares | 277.613 | 0,00 | 12.048 | 7,32 | ||||
| 2026-01-26 | 13F | PDS Planning, Inc | 15.045 | -5,82 | 628 | -9,91 | ||||
| 2026-02-05 | 13F | Allworth Financial LP | 2.673 | 7,26 | 111 | 2,78 | ||||
| 2025-11-13 | 13F | Kayne Anderson Rudnick Investment Management Llc | 14.515 | -0,32 | 633 | -6,64 | ||||
| 2025-11-14 | 13F | Citadel Advisors Llc | 20.864 | -34,68 | 910 | -38,84 | ||||
| 2025-08-12 | 13F | Atlas Capital Advisors Llc | 199 | 0,00 | 9 | 28,57 | ||||
| 2025-11-14 | 13F | Aquatic Capital Management LLC | 15.829 | 690 | ||||||
| 2025-09-25 | NP | ITTAX - Hartford Multi-Asset Income and Growth Fund Class A | 24.401 | 1.059 | ||||||
| 2026-02-04 | 13F | Abc Arbitrage Sa | 0 | -100,00 | 0 | |||||
| 2026-01-05 | 13F | Rosenberg Matthew Hamilton | 397 | 0,00 | 17 | -5,88 | ||||
| 2025-11-14 | 13F/A | Skopos Labs, Inc. | 4.591 | 0,00 | 215 | 0,94 | ||||
| 2026-01-28 | 13F | CAPROCK Group, Inc. | 8.094 | -32,56 | 338 | -35,44 | ||||
| 2025-09-25 | NP | DFAE - Dimensional Emerging Core Equity Market ETF | 100.100 | 13,75 | 4.344 | 22,09 | ||||
| 2025-11-14 | 13F | Tower Research Capital LLC (TRC) | 71 | 47,92 | 3 | 50,00 | ||||
| 2025-11-06 | 13F | Rhumbline Advisers | 218.271 | -5,18 | 9.521 | -11,27 | ||||
| 2026-01-23 | 13F | Bridgewater Advisors Inc. | 9.665 | 0,52 | 409 | 1,74 | ||||
| 2026-01-30 | 13F | Us Bancorp \de\ | 40.486 | -3,26 | 1.689 | -7,51 | ||||
| 2025-08-27 | NP | RYWTX - Emerging Markets 2x Strategy Fund Class A | 2.021 | 143,79 | 94 | 193,75 | ||||
| 2026-01-14 | 13F | Jfs Wealth Advisors, Llc | 280 | 4,87 | 12 | 0,00 | ||||
| 2025-11-05 | 13F | Savant Capital, LLC | 29.705 | 0,05 | 1.296 | -6,36 | ||||
| 2025-11-12 | 13F | Neuberger Berman Group LLC | 80.887 | 2,08 | 3.530 | -4,65 | ||||
| 2026-01-27 | 13F | WealthCollab, LLC | 291 | 0,00 | 12 | 0,00 | ||||
| 2026-01-23 | 13F | Westside Investment Management, Inc. | 1.491 | 3,69 | 62 | -1,59 | ||||
| 2026-01-15 | 13F | Nisa Investment Advisors, Llc | 94 | 4 | ||||||
| 2025-11-13 | 13F | Schroder Investment Management Group | 621.357 | -7,99 | 27.128 | -13,81 | ||||
| 2025-10-22 | 13F | Cerity Partners LLC | 67.558 | -5,90 | 2.947 | -11,95 | ||||
| 2026-02-05 | 13F | Northwestern Mutual Wealth Management Co | 46 | -86,74 | 4 | -73,33 | ||||
| 2026-01-28 | 13F | HB Wealth Management, LLC | 5.727 | 22,63 | 239 | 17,24 | ||||
| 2025-11-14 | 13F | DZ BANK AG Deutsche Zentral Genossenschafts Bank, Frankfurt am Main | 145.000 | 0,00 | 6.325 | -6,42 | ||||
| 2025-11-14 | 13F | Wetherby Asset Management Inc | 32.076 | 1,34 | 1.399 | -5,15 | ||||
| 2026-01-23 | 13F | BSW Wealth Partners | 5.142 | 214 | ||||||
| 2025-11-14 | 13F | Aqr Capital Management Llc | 22.813 | -3,64 | 995 | -9,79 | ||||
| 2026-01-08 | 13F | Tuttle Tactical Management LLC | 12.184 | 508 | ||||||
| 2025-11-14 | 13F | Mercer Global Advisors Inc /adv | 8.158 | 9,80 | 356 | 2,60 | ||||
| 2026-01-16 | 13F | Empirical Financial Services, LLC d.b.a. Empirical Wealth Management | 8.131 | 339 | ||||||
| 2026-01-22 | 13F | Venturi Wealth Management, LLC | 8.570 | 23,06 | 357 | 17,82 | ||||
| 2025-11-24 | 13F | CIBC Private Wealth Group, LLC | 584 | 65,91 | 25 | 56,25 | ||||
| 2026-01-23 | 13F | Assetmark, Inc | 329 | 6,47 | 14 | 0,00 | ||||
| 2026-02-05 | 13F | Thrivent Financial For Lutherans | 62.730 | 0,00 | 3 | 0,00 | ||||
| 2025-11-14 | 13F | Ameriprise Financial Inc | 209.213 | -3,66 | 7.588 | -10,11 | ||||
| 2025-11-14 | 13F | Mariner, LLC | 28.085 | -2,82 | 1.225 | -9,06 | ||||
| 2025-09-25 | NP | VT - Vanguard Total World Stock Index Fund ETF Shares | 81.784 | 0,00 | 3.549 | 7,32 | ||||
| 2026-02-03 | 13F | Crestwood Advisors Group LLC | 5.489 | 229 |
Other Listings
| US:CHT | 41,57 USD |