Statistiche di base
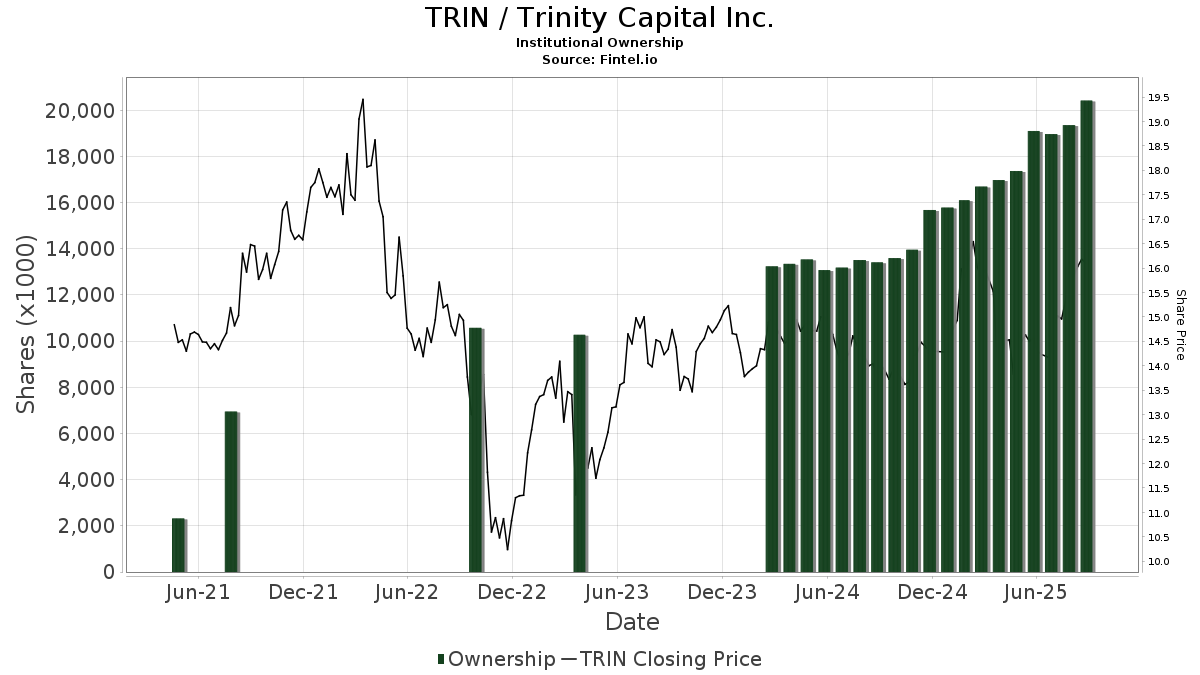
| Azioni istituzionali (Long) | 20.326.095 - 28,91% (ex 13D/G) - change of 1,22MM shares 6,40% MRQ |
| Valore istituzionale (Long) | $ 283.327 USD ($1000) |
Proprietà istituzionale e azionisti
Trinity Capital Inc. (US:TRIN) ha 154 proprietari istituzionali e azionisti che hanno presentato i moduli 13D/G o 13F alla Securities Exchange Commission (SEC). Queste istituzioni detengono un totale di 20,326,095 azioni. I maggiori azionisti includono Van Eck Associates Corp, BIZD - VanEck Vectors BDC Income ETF, Melia Wealth LLC, Rockefeller Capital Management L.P., Invesco Ltd., Emerald Advisers, Llc, KBWD - Invesco KBW High Dividend Yield Financial ETF, QVT Financial LP, Two Sigma Advisers, Lp, and UBS Group AG .
(Trinity Capital Inc. (NasdaqGS:TRIN) la struttura proprietaria istituzionale mostra le attuali posizioni nella società da parte di istituzioni e fondi, nonché le ultime variazioni nella dimensione della posizione. I principali azionisti possono essere singoli investitori, fondi comuni, hedge fund o istituzioni. L'allegato 13D indica che l'investitore detiene (o ha detenuto) più del 5% della società e intende (o intendeva) perseguire attivamente un cambiamento nella strategia aziendale. L'allegato 13G indica un investimento passivo superiore al 5%.
The share price as of September 5, 2025 is 16,23 / share. Previously, on September 9, 2024, the share price was 13,88 / share. This represents an increase of 16,93% over that period.
Indice del sentiment dei fondi
L'indice del sentiment dei fondi (anche noto come "indice di accumulo di proprietà") individua i titoli più acquistati dai fondi. È il risultato di un sofisticato modello quantitativo multi-fattore che identifica le società con i più alti livelli di accumulo istituzionale. Il modello utilizza una combinazione dell'aumento totale dei proprietari dichiarati, delle variazioni nelle allocazioni di portafoglio di tali proprietari e di altre metriche. Il punteggio varia da 0 a 100: i numeri più alti indicano un livello di accumulo superiore ad altre società, mentre 50 rappresenta la media.
Frequenza di aggiornamento: giornaliera
Consulta Ownership Explorer per visualizzare l'elenco delle aziende con il ranking più alto.
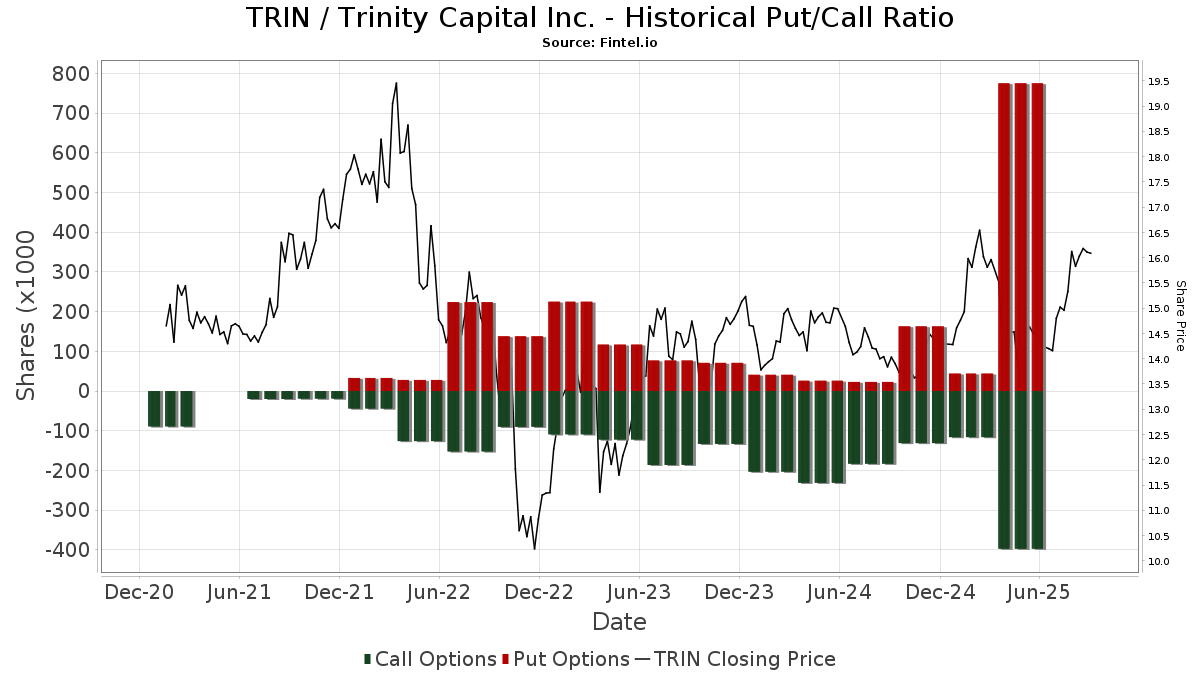
Rapporto put/call istituzionale
Oltre a segnalare le emissioni standard di titoli azionari e di debito, gli istituti con più di 100 milioni di asset in gestione devono anche dichiarare le loro partecipazioni in opzioni put e call. Poiché le opzioni put indicano generalmente un sentiment negativo e le opzioni call un sentiment positivo, possiamo avere un'idea del sentiment istituzionale complessivo attraverso il rapporto tra put e call. Il grafico a destra mostra il rapporto storico put/call per questo strumento.
L'utilizzo del rapporto put/call come indicatore del sentiment degli investitori consente di superare una delle principali lacune dell'utilizzo della proprietà istituzionale totale, ovvero il fatto che una quantità significativa di asset in gestione viene investita passivamente per seguire gli indici. Generalmente, i fondi a gestione passiva non acquistano opzioni, per cui il rapporto put/call riflette più fedelmente il sentiment dei fondi a gestione attiva.
Depositi 13D/G
Presentiamo i depositi 13D/G separatamente dai depositi 13F a causa del diverso trattamento da parte della SEC. I depositi 13D/G possono essere presentati da gruppi di investitori (con un unico leader), mentre i depositi 13F no. Ciò comporta situazioni in cui un investitore può depositare un documento 13D/G riportando un valore per il totale delle azioni (che rappresenta tutte le azioni possedute dal gruppo di investitori), e poi depositare un documento 13F riportando un valore diverso per il totale delle azioni (che rappresenta esclusivamente la propria proprietà). Ciò significa che la proprietà delle azioni nei depositi 13D/G e nei depositi 13F spesso non sono direttamente comparabili, pertanto le presentiamo separatamente.
Nota: a partire dal 16 maggio 2021, non mostriamo più i proprietari che non hanno depositato un documento 13D/G nellultimo anno. In precedenza, mostravamo lintero storico dei depositi 13D/G. In generale, le entità che sono tenute a depositare i documenti 13D/G devono farlo almeno una volta all'anno prima di presentare un deposito di chiusura. Tuttavia, a volte i fondi escono dalle posizioni senza presentare un deposito di chiusura (cioè, procedono a una liquidazione), per cui la visualizzazione dell'intero storico a volte generava confusione sull'attuale proprietà. Per evitare confusione, ora mostriamo solo i proprietari "attuali", ossia quelli che hanno effettuato un deposito nell'ultimo anno.
Upgrade to unlock premium data.
| Data di deposito | Modulo | Investitore | Azioni precedenti |
Ultime azioni |
Δ Azioni (Percentuale) |
Proprietà (Percentuale) |
Δ Proprietà (Percentuale) |
|
|---|---|---|---|---|---|---|---|---|
| 2025-02-27 | Eagle Point Credit Management LLC | 3,336,668 | 360,475 | -89.20 | 0.60 | -96.13 |
Depositi 13F e NPORT
Le informazioni relative ai depositi 13F sono gratuite. Per accedere alle informazioni relative ai depositi NP è necessario un'abbonamento premium. Le righe verdi indicano le nuove posizioni. Le righe rosse indicano le posizioni chiuse. Fai clic sull'icona del link per visualizzare la cronologia completa delle transazioni.
Esegui l'upgrade
per sbloccare i dati premium ed esportarli in Excel ![]() .
.
| Data di deposito | Fonte | Investitore | Tipo | Prezzo medio (Stima) |
Azioni | Δ Azioni (%) |
Valore dichiarato ($ 1000) |
Δ Valore (%) |
Allocazione del portafoglio (%) |
|
|---|---|---|---|---|---|---|---|---|---|---|
| 2025-08-06 | 13F | Round Rock Advisors, LLC | 580.619 | 8,95 | 8.169 | 1,11 | ||||
| 2025-07-31 | 13F | Oppenheimer & Co Inc | 30.390 | 15,50 | 428 | 7,29 | ||||
| 2025-08-06 | 13F | First Horizon Advisors, Inc. | 2.289 | 32 | ||||||
| 2025-08-13 | 13F | Invesco Ltd. | 838.194 | 2,66 | 11.793 | -4,72 | ||||
| 2025-06-25 | NP | HSSAX - Emerald Banking and Finance Fund Class A | 59.403 | 0,00 | 863 | -4,96 | ||||
| 2025-08-13 | 13F | Texas Capital Bank Wealth Management Services Inc | 22.066 | -48,84 | 310 | -52,53 | ||||
| 2025-03-28 | NP | DVDN - Kingsbarn Dividend Opportunity ETF | 3.879 | 59 | ||||||
| 2025-08-14 | 13F | Tudor Investment Corp Et Al | 20.077 | 36,31 | 282 | 26,46 | ||||
| 2025-08-13 | 13F | Legacy Capital Wealth Partners, LLC | 89.257 | -3,08 | 1.256 | -10,10 | ||||
| 2025-06-18 | NP | Putnam ETF Trust - Putnam BDC ETF - | 419.126 | 49,49 | 6.090 | 41,97 | ||||
| 2025-08-06 | 13F | Commonwealth Equity Services, Llc | 138.248 | 16,22 | 2 | 0,00 | ||||
| 2025-08-01 | 13F | Y-Intercept (Hong Kong) Ltd | 151.828 | 2.136 | ||||||
| 2025-08-14 | 13F | Kovitz Investment Group Partners, LLC | 18.553 | -4,07 | 271 | -7,85 | ||||
| 2025-08-13 | 13F | Townsquare Capital Llc | 0 | -100,00 | 0 | |||||
| 2025-07-28 | 13F | Axxcess Wealth Management, Llc | 0 | -100,00 | 0 | |||||
| 2025-08-12 | 13F | Advisors Asset Management, Inc. | 268.699 | 40,29 | 3.781 | 30,21 | ||||
| 2025-08-01 | 13F | Envestnet Asset Management Inc | 54.411 | 0,25 | 766 | -6,93 | ||||
| 2025-05-15 | 13F | CAPROCK Group, Inc. | 21.000 | 329 | ||||||
| 2025-07-30 | 13F | D.a. Davidson & Co. | 20.590 | 95,39 | 290 | 81,76 | ||||
| 2025-08-14 | 13F | Jane Street Group, Llc | Put | 0 | -100,00 | 0 | ||||
| 2025-08-14 | 13F | Ameriprise Financial Inc | 296.212 | 6,31 | 4.157 | -1,59 | ||||
| 2025-08-14 | 13F | Vident Advisory, LLC | 46.640 | 109,91 | 656 | 95,24 | ||||
| 2025-07-08 | 13F/A | Salem Investment Counselors Inc | 500 | 7 | ||||||
| 2025-08-12 | 13F | CIBC Private Wealth Group, LLC | 2.253 | 0,00 | 32 | 3,33 | ||||
| 2025-08-15 | 13F | Morgan Stanley | 276.839 | 48,85 | 3.895 | 38,17 | ||||
| 2025-07-01 | 13F | Confluence Investment Management Llc | 59.052 | 0,01 | 831 | -7,26 | ||||
| 2025-07-18 | 13F | PFG Investments, LLC | 13.129 | -0,57 | 185 | -8,00 | ||||
| 2025-08-13 | 13F | ExodusPoint Capital Management, LP | 0 | -100,00 | 0 | |||||
| 2025-08-13 | 13F | Kennedy Capital Management, Inc. | 265.864 | 8,56 | 3.741 | 0,75 | ||||
| 2025-08-14 | 13F | Bank Of America Corp /de/ | 188.121 | 67,64 | 2.647 | 55,56 | ||||
| 2025-05-15 | 13F | Mariner, LLC | 0 | -100,00 | 0 | |||||
| 2025-08-14 | 13F | Jane Street Group, Llc | Call | 10.300 | 1,98 | 145 | -5,88 | |||
| 2025-08-14 | 13F | Jane Street Group, Llc | 19.186 | 270 | ||||||
| 2025-08-12 | 13F | Jpmorgan Chase & Co | 3.843 | 54 | ||||||
| 2025-08-22 | NP | Eagle Point Enhanced Income Trust | 74.896 | 1.054 | ||||||
| 2025-08-06 | 13F | Smh Capital Advisors Inc | 135.485 | -0,39 | 1.906 | -7,52 | ||||
| 2025-08-12 | 13F | Hillsdale Investment Management Inc. | 0 | -100,00 | 0 | |||||
| 2025-08-14 | 13F | Millennium Management Llc | 491.727 | 34,99 | 6.919 | 25,28 | ||||
| 2025-08-13 | 13F | Beacon Pointe Advisors, LLC | 52.400 | 737 | ||||||
| 2025-08-14 | 13F | Aquatic Capital Management LLC | 27.140 | -39,77 | 382 | -44,22 | ||||
| 2025-07-31 | 13F | MQS Management LLC | 10.114 | 142 | ||||||
| 2025-07-18 | 13F | Trust Co Of Vermont | 1.400 | -79,86 | 20 | -81,90 | ||||
| 2025-08-14 | 13F | UBS Group AG | 591.316 | 30,47 | 8.320 | 21,09 | ||||
| 2025-08-14 | 13F | Schonfeld Strategic Advisors LLC | 15.332 | 216 | ||||||
| 2025-07-10 | 13F | Moody National Bank Trust Division | 18.537 | 1,12 | 261 | -6,14 | ||||
| 2025-07-10 | 13F | Wealth Enhancement Advisory Services, Llc | 16.524 | 22,60 | 236 | 15,69 | ||||
| 2025-05-15 | 13F | Concentric Capital Strategies, LP | 0 | -100,00 | 0 | |||||
| 2025-08-13 | 13F | Russell Investments Group, Ltd. | 25 | -92,82 | 0 | -100,00 | ||||
| 2025-09-04 | 13F/A | Advisor Group Holdings, Inc. | 60.877 | 49,63 | 857 | 38,74 | ||||
| 2025-08-14 | 13F | McIlrath & Eck, LLC | 4.186 | 0,00 | 59 | -7,94 | ||||
| 2025-08-29 | 13F | Total Investment Management Inc | 100 | 1 | ||||||
| 2025-08-05 | 13F | Simplex Trading, Llc | 261 | 0 | ||||||
| 2025-07-22 | 13F | Awm Capital, Llc | 64.583 | 14,77 | 952 | 8,06 | ||||
| 2025-08-12 | 13F | BlackRock, Inc. | 315.266 | 30,74 | 4.436 | 21,34 | ||||
| 2025-08-12 | 13F | Dynamic Technology Lab Private Ltd | 26.177 | 24,06 | 368 | 15,00 | ||||
| 2025-08-04 | 13F | Emerald Mutual Fund Advisers Trust | 577.713 | 0,00 | 8.128 | -7,19 | ||||
| 2025-08-08 | 13F | Cetera Investment Advisers | 72.808 | -1,69 | 1.024 | -8,73 | ||||
| 2025-08-14 | 13F | Principal Street Partners, LLC | 24.713 | -7,54 | 348 | -14,32 | ||||
| 2025-08-13 | 13F | Quantbot Technologies LP | 155.851 | 322,26 | 2.193 | 292,13 | ||||
| 2025-08-13 | 13F | PharVision Advisers, LLC | 26.488 | 89,73 | 373 | 76,30 | ||||
| 2025-08-15 | 13F | CI Private Wealth, LLC | 209.838 | 159,64 | 2.952 | 140,98 | ||||
| 2025-08-14 | 13F/A | Rockefeller Capital Management L.P. | 895.784 | 1,89 | 12.604 | -5,43 | ||||
| 2025-07-28 | 13F | Melia Wealth LLC | 1.148.936 | 4,08 | 16.166 | -3,41 | ||||
| 2025-04-17 | 13F | Sound Income Strategies, LLC | 0 | -100,00 | 0 | |||||
| 2025-08-14 | 13F | Gotham Asset Management, LLC | 50.000 | 54,80 | 704 | 43,76 | ||||
| 2025-08-15 | 13F | Tower Research Capital LLC (TRC) | 90 | 172,73 | 1 | |||||
| 2025-08-14 | 13F | Van Eck Associates Corp | 1.520.403 | 10,63 | 21 | 5,00 | ||||
| 2025-08-12 | 13F | Financial Advocates Investment Management | 15.250 | 215 | ||||||
| 2025-08-13 | 13F | Bare Financial Services, Inc | 258 | 4 | ||||||
| 2025-08-12 | 13F | Entropy Technologies, LP | 0 | -100,00 | 0 | |||||
| 2025-08-28 | NP | TRIFX - Catalyst/SMH Total Return Income Fund Class A | 70.337 | 0,00 | 990 | -7,22 | ||||
| 2025-05-30 | NP | PRISX - T. Rowe Price Financial Services Fund, Inc. This fund is a listed as child fund of Price T Rowe Associates Inc /md/ and if that institution has disclosed ownership in this security, then these positions will not be double counted when calculating total shares and total value | 93.024 | -52,42 | 1.410 | -50,16 | ||||
| 2025-08-14 | 13F | Balyasny Asset Management Llc | 0 | -100,00 | 0 | |||||
| 2025-07-28 | NP | KBWD - Invesco KBW High Dividend Yield Financial ETF This fund is a listed as child fund of Invesco Ltd. and if that institution has disclosed ownership in this security, then these positions will not be double counted when calculating total shares and total value | 803.349 | -16,31 | 11.697 | -26,42 | ||||
| 2025-08-13 | 13F | Truvestments Capital Llc | 2.573 | -10,25 | 36 | -16,28 | ||||
| 2025-08-14 | 13F | Royal Bank Of Canada | 34.239 | 33,07 | 482 | 23,59 | ||||
| 2025-08-08 | 13F | Geode Capital Management, Llc | 14.443 | 0,00 | 203 | -6,88 | ||||
| 2025-08-12 | 13F | SRS Capital Advisors, Inc. | 622 | 0,00 | 9 | -11,11 | ||||
| 2025-07-25 | NP | First Trust Specialty Finance & Financial Opportunities Fund This fund is a listed as child fund of First Trust Advisors Lp and if that institution has disclosed ownership in this security, then these positions will not be double counted when calculating total shares and total value | 48.000 | 0,00 | 699 | -12,09 | ||||
| 2025-08-11 | 13F | Lsv Asset Management | 10.161 | 3,54 | 0 | |||||
| 2025-05-14 | 13F | Northwestern Mutual Wealth Management Co | 0 | -100,00 | 0 | |||||
| 2025-08-15 | 13F | Keel Point, LLC | 12.426 | 0,00 | 175 | -7,45 | ||||
| 2025-07-16 | 13F | Eagle Global Advisors Llc | 21.280 | 0,00 | 299 | -7,14 | ||||
| 2025-08-14 | 13F | Sovereign's Capital Management, LLC | 140.268 | 0,00 | 1.974 | -7,20 | ||||
| 2025-08-11 | 13F | Alps Advisors Inc | 23.152 | 3,46 | 326 | -4,13 | ||||
| 2025-08-13 | 13F | Rinkey Investments | 11.957 | -41,63 | 168 | -45,81 | ||||
| 2025-07-29 | 13F | Private Trust Co Na | 1.685 | 24 | ||||||
| 2025-08-12 | 13F | Clear Street Markets Llc | 0 | -100,00 | 0 | |||||
| 2025-07-16 | 13F | Exeter Financial, LLC | 10.166 | 143 | ||||||
| 2025-07-31 | 13F | Catalyst Capital Advisors LLC | 70.337 | 0,00 | 990 | -7,22 | ||||
| 2025-08-14 | 13F | Wells Fargo & Company/mn | 154.759 | 257,68 | 2.177 | 232,37 | ||||
| 2025-08-14 | 13F | Raymond James Financial Inc | 58.792 | 9,90 | 827 | 2,10 | ||||
| 2025-08-18 | 13F | Geneos Wealth Management Inc. | 7.566 | 6,53 | 106 | -0,93 | ||||
| 2025-07-10 | 13F | Peoples Bank/KS | 0 | -100,00 | 0 | |||||
| 2025-04-22 | 13F | Synergy Financial Management, LLC | 0 | -100,00 | 0 | |||||
| 2025-08-14 | 13F | Smartleaf Asset Management LLC | 76 | -50,97 | 1 | -50,00 | ||||
| 2025-07-21 | 13F | Mirae Asset Global Investments Co., Ltd. | 25.000 | 78,57 | 352 | 58,82 | ||||
| 2025-07-28 | 13F | Naviter Wealth, LLC | 21.970 | 18,12 | 320 | 8,84 | ||||
| 2025-06-23 | NP | PPNMX - SmallCap Growth Fund I R-3 | 179.519 | 0,00 | 2.608 | -5,03 | ||||
| 2025-07-22 | 13F | Gsa Capital Partners Llp | 12.330 | -38,77 | 0 | |||||
| 2025-07-18 | 13F | Union Bancaire Privee, UBP SA | 11.760 | 5,08 | 24.658 | 14.489,94 | ||||
| 2025-07-31 | 13F | Quest Partners LLC | 61.157 | 64.275,79 | 860 | 85.900,00 | ||||
| 2025-08-04 | 13F | Emerald Advisers, Llc | 829.710 | 3,87 | 11.674 | -3,59 | ||||
| 2025-08-11 | 13F | Empowered Funds, LLC | 14.168 | -8,33 | 199 | -14,96 | ||||
| 2025-08-26 | NP | GAFCX - Virtus AlphaSimplex Global Alternatives Fund Class C | 2.493 | 35 | ||||||
| 2025-08-12 | 13F | Aigen Investment Management, Lp | 12.758 | 180 | ||||||
| 2025-07-24 | 13F | Ronald Blue Trust, Inc. | 5.929 | 40,33 | 83 | 29,69 | ||||
| 2025-08-11 | 13F | Hexagon Capital Partners LLC | 0 | -100,00 | 0 | |||||
| 2025-08-13 | 13F | EverSource Wealth Advisors, LLC | 1.598 | 58,06 | 22 | 46,67 | ||||
| 2025-08-15 | 13F | Kestra Advisory Services, LLC | 13.677 | 192 | ||||||
| 2025-08-08 | 13F | Creative Planning | 0 | -100,00 | 0 | |||||
| 2025-08-12 | 13F | LPL Financial LLC | 459.325 | 23,15 | 6.463 | 14,29 | ||||
| 2025-06-27 | NP | LBO - WHITEWOLF Publicly Listed Private Equity ETF | 15.456 | 14,29 | 225 | 8,74 | ||||
| 2025-05-15 | 13F | Talon Private Wealth, LLC | 0 | -100,00 | 0 | -100,00 | ||||
| 2025-08-14 | 13F | Susquehanna International Group, Llp | Call | 223.200 | 3.140 | |||||
| 2025-08-08 | 13F | Pnc Financial Services Group, Inc. | 3.000 | 0,00 | 42 | -6,67 | ||||
| 2025-08-14 | 13F | Susquehanna International Group, Llp | Put | 15.100 | 212 | |||||
| 2025-07-31 | 13F | Caitong International Asset Management Co., Ltd | 32 | 0,00 | 0 | |||||
| 2025-08-13 | 13F | Marshall Wace, Llp | 24.563 | 346 | ||||||
| 2025-08-14 | 13F | Cubist Systematic Strategies, LLC | 92.690 | -20,94 | 1.304 | -26,62 | ||||
| 2025-07-02 | 13F | First Financial Bank - Trust Division | 38.665 | 0,00 | 544 | -7,17 | ||||
| 2025-04-22 | 13F | Cambridge Investment Research Advisors, Inc. | 0 | -100,00 | 0 | |||||
| 2025-07-25 | 13F | Cwm, Llc | 288 | 3,60 | 0 | |||||
| 2025-08-14 | 13F | Alliancebernstein L.p. | 0 | -100,00 | 0 | |||||
| 2025-08-19 | 13F | Advisory Services Network, LLC | 160.176 | 52,66 | 2.401 | 51,01 | ||||
| 2025-08-11 | 13F | Private Advisor Group, LLC | 26.478 | 19,47 | 373 | 11,04 | ||||
| 2025-08-14 | 13F | Price T Rowe Associates Inc /md/ | 0 | -100,00 | 0 | |||||
| 2025-08-14 | 13F | State Street Corp | 56.370 | 257,75 | 822 | 233,74 | ||||
| 2025-07-24 | NP | FNCMX - Fidelity Nasdaq Composite Index Fund This fund is a listed as child fund of Fmr Llc and if that institution has disclosed ownership in this security, then these positions will not be double counted when calculating total shares and total value | 14.443 | 0,00 | 210 | -12,13 | ||||
| 2025-07-09 | 13F | Triumph Capital Management | 0 | -100,00 | 0 | |||||
| 2025-07-30 | 13F | Denali Advisors Llc | 102.530 | 1.443 | ||||||
| 2025-08-14 | 13F | Bnp Paribas Arbitrage, Sa | 68 | 1 | ||||||
| 2025-08-12 | 13F | Trexquant Investment LP | 190.369 | -23,78 | 2.678 | -29,27 | ||||
| 2025-08-12 | 13F | Franklin Resources Inc | 507.169 | 53,28 | 7.136 | 42,24 | ||||
| 2025-05-14 | 13F | Susquehanna International Group, Llp | 0 | -100,00 | 0 | -100,00 | ||||
| 2025-08-14 | 13F | Verition Fund Management LLC | 0 | -100,00 | 0 | |||||
| 2025-07-15 | 13F | Colonial River Wealth Management, LLC | 0 | -100,00 | 0 | |||||
| 2025-08-13 | 13F | Jump Financial, LLC | 135.320 | 1.904 | ||||||
| 2025-08-14 | 13F | Hrt Financial Lp | 210.981 | 39,16 | 3 | 0,00 | ||||
| 2025-08-14 | 13F | Ambassador Advisors, LLC | 247.098 | 4,38 | 3.477 | -3,12 | ||||
| 2025-08-14 | 13F | Qube Research & Technologies Ltd | 264.187 | 8,12 | 3.717 | 0,35 | ||||
| 2025-08-14 | 13F | First Commonwealth Financial Corp /pa/ | 23.741 | 0,00 | 334 | -6,96 | ||||
| 2025-08-21 | NP | BIZD - VanEck Vectors BDC Income ETF | 1.464.692 | 5,83 | 20.608 | -1,77 | ||||
| 2025-05-12 | 13F | Fmr Llc | 0 | -100,00 | 0 | |||||
| 2025-08-14 | 13F | Citadel Advisors Llc | Put | 10.400 | -61,90 | 146 | -64,65 | |||
| 2025-08-14 | 13F | Harvest Investment Services, LLC | 11.979 | 0,13 | 169 | -7,18 | ||||
| 2025-08-14 | 13F | GWM Advisors LLC | 10.238 | 2,84 | 144 | -4,00 | ||||
| 2025-07-29 | 13F | Chicago Partners Investment Group LLC | 97.296 | -0,10 | 1.461 | 8,54 | ||||
| 2025-08-14 | 13F | PDT Partners, LLC | 0 | -100,00 | 0 | |||||
| 2025-08-11 | 13F | Citigroup Inc | 0 | -100,00 | 0 | |||||
| 2025-08-14 | 13F | Citadel Advisors Llc | Call | 163.500 | 54,25 | 2.300 | 43,21 | |||
| 2025-05-28 | NP | SMLV - SPDR SSGA US Small Cap Low Volatility Index ETF This fund is a listed as child fund of State Street Corp and if that institution has disclosed ownership in this security, then these positions will not be double counted when calculating total shares and total value | 80.482 | 28,20 | 1.220 | 34,36 | ||||
| 2025-08-07 | 13F | Allworth Financial LP | 3.778 | 53 | ||||||
| 2025-08-14 | 13F | Boothbay Fund Management, Llc | 10.058 | 142 | ||||||
| 2025-08-12 | 13F | Cornerstone Wealth Management, LLC | 32.453 | 10,48 | 457 | 2,47 | ||||
| 2025-07-30 | NP | BFOR - Barron's 400 ETF | 23.152 | -8,89 | 337 | -19,76 | ||||
| 2025-07-14 | 13F | U.S. Capital Wealth Advisors, LLC | 21.000 | 295 | ||||||
| 2025-05-15 | 13F | EJF Capital LLC | 0 | -100,00 | 0 | |||||
| 2025-07-17 | 13F | GraniteShares Advisors LLC | 193.748 | 6,67 | 2.726 | -0,98 | ||||
| 2025-07-11 | 13F | Annex Advisory Services, LLC | 12.227 | 0,00 | 172 | -7,03 | ||||
| 2025-08-13 | 13F | Guggenheim Capital Llc | 39.261 | 5,73 | 552 | -1,78 | ||||
| 2025-08-14 | 13F | Group One Trading, L.p. | 14.378 | -2,98 | 202 | -9,82 | ||||
| 2025-08-14 | 13F | QVT Financial LP | Put | 750.000 | 10.552 | |||||
| 2025-08-13 | 13F | Jones Financial Companies Lllp | 326 | 226,00 | 5 | 300,00 | ||||
| 2025-05-14 | 13F | Comerica Bank | 0 | -100,00 | 0 | |||||
| 2025-08-07 | 13F | Hennion & Walsh Asset Management, Inc. | 255.096 | 3,22 | 3.589 | -4,19 | ||||
| 2025-05-14 | 13F | Campbell & CO Investment Adviser LLC | 0 | -100,00 | 0 | |||||
| 2025-07-09 | 13F | Sunpointe, LLC | 12.000 | 175 | ||||||
| 2025-07-11 | 13F | Farther Finance Advisors, LLC | 2.450 | 0,00 | 34 | -10,53 | ||||
| 2025-08-13 | 13F | M&t Bank Corp | 12.000 | 0,00 | 169 | -7,18 | ||||
| 2025-08-14 | 13F | Two Sigma Investments, Lp | 537.558 | -43,17 | 7.563 | -47,26 | ||||
| 2025-08-04 | 13F | Canton Hathaway, LLC | 96.571 | 1,38 | 1 | 0,00 | ||||
| 2025-05-13 | 13F | BKD Wealth Advisors, LLC | 0 | -100,00 | 0 | |||||
| 2025-08-12 | 13F | Global Retirement Partners, LLC | 1.203 | 0,00 | 17 | -5,88 | ||||
| 2025-08-14 | 13F | Quarry LP | 8.746 | 96,89 | 123 | 83,58 | ||||
| 2025-08-14 | 13F | Brevan Howard Capital Management LP | 62.231 | 876 | ||||||
| 2025-08-13 | 13F | Northern Trust Corp | 93.592 | 785,78 | 1.317 | 722,50 | ||||
| 2025-07-21 | 13F | Ameriflex Group, Inc. | 0 | -100,00 | 0 | |||||
| 2025-08-13 | 13F | JT Stratford LLC | 10.855 | 153 | ||||||
| 2025-08-14 | 13F | D. E. Shaw & Co., Inc. | 19.452 | -81,59 | 274 | -82,95 | ||||
| 2025-07-29 | NP | NKMCX - North Square Kennedy MicroCap Fund Class I | 11.913 | 81,35 | 173 | 60,19 | ||||
| 2025-07-28 | 13F | Harbour Investments, Inc. | 0 | -100,00 | 0 | |||||
| 2025-08-12 | 13F | Proequities, Inc. | 0 | 0 | ||||||
| 2025-08-14 | 13F | Citadel Advisors Llc | 0 | -100,00 | 0 | |||||
| 2025-08-14 | 13F | Ares Management Llc | 545.723 | 0,00 | 7.678 | -7,19 | ||||
| 2025-08-14 | 13F | Goldman Sachs Group Inc | 97.208 | -28,87 | 1.368 | -33,99 | ||||
| 2025-08-29 | NP | GraniteShares ETF Trust - GraniteShares HIPS US High Income ETF | 193.748 | 6,67 | 2.726 | -0,98 | ||||
| 2025-07-03 | 13F | Garde Capital, Inc. | 1.548 | 0,00 | 22 | -8,70 | ||||
| 2025-06-25 | NP | HSPGX - Emerald Growth Fund Class A | 338.791 | 0,00 | 4.923 | -5,04 | ||||
| 2025-08-14 | 13F | Two Sigma Advisers, Lp | 709.500 | -35,12 | 9.983 | -39,79 | ||||
| 2025-08-14 | 13F | Stifel Financial Corp | 423.164 | -0,30 | 5.954 | -7,48 | ||||
| 2025-08-12 | 13F | XTX Topco Ltd | 0 | -100,00 | 0 |
Other Listings
| DE:9F7 | 13,61 € |