Statistiche di base
| Proprietari istituzionali | 183 total, 183 long only, 0 short only, 0 long/short - change of -1,60% MRQ |
| Allocazione media del portafoglio | 0.2607 % - change of 33,38% MRQ |
| Azioni istituzionali (Long) | 50.185.193 (ex 13D/G) - change of 2,50MM shares 5,24% MRQ |
| Valore istituzionale (Long) | $ 243.182 USD ($1000) |
Proprietà istituzionale e azionisti
Nuveen Credit Strategies Income Fund (US:JQC) ha 183 proprietari istituzionali e azionisti che hanno presentato i moduli 13D/G o 13F alla Securities Exchange Commission (SEC). Queste istituzioni detengono un totale di 50,185,193 azioni. I maggiori azionisti includono Morgan Stanley, Oak Hill Advisors Lp, Guggenheim Capital Llc, Invesco Ltd., Sit Investment Associates Inc, Wells Fargo & Company/mn, Absolute Investment Advisers Llc, PCEF - Invesco CEF Income Composite ETF, Pathstone Holdings, LLC, and Raymond James Financial Inc .
(Nuveen Credit Strategies Income Fund (NYSE:JQC) la struttura proprietaria istituzionale mostra le attuali posizioni nella società da parte di istituzioni e fondi, nonché le ultime variazioni nella dimensione della posizione. I principali azionisti possono essere singoli investitori, fondi comuni, hedge fund o istituzioni. L'allegato 13D indica che l'investitore detiene (o ha detenuto) più del 5% della società e intende (o intendeva) perseguire attivamente un cambiamento nella strategia aziendale. L'allegato 13G indica un investimento passivo superiore al 5%.
The share price as of September 5, 2025 is 5,45 / share. Previously, on September 9, 2024, the share price was 5,87 / share. This represents a decline of 7,16% over that period.

Indice del sentiment dei fondi
L'indice del sentiment dei fondi (anche noto come "indice di accumulo di proprietà") individua i titoli più acquistati dai fondi. È il risultato di un sofisticato modello quantitativo multi-fattore che identifica le società con i più alti livelli di accumulo istituzionale. Il modello utilizza una combinazione dell'aumento totale dei proprietari dichiarati, delle variazioni nelle allocazioni di portafoglio di tali proprietari e di altre metriche. Il punteggio varia da 0 a 100: i numeri più alti indicano un livello di accumulo superiore ad altre società, mentre 50 rappresenta la media.
Frequenza di aggiornamento: giornaliera
Consulta Ownership Explorer per visualizzare l'elenco delle aziende con il ranking più alto.
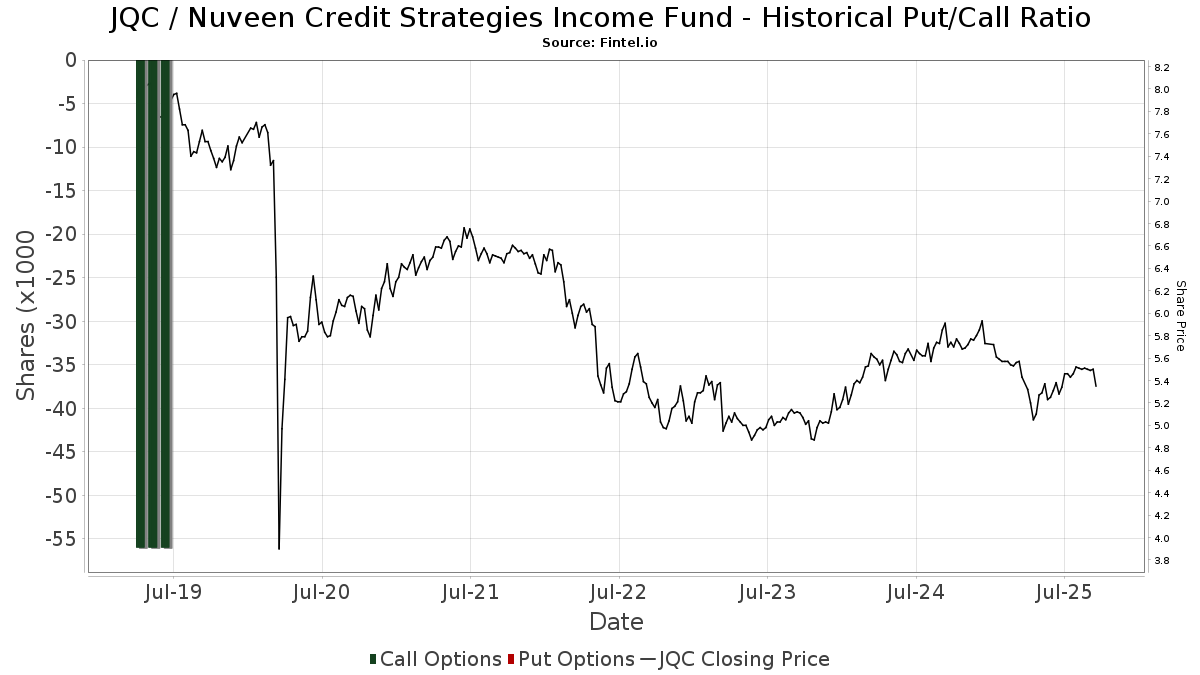
Rapporto put/call istituzionale
Oltre a segnalare le emissioni standard di titoli azionari e di debito, gli istituti con più di 100 milioni di asset in gestione devono anche dichiarare le loro partecipazioni in opzioni put e call. Poiché le opzioni put indicano generalmente un sentiment negativo e le opzioni call un sentiment positivo, possiamo avere un'idea del sentiment istituzionale complessivo attraverso il rapporto tra put e call. Il grafico a destra mostra il rapporto storico put/call per questo strumento.
L'utilizzo del rapporto put/call come indicatore del sentiment degli investitori consente di superare una delle principali lacune dell'utilizzo della proprietà istituzionale totale, ovvero il fatto che una quantità significativa di asset in gestione viene investita passivamente per seguire gli indici. Generalmente, i fondi a gestione passiva non acquistano opzioni, per cui il rapporto put/call riflette più fedelmente il sentiment dei fondi a gestione attiva.
Depositi 13D/G
Presentiamo i depositi 13D/G separatamente dai depositi 13F a causa del diverso trattamento da parte della SEC. I depositi 13D/G possono essere presentati da gruppi di investitori (con un unico leader), mentre i depositi 13F no. Ciò comporta situazioni in cui un investitore può depositare un documento 13D/G riportando un valore per il totale delle azioni (che rappresenta tutte le azioni possedute dal gruppo di investitori), e poi depositare un documento 13F riportando un valore diverso per il totale delle azioni (che rappresenta esclusivamente la propria proprietà). Ciò significa che la proprietà delle azioni nei depositi 13D/G e nei depositi 13F spesso non sono direttamente comparabili, pertanto le presentiamo separatamente.
Nota: a partire dal 16 maggio 2021, non mostriamo più i proprietari che non hanno depositato un documento 13D/G nellultimo anno. In precedenza, mostravamo lintero storico dei depositi 13D/G. In generale, le entità che sono tenute a depositare i documenti 13D/G devono farlo almeno una volta all'anno prima di presentare un deposito di chiusura. Tuttavia, a volte i fondi escono dalle posizioni senza presentare un deposito di chiusura (cioè, procedono a una liquidazione), per cui la visualizzazione dell'intero storico a volte generava confusione sull'attuale proprietà. Per evitare confusione, ora mostriamo solo i proprietari "attuali", ossia quelli che hanno effettuato un deposito nell'ultimo anno.
Upgrade to unlock premium data.
| Data di deposito | Modulo | Investitore | Azioni precedenti |
Ultime azioni |
Δ Azioni (Percentuale) |
Proprietà (Percentuale) |
Δ Proprietà (Percentuale) |
|
|---|---|---|---|---|---|---|---|---|
| 2024-11-08 | MORGAN STANLEY | 8,064,766 | 5,953,390 | -26.18 | 4.40 | -25.42 |
Depositi 13F e NPORT
Le informazioni relative ai depositi 13F sono gratuite. Per accedere alle informazioni relative ai depositi NP è necessario un'abbonamento premium. Le righe verdi indicano le nuove posizioni. Le righe rosse indicano le posizioni chiuse. Fai clic sull'icona del link per visualizzare la cronologia completa delle transazioni.
Esegui l'upgrade
per sbloccare i dati premium ed esportarli in Excel ![]() .
.
| Data di deposito | Fonte | Investitore | Tipo | Prezzo medio (Stima) |
Azioni | Δ Azioni (%) |
Valore dichiarato ($ 1000) |
Δ Valore (%) |
Allocazione del portafoglio (%) |
|
|---|---|---|---|---|---|---|---|---|---|---|
| 2025-07-29 | 13F | International Assets Investment Management, Llc | 82.452 | 0,00 | 444 | 0,23 | ||||
| 2025-08-13 | 13F | Invesco Ltd. | 2.529.455 | 9,70 | 13.634 | 9,90 | ||||
| 2025-08-12 | 13F | DCF Advisers, LLC | 371.713 | 14,47 | 2.004 | 14,72 | ||||
| 2025-07-14 | 13F | Sowell Financial Services LLC | 373.043 | -6,82 | 2.011 | -6,64 | ||||
| 2025-07-23 | 13F | Tcfg Wealth Management, Llc | 19.093 | 0,00 | 103 | 0,00 | ||||
| 2025-08-14 | 13F | Polar Asset Management Partners Inc. | 1.495.667 | 70,10 | 8.062 | 70,42 | ||||
| 2025-08-14 | 13F | Royal Bank Of Canada | 232.347 | -12,69 | 1.253 | -12,50 | ||||
| 2025-08-14 | 13F | GWM Advisors LLC | 74.608 | 39,43 | 402 | 40,07 | ||||
| 2025-08-27 | NP | THRIVENT SERIES FUND INC - Thrivent Balanced Income Plus Portfolio Class A | 12.530 | 0,00 | 68 | 0,00 | ||||
| 2025-07-24 | 13F | IFP Advisors, Inc | 1.262 | 0,00 | 7 | 0,00 | ||||
| 2025-07-10 | 13F | Atticus Wealth Management, Llc | 1.799 | 0,00 | 10 | 0,00 | ||||
| 2025-08-27 | NP | ACEFX - Absolute Strategies Fund Institutional Shares | 62.100 | 124.100,00 | 335 | |||||
| 2025-07-21 | 13F | Hilltop National Bank | 700 | 40,00 | 4 | 50,00 | ||||
| 2025-08-12 | 13F | Advisors Asset Management, Inc. | 1.289.447 | 11,88 | 6.950 | 12,10 | ||||
| 2025-07-17 | 13F | Sound Income Strategies, LLC | 4.365 | 3,12 | 24 | 4,55 | ||||
| 2025-08-15 | 13F | Provenance Wealth Advisors, LLC | 0 | -100,00 | 0 | -100,00 | ||||
| 2025-08-12 | 13F | Global Retirement Partners, LLC | 0 | -100,00 | 0 | |||||
| 2025-07-17 | 13F | Venture Visionary Partners LLC | 483.595 | 0,00 | 2.607 | 0,19 | ||||
| 2025-08-06 | 13F | Disciplined Investors, L.L.C. | 13.329 | -18,73 | 72 | -19,32 | ||||
| 2025-07-14 | 13F | Occidental Asset Management, LLC | 13.477 | -0,44 | 73 | 0,00 | ||||
| 2025-07-24 | 13F | Accredited Investor Services, Llc | 30.496 | 17,79 | 164 | 17,99 | ||||
| 2025-08-15 | 13F | First Heartland Consultants, Inc. | 31.012 | 0,00 | 167 | 0,60 | ||||
| 2025-07-16 | 13F | Castleview Partners, Llc | 216.087 | 1.165 | ||||||
| 2025-08-14 | 13F | Bank Of America Corp /de/ | 298.997 | -81,85 | 1.612 | -81,82 | ||||
| 2025-08-14 | 13F | Mariner, LLC | 77.016 | -15,31 | 415 | -15,13 | ||||
| 2025-08-13 | 13F | Level Four Advisory Services, Llc | 29.256 | 0,78 | 158 | 0,64 | ||||
| 2025-08-13 | 13F | Cary Street Partners Financial Llc | 25.965 | 140 | ||||||
| 2025-08-14 | 13F | UBS Group AG | 259.922 | 79,38 | 1.401 | 79,72 | ||||
| 2025-07-11 | 13F | Seacrest Wealth Management, Llc | 40.498 | -0,52 | 218 | -0,46 | ||||
| 2025-08-08 | 13F | Fiera Capital Corp | 185.336 | -0,89 | 999 | -0,80 | ||||
| 2025-08-15 | 13F | Kestra Advisory Services, LLC | 67.933 | 10,87 | 366 | 11,25 | ||||
| 2025-08-15 | 13F | Captrust Financial Advisors | 65.559 | 264,22 | 353 | 267,71 | ||||
| 2025-08-08 | 13F | Creative Planning | 0 | -100,00 | 0 | |||||
| 2025-08-13 | 13F | StoneX Group Inc. | 18.492 | -37,49 | 100 | -37,74 | ||||
| 2025-07-15 | 13F | Absolute Investment Advisers Llc | 1.847.341 | 9.957 | ||||||
| 2025-05-30 | NP | Rivernorth Opportunities Fund, Inc. | 100 | -99,96 | 1 | -100,00 | ||||
| 2025-08-12 | 13F | Steward Partners Investment Advisory, Llc | 248.766 | 96,94 | 1.341 | 97,35 | ||||
| 2025-08-14 | 13F | Quarry LP | 749.998 | 85,54 | 4.042 | 85,92 | ||||
| 2025-05-06 | 13F | AE Wealth Management LLC | 0 | -100,00 | 0 | -100,00 | ||||
| 2025-08-12 | 13F | Proequities, Inc. | 0 | 0 | ||||||
| 2025-08-13 | 13F | Cresset Asset Management, LLC | 0 | -100,00 | 0 | |||||
| 2025-07-10 | 13F | Stolper Co | 238.694 | 10,71 | 1 | 0,00 | ||||
| 2025-07-09 | 13F | VisionPoint Advisory Group, LLC | 27.082 | 146 | ||||||
| 2025-08-01 | 13F | Envestnet Asset Management Inc | 84.126 | -1,58 | 453 | -1,31 | ||||
| 2025-08-28 | NP | YYY - Amplify High Income ETF | 938.691 | 2,58 | 5.060 | 2,78 | ||||
| 2025-07-25 | 13F | We Are One Seven, LLC | 0 | -100,00 | 0 | |||||
| 2025-08-14 | 13F | Jane Street Group, Llc | 92.965 | 269,61 | 501 | 271,11 | ||||
| 2025-08-27 | NP | THRIVENT SERIES FUND INC - Thrivent Opportunity Income Plus Portfolio Class A | 25.612 | 0,00 | 138 | 0,73 | ||||
| 2025-07-15 | 13F | Retirement Income Solutions, Inc | 0 | -100,00 | 0 | |||||
| 2025-08-12 | 13F | Pathstone Holdings, LLC | 1.631.883 | 2.002,35 | 8.796 | 1.858,80 | ||||
| 2025-07-08 | 13F | Nbc Securities, Inc. | 251.166 | 15,15 | 1 | 0,00 | ||||
| 2025-08-14 | 13F | Robinson Capital Management, Llc | 120.650 | 650 | ||||||
| 2025-07-31 | 13F | Cambridge Investment Research Advisors, Inc. | 17.787 | -76,66 | 0 | |||||
| 2025-08-12 | 13F | LPL Financial LLC | 794.908 | 35,41 | 4.285 | 35,66 | ||||
| 2025-08-08 | 13F | Hartland & Co., LLC | 24.290 | 64,85 | 131 | 64,56 | ||||
| 2025-08-13 | 13F | Lido Advisors, LLC | 198.167 | 7,14 | 1.079 | 7,26 | ||||
| 2025-07-30 | 13F | Forum Financial Management, LP | 15.000 | 0,00 | 81 | 0,00 | ||||
| 2025-08-27 | NP | THRIVENT SERIES FUND INC - Thrivent Diversified Income Plus Portfolio Class A | 31.444 | 0,00 | 169 | 0,00 | ||||
| 2025-05-14 | 13F | Huntington National Bank | 10 | |||||||
| 2025-08-14 | 13F | Sunbelt Securities, Inc. | 2.710 | 8,40 | 15 | 15,38 | ||||
| 2025-07-28 | NP | PCEF - Invesco CEF Income Composite ETF This fund is a listed as child fund of Invesco Ltd. and if that institution has disclosed ownership in this security, then these positions will not be double counted when calculating total shares and total value | 1.717.513 | 30,35 | 8.983 | 22,84 | ||||
| 2025-08-27 | NP | RYDEX VARIABLE TRUST - Multi-Hedge Strategies Fund Variable Annuity | 591 | 278,85 | 3 | |||||
| 2025-06-27 | NP | Calamos ETF Trust - Calamos CEF Income & Arbitrage ETF | 120.972 | 7,69 | 638 | 1,59 | ||||
| 2025-07-14 | 13F | Maryland Capital Advisors Inc. | 5.000 | 27 | ||||||
| 2025-08-05 | 13F | Fullcircle Wealth Llc | 104.188 | 37,87 | 573 | 48,06 | ||||
| 2025-08-14 | 13F | Smartleaf Asset Management LLC | 401 | 0,00 | 2 | 0,00 | ||||
| 2025-07-25 | 13F | Apollon Wealth Management, LLC | 32.140 | 190,60 | 173 | 193,22 | ||||
| 2025-07-31 | 13F | Anchor Capital Management Group Inc | 175.000 | 0,00 | 943 | 0,21 | ||||
| 2025-08-13 | 13F | First Trust Advisors Lp | 375.696 | -9,74 | 2.025 | -9,56 | ||||
| 2025-05-30 | NP | RNDLX - RiverNorth/DoubleLine Strategic Income Fund Class R | 100 | -99,88 | 1 | -100,00 | ||||
| 2025-08-12 | 13F | Deutsche Bank Ag\ | 63.386 | -70,39 | 342 | -70,37 | ||||
| 2025-05-30 | NP | RNOTX - RiverNorth/Oaktree High Income Fund Class R | 100 | -99,87 | 1 | -100,00 | ||||
| 2025-08-15 | 13F | Prevail Innovative Wealth Advisors, Llc | 354.680 | 35,45 | 1.912 | 35,72 | ||||
| 2025-08-06 | 13F | Commonwealth Equity Services, Llc | 83.123 | 9,28 | 0 | |||||
| 2025-07-21 | 13F | Future Financial Wealth Managment LLC | 91.476 | 493 | ||||||
| 2025-07-08 | 13F | Allen Mooney & Barnes Investment Advisors LLC | 14.601 | 0,00 | 79 | 0,00 | ||||
| 2025-08-14 | 13F | First Foundation Advisors | 12.000 | 0,00 | 65 | 0,00 | ||||
| 2025-08-12 | 13F | Gladstone Institutional Advisory LLC | 56.474 | 0,00 | 304 | 0,33 | ||||
| 2025-08-08 | 13F | Meridian Wealth Management, LLC | 57.762 | 1,49 | 311 | 1,63 | ||||
| 2025-08-14 | 13F | EP Wealth Advisors, Inc. | 18.860 | -21,09 | 102 | -21,09 | ||||
| 2025-08-13 | 13F | Virtus Investment Advisers, Inc. | 163.884 | -19,09 | 883 | -18,92 | ||||
| 2025-08-14 | 13F | Ausdal Financial Partners, Inc. | 161.713 | -0,08 | 872 | 0,11 | ||||
| 2025-07-10 | 13F | Wealth Enhancement Advisory Services, Llc | 27.897 | -1,43 | 153 | 0,00 | ||||
| 2025-08-06 | 13F | North Capital, Inc. | 0 | -100,00 | 0 | |||||
| 2025-07-21 | 13F | Ameritas Advisory Services, LLC | 10.325 | -4,62 | 56 | -9,84 | ||||
| 2025-08-07 | 13F | Hennion & Walsh Asset Management, Inc. | 85.296 | -0,12 | 460 | 0,00 | ||||
| 2025-08-11 | 13F | HHM Wealth Advisors, LLC | 0 | -100,00 | 0 | |||||
| 2025-07-10 | 13F | Oliver Lagore Vanvalin Investment Group | 933 | 0,00 | 5 | 0,00 | ||||
| 2025-07-21 | 13F | First National Bank & Trust Co Of Newtown | 114.520 | -0,06 | 617 | 0,16 | ||||
| 2025-08-13 | 13F | Rsm Us Wealth Management Llc | 67.313 | 16,78 | 366 | 16,93 | ||||
| 2025-08-15 | 13F | Tower Research Capital LLC (TRC) | 0 | -100,00 | 0 | |||||
| 2025-07-24 | NP | DFRAX - DWS Floating Rate Fund Class A | 63.386 | -70,39 | 332 | -72,14 | ||||
| 2025-08-13 | 13F | Icon Advisers Inc/co | 64.776 | 349 | ||||||
| 2025-08-06 | 13F | Tabor Asset Management, LP | 0 | -100,00 | 0 | -100,00 | ||||
| 2025-08-05 | 13F | GHP Investment Advisors, Inc. | 550 | 0,00 | 3 | 0,00 | ||||
| 2025-08-14 | 13F | Bramshill Investments, LLC | 150.459 | 19,80 | 811 | 20,00 | ||||
| 2025-08-18 | 13F | Geneos Wealth Management Inc. | 34.629 | -1,85 | 187 | -1,59 | ||||
| 2025-07-15 | 13F | DKM Wealth Management, Inc. | 15.000 | 0,00 | 81 | 0,00 | ||||
| 2025-08-08 | 13F | Avantax Advisory Services, Inc. | 75.180 | 79,44 | 405 | 80,00 | ||||
| 2025-08-26 | 13F/A | Thrivent Financial For Lutherans | 391.087 | -50,00 | 2 | -50,00 | ||||
| 2025-04-23 | 13F | Navis Wealth Advisors, LLC | 0 | -100,00 | 0 | |||||
| 2025-08-11 | 13F | Elequin Capital Lp | 0 | -100,00 | 0 | |||||
| 2025-08-11 | 13F | Keyes, Stange & Wooten Wealth Management, LLC | 26.820 | 2,44 | 145 | 2,86 | ||||
| 2025-07-31 | 13F | Oppenheimer & Co Inc | 10.147 | -12,67 | 55 | -12,90 | ||||
| 2025-08-13 | 13F | Fiduciary Group LLC | 12.950 | 0,00 | 70 | 0,00 | ||||
| 2025-08-19 | 13F | National Asset Management, Inc. | 35.771 | -1,84 | 193 | -7,25 | ||||
| 2025-08-14 | 13F | Garden State Investment Advisory Services LLC | 12.773 | 0,48 | 69 | 0,00 | ||||
| 2025-08-08 | 13F | City Of London Investment Management Co Ltd | 635.847 | 238,70 | 3.427 | 239,64 | ||||
| 2025-07-28 | 13F | Harbour Investments, Inc. | 44.624 | 54,49 | 241 | 54,84 | ||||
| 2025-07-29 | 13F | Private Trust Co Na | 9.000 | 0,00 | 49 | 0,00 | ||||
| 2025-08-14 | 13F | Boston Private Wealth Llc | 0 | -100,00 | 0 | |||||
| 2025-06-26 | NP | ATCAX - Anchor Risk Managed Credit Strategies Fund Advisor Class Shares | 175.000 | 0,00 | 915 | -5,77 | ||||
| 2025-08-14 | 13F | Wells Fargo & Company/mn | 1.912.762 | 1,42 | 10.310 | 1,61 | ||||
| 2025-05-14 | 13F | Virtus ETF Advisers LLC | 0 | -100,00 | 0 | |||||
| 2025-07-17 | 13F | Halbert Hargrove Global Advisors, Llc | 3.000 | 0,00 | 16 | 0,00 | ||||
| 2025-06-26 | NP | AABFX - Thrivent Balanced Income Plus Fund Class A | 12.898 | 0,00 | 68 | -6,94 | ||||
| 2025-08-07 | 13F | Allworth Financial LP | 15.250 | 82 | ||||||
| 2025-08-07 | 13F | Encompass More Asset Management | 125.476 | 0,80 | 676 | 1,05 | ||||
| 2025-08-11 | 13F | HighTower Advisors, LLC | 10.414 | 56 | ||||||
| 2025-08-13 | 13F | Walleye Capital LLC | 0 | -100,00 | 0 | |||||
| 2025-08-28 | NP | RNCOX - RiverNorth Core Opportunity Fund Class R | 81.830 | 81.730,00 | 441 | |||||
| 2025-08-12 | 13F | CIBC Private Wealth Group, LLC | 8.061 | 0,99 | 43 | 10,26 | ||||
| 2025-08-05 | 13F | Shaker Financial Services, LLC | 24.452 | 135 | ||||||
| 2025-08-14 | 13F | CoreCap Advisors, LLC | 17.115 | 0,00 | 92 | 0,00 | ||||
| 2025-08-27 | NP | RYMSX - Guggenheim Multi-Hedge Strategies Fund Class P | 351 | 194,96 | 2 | |||||
| 2025-08-06 | 13F | Penserra Capital Management LLC | 948.351 | 3,64 | 5 | 25,00 | ||||
| 2025-05-30 | NP | Rivernorth/doubleline Strategic Opportunity Fund, Inc. | 100 | -99,97 | 1 | -100,00 | ||||
| 2025-08-14 | 13F | Alpine Global Management, LLC | 0 | -100,00 | 0 | |||||
| 2025-08-12 | 13F | NWF Advisory Services Inc. | 49.800 | 268 | ||||||
| 2025-08-14 | 13F | Comerica Bank | 29.246 | -62,66 | 158 | -62,71 | ||||
| 2025-08-27 | NP | AAHYX - Thrivent Diversified Income Plus Fund Class A | 50.149 | 0,00 | 270 | 0,37 | ||||
| 2025-07-24 | 13F | Us Bancorp \de\ | 4.492 | 0,00 | 24 | 0,00 | ||||
| 2025-08-07 | 13F | Readystate Asset Management Lp | 291.903 | 1.573 | ||||||
| 2025-06-26 | NP | AAINX - Thrivent Opportunity Income Plus Fund Class A | 102.539 | 0,00 | 540 | -5,76 | ||||
| 2025-04-22 | 13F | Synergy Financial Management, LLC | 0 | -100,00 | 0 | |||||
| 2025-08-08 | 13F | Calamos Advisors LLC | 120.972 | 12,00 | 652 | 12,22 | ||||
| 2025-08-01 | 13F | Ashton Thomas Private Wealth, LLC | 19.721 | 51,21 | 107 | 52,86 | ||||
| 2025-07-31 | 13F | Glass Jacobson Investment Advisors llc | 0 | -100,00 | 0 | |||||
| 2025-08-04 | 13F | Kovack Advisors, Inc. | 56.940 | 89,80 | 307 | 90,06 | ||||
| 2025-07-15 | 13F | Financial Management Professionals, Inc. | 846 | 20,00 | 5 | 33,33 | ||||
| 2025-08-11 | 13F | WPG Advisers, LLC | 6.151 | -22,25 | 33 | -21,43 | ||||
| 2025-07-29 | 13F | Koshinski Asset Management, Inc. | 130.257 | -2,25 | 702 | -1,96 | ||||
| 2025-04-21 | 13F | ORG Partners LLC | 0 | -100,00 | 0 | |||||
| 2025-07-11 | 13F | Annex Advisory Services, LLC | 16.725 | 0,00 | 90 | 1,12 | ||||
| 2025-05-14 | 13F | Van Hulzen Asset Management, LLC | 0 | -100,00 | 0 | -100,00 | ||||
| 2025-08-14 | 13F | Sit Investment Associates Inc | 2.225.536 | 487,58 | 12 | 450,00 | ||||
| 2025-07-25 | 13F | Cwm, Llc | 5.041 | 0,00 | 0 | |||||
| 2025-05-08 | 13F | Private Advisory Group LLC | 0 | -100,00 | 0 | -100,00 | ||||
| 2025-07-10 | 13F | Sovran Advisors, LLC | 214.914 | -44,28 | 1.173 | -39,29 | ||||
| 2025-08-14 | 13F | Raymond James Financial Inc | 1.532.147 | -4,91 | 8.258 | -4,73 | ||||
| 2025-08-15 | 13F | Morgan Stanley | 10.640.087 | 8,66 | 57.350 | 8,87 | ||||
| 2025-06-30 | NP | CVY - Invesco Zacks Multi-Asset Income ETF This fund is a listed as child fund of Invesco Ltd. and if that institution has disclosed ownership in this security, then these positions will not be double counted when calculating total shares and total value | 130.300 | -3,40 | 687 | -8,90 | ||||
| 2025-08-05 | 13F | Tsfg, Llc | 3.000 | 0,00 | 0 | |||||
| 2025-08-13 | 13F | Beacon Pointe Advisors, LLC | 51.758 | 1,92 | 279 | 1,83 | ||||
| 2025-08-14 | 13F | Cohen & Steers, Inc. | 734.738 | 0,00 | 4 | 0,00 | ||||
| 2025-08-14 | 13F | Susquehanna International Group, Llp | 81.153 | 437 | ||||||
| 2025-07-07 | 13F | Centurion Wealth Management LLC | 66.465 | -2,06 | 358 | -7,25 | ||||
| 2025-08-12 | 13F | Coldstream Capital Management Inc | 0 | -100,00 | 0 | |||||
| 2025-08-08 | 13F | Family Firm, Inc. | 124.051 | 2,86 | 669 | 3,09 | ||||
| 2025-08-05 | 13F | Kesler, Norman & Wride, LLC | 11.151 | -1,02 | 60 | 0,00 | ||||
| 2025-08-15 | 13F | Equitable Holdings, Inc. | 0 | -100,00 | 0 | |||||
| 2025-08-14 | 13F | Ameriprise Financial Inc | 552.310 | 20,37 | 2.977 | 20,58 | ||||
| 2025-08-08 | 13F/A | Ignite Planners, LLC | 17.891 | 28,68 | 98 | 32,43 | ||||
| 2025-08-13 | 13F | Summit Financial, LLC | 56.897 | 310 | ||||||
| 2025-08-08 | 13F | Cetera Investment Advisers | 360.249 | -9,05 | 1.942 | -8,92 | ||||
| 2025-08-14 | 13F | Cable Car Capital LLC | 0 | -100,00 | 0 | |||||
| 2025-07-30 | NP | HYIN - WisdomTree Alternative Income Fund N/A | 407.112 | 46,47 | 2.129 | 38,07 | ||||
| 2025-05-08 | 13F | Plante Moran Financial Advisors, LLC | 0 | -100,00 | 0 | |||||
| 2025-08-12 | 13F | Virtu Financial LLC | 21.661 | 78,21 | 0 | |||||
| 2025-07-16 | 13F | PFS Partners, LLC | 1.000 | 5 | ||||||
| 2025-08-12 | 13F | J.w. Cole Advisors, Inc. | 211.630 | 10,18 | 1.141 | 10,36 | ||||
| 2025-08-08 | 13F | Pnc Financial Services Group, Inc. | 16.200 | 0,00 | 87 | 0,00 | ||||
| 2025-08-04 | 13F | Assetmark, Inc | 41 | -92,26 | 0 | -100,00 | ||||
| 2025-08-14 | 13F | Oak Hill Advisors Lp | 3.301.932 | -50,35 | 17.797 | -0,51 | ||||
| 2025-08-04 | 13F | Integrity Alliance, Llc. | 0 | -100,00 | 0 | |||||
| 2025-07-23 | 13F | Sax Wealth Advisors, Llc | 12.374 | 0,00 | 67 | 0,00 | ||||
| 2025-07-25 | NP | FCEF - First Trust CEF Income Opportunity ETF This fund is a listed as child fund of First Trust Advisors Lp and if that institution has disclosed ownership in this security, then these positions will not be double counted when calculating total shares and total value | 144.026 | -26,36 | 753 | -30,60 | ||||
| 2025-08-14 | 13F | Millennium Management Llc | 48.686 | 262 | ||||||
| 2025-08-12 | 13F | Landscape Capital Management, L.l.c. | 291.952 | -11,23 | 1.574 | -11,08 | ||||
| 2025-08-20 | NP | LSPAX - LoCorr Spectrum Income Fund Class A | 137.766 | 20,00 | 743 | 20,26 | ||||
| 2025-06-25 | NP | VPC - Virtus Private Credit Strategy ETF | 225.536 | 41,95 | 1.189 | 33,78 | ||||
| 2025-08-11 | 13F | Private Advisor Group, LLC | 0 | -100,00 | 0 | |||||
| 2025-09-04 | 13F/A | Advisor Group Holdings, Inc. | 129.605 | 9,81 | 699 | 9,92 | ||||
| 2025-07-16 | 13F | Formidable Asset Management, LLC | 18.300 | 0,00 | 98 | 0,00 | ||||
| 2025-08-13 | 13F | Thomas J. Herzfeld Advisors, Inc. | 676.389 | 3.646 | ||||||
| 2025-05-15 | 13F | Ancora Advisors, LLC | 0 | -100,00 | 0 | |||||
| 2025-08-12 | 13F | SRS Capital Advisors, Inc. | 235 | 1 | ||||||
| 2025-08-18 | 13F | Hollencrest Capital Management | 19.780 | 0,00 | 107 | 0,00 | ||||
| 2025-08-15 | 13F | CI Private Wealth, LLC | 45.378 | -11,87 | 245 | -11,91 | ||||
| 2025-07-17 | 13F | Wolff Wiese Magana Llc | 350 | 0,00 | 2 | 0,00 | ||||
| 2025-08-13 | 13F | Townsquare Capital Llc | 0 | -100,00 | 0 | |||||
| 2025-07-15 | 13F | Main Street Group, LTD | 500 | 0,00 | 3 | 0,00 | ||||
| 2025-08-14 | 13F | Boothbay Fund Management, Llc | 0 | -100,00 | 0 | |||||
| 2025-08-14 | 13F | Almitas Capital LLC | 63.388 | 342 | ||||||
| 2025-08-14 | 13F | Mml Investors Services, Llc | 23.400 | 0,33 | 0 | |||||
| 2025-07-15 | 13F | SJS Investment Consulting Inc. | 330 | 0,00 | 2 | 0,00 | ||||
| 2025-04-15 | 13F | Noble Wealth Management PBC | 2.000 | 11 | ||||||
| 2025-05-07 | 13F | Sheaff Brock Investment Advisors, LLC | 12.650 | 0,00 | 68 | -4,23 | ||||
| 2025-07-11 | 13F | Quad-Cities Investment Group, LLC | 23.262 | -30,70 | 125 | -30,56 | ||||
| 2025-05-09 | 13F | Cornerstone Advisors, LLC | 0 | -100,00 | 0 | -100,00 | ||||
| 2025-07-11 | 13F | Farther Finance Advisors, LLC | 8.902 | 138,28 | 48 | 147,37 | ||||
| 2025-08-11 | 13F | SFI Advisors, LLC | 0 | -100,00 | 0 | |||||
| 2025-07-14 | 13F | Park Avenue Securities Llc | 36.748 | -4,34 | 0 | |||||
| 2025-08-25 | NP | IOBAX - ICON FLEXIBLE BOND FUND Investor Class | 64.776 | 349 | ||||||
| 2025-04-24 | 13F | Total Wealth Planning & Management, Inc. | 0 | -100,00 | 0 | |||||
| 2025-08-13 | 13F | Guggenheim Capital Llc | 2.815.113 | 12,87 | 15.173 | 13,08 | ||||
| 2025-07-25 | 13F | Concurrent Investment Advisors, LLC | 21.394 | 0,00 | 115 | 0,00 | ||||
| 2025-08-01 | 13F | Alexander Labrunerie & Co., Inc. | 47.903 | 32,37 | 258 | 32,99 | ||||
| 2025-05-06 | 13F | WT Wealth Management | 15.488 | 0,00 | 83 | -5,68 | ||||
| 2025-08-13 | 13F | Smith, Moore & Co. | 13.155 | 6,05 | 71 | 6,06 | ||||
| 2025-08-12 | 13F | Bokf, Na | 0 | -100,00 | 0 | |||||
| 2025-08-27 | NP | RBNAX - Robinson Opportunistic Income Fund Class A Shares | 120.000 | 647 | ||||||
| 2025-08-14 | 13F | Stifel Financial Corp | 340.699 | 1,79 | 1.836 | 2,00 | ||||
| 2025-07-15 | 13F | BKA Wealth Consulting, Inc. | 145.963 | -29,50 | 787 | -29,38 | ||||
| 2025-07-30 | 13F | FNY Investment Advisers, LLC | 1.800 | 0,00 | 0 | |||||
| 2025-07-22 | 13F | Merit Financial Group, LLC | 46.963 | 95,03 | 253 | 96,12 | ||||
| 2025-08-06 | 13F | Wedbush Securities Inc | 55.101 | 1,97 | 0 | |||||
| 2025-08-18 | 13F/A | National Bank Of Canada /fi/ | 2.230 | -40,21 | 12 | -40,00 | ||||
| 2025-08-13 | 13F | Yakira Capital Management, Inc. | 253.121 | -72,78 | 1.364 | -72,74 | ||||
| 2025-08-14 | 13F | Rivernorth Capital Management, Llc | 81.830 | 441 |