Statistiche di base
| Proprietari istituzionali | 134 total, 131 long only, 0 short only, 3 long/short - change of 3,08% MRQ |
| Allocazione media del portafoglio | 0.1477 % - change of -2,79% MRQ |
| Azioni istituzionali (Long) | 37.666.287 (ex 13D/G) - change of 27,85MM shares 283,56% MRQ |
| Valore istituzionale (Long) | $ 186.071 USD ($1000) |
Proprietà istituzionale e azionisti
Fidus Investment Corporation (US:FDUS) ha 134 proprietari istituzionali e azionisti che hanno presentato i moduli 13D/G o 13F alla Securities Exchange Commission (SEC). Queste istituzioni detengono un totale di 37,666,287 azioni. I maggiori azionisti includono Kingstone Capital Partners Texas, LLC, Van Eck Associates Corp, Raymond James Financial Inc, BIZD - VanEck Vectors BDC Income ETF, Invesco Ltd., KBWD - Invesco KBW High Dividend Yield Financial ETF, Two Sigma Advisers, Lp, Cetera Investment Advisers, Envestnet Asset Management Inc, and Columbus Macro, LLC .
(Fidus Investment Corporation (NasdaqGS:FDUS) la struttura proprietaria istituzionale mostra le attuali posizioni nella società da parte di istituzioni e fondi, nonché le ultime variazioni nella dimensione della posizione. I principali azionisti possono essere singoli investitori, fondi comuni, hedge fund o istituzioni. L'allegato 13D indica che l'investitore detiene (o ha detenuto) più del 5% della società e intende (o intendeva) perseguire attivamente un cambiamento nella strategia aziendale. L'allegato 13G indica un investimento passivo superiore al 5%.
The share price as of September 5, 2025 is 21,39 / share. Previously, on September 9, 2024, the share price was 19,90 / share. This represents an increase of 7,49% over that period.

Indice del sentiment dei fondi
L'indice del sentiment dei fondi (anche noto come "indice di accumulo di proprietà") individua i titoli più acquistati dai fondi. È il risultato di un sofisticato modello quantitativo multi-fattore che identifica le società con i più alti livelli di accumulo istituzionale. Il modello utilizza una combinazione dell'aumento totale dei proprietari dichiarati, delle variazioni nelle allocazioni di portafoglio di tali proprietari e di altre metriche. Il punteggio varia da 0 a 100: i numeri più alti indicano un livello di accumulo superiore ad altre società, mentre 50 rappresenta la media.
Frequenza di aggiornamento: giornaliera
Consulta Ownership Explorer per visualizzare l'elenco delle aziende con il ranking più alto.
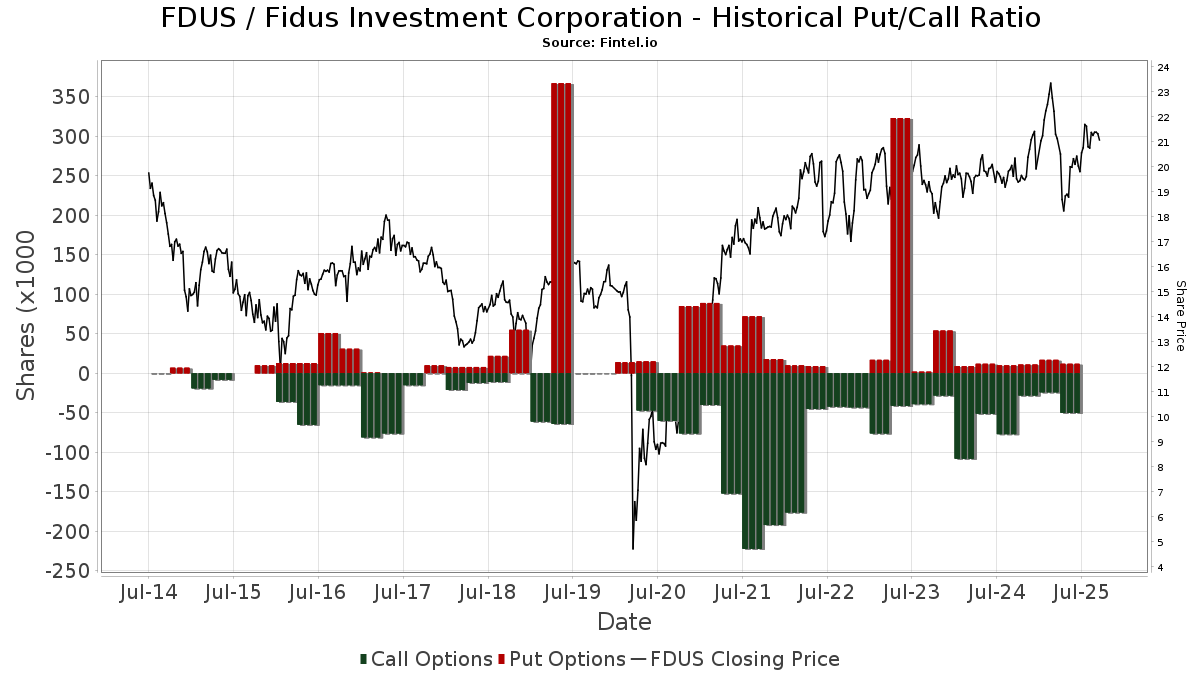
Rapporto put/call istituzionale
Oltre a segnalare le emissioni standard di titoli azionari e di debito, gli istituti con più di 100 milioni di asset in gestione devono anche dichiarare le loro partecipazioni in opzioni put e call. Poiché le opzioni put indicano generalmente un sentiment negativo e le opzioni call un sentiment positivo, possiamo avere un'idea del sentiment istituzionale complessivo attraverso il rapporto tra put e call. Il grafico a destra mostra il rapporto storico put/call per questo strumento.
L'utilizzo del rapporto put/call come indicatore del sentiment degli investitori consente di superare una delle principali lacune dell'utilizzo della proprietà istituzionale totale, ovvero il fatto che una quantità significativa di asset in gestione viene investita passivamente per seguire gli indici. Generalmente, i fondi a gestione passiva non acquistano opzioni, per cui il rapporto put/call riflette più fedelmente il sentiment dei fondi a gestione attiva.
Depositi 13F e NPORT
Le informazioni relative ai depositi 13F sono gratuite. Per accedere alle informazioni relative ai depositi NP è necessario un'abbonamento premium. Le righe verdi indicano le nuove posizioni. Le righe rosse indicano le posizioni chiuse. Fai clic sull'icona del link per visualizzare la cronologia completa delle transazioni.
Esegui l'upgrade
per sbloccare i dati premium ed esportarli in Excel ![]() .
.
| Data di deposito | Fonte | Investitore | Tipo | Prezzo medio (Stima) |
Azioni | Δ Azioni (%) |
Valore dichiarato ($ 1000) |
Δ Valore (%) |
Allocazione del portafoglio (%) |
|
|---|---|---|---|---|---|---|---|---|---|---|
| 2025-08-06 | 13F | First Horizon Advisors, Inc. | 2.658 | 154,84 | 54 | 152,38 | ||||
| 2025-05-05 | 13F | IFP Advisors, Inc | 0 | -100,00 | 0 | |||||
| 2025-08-14 | 13F | Group One Trading, L.p. | Call | 1.800 | 36 | |||||
| 2025-08-01 | 13F | Envestnet Asset Management Inc | 359.415 | 10,84 | 7.260 | 9,80 | ||||
| 2025-08-13 | 13F | Plan Group Financial, LLC | 49.763 | 38,85 | 1.005 | 37,67 | ||||
| 2025-07-22 | 13F | DAVENPORT & Co LLC | 36.237 | 0,00 | 732 | -0,95 | ||||
| 2025-08-08 | 13F | Capital Investment Advisory Services, LLC | 84.524 | 13,97 | 1.707 | 12,90 | ||||
| 2025-07-10 | 13F | Atticus Wealth Management, Llc | 3.816 | 77 | ||||||
| 2025-08-14 | 13F | Group One Trading, L.p. | Put | 100 | 2 | |||||
| 2025-08-14 | 13F | Quarry LP | 2.366 | 71,45 | 48 | 67,86 | ||||
| 2025-08-04 | 13F | Muzinich & Co., Inc. | 190.228 | 106,50 | 3.843 | 104,58 | ||||
| 2025-07-31 | 13F | Caitong International Asset Management Co., Ltd | 4 | 100,00 | 0 | |||||
| 2025-08-11 | 13F | Hexagon Capital Partners LLC | 0 | -100,00 | 0 | |||||
| 2025-08-14 | 13F | GWM Advisors LLC | 91.113 | -10,24 | 1.840 | -11,07 | ||||
| 2025-08-07 | 13F | Campbell & CO Investment Adviser LLC | 23.049 | -34,36 | 466 | -35,06 | ||||
| 2025-07-28 | NP | KBWD - Invesco KBW High Dividend Yield Financial ETF This fund is a listed as child fund of Invesco Ltd. and if that institution has disclosed ownership in this security, then these positions will not be double counted when calculating total shares and total value | 430.044 | -21,66 | 8.812 | -31,08 | ||||
| 2025-08-14 | 13F | Verition Fund Management LLC | 14.100 | 285 | ||||||
| 2025-08-12 | 13F | Legal & General Group Plc | 228.512 | 0,94 | 4.616 | -0,02 | ||||
| 2025-07-21 | 13F | Ameritas Advisory Services, LLC | 200 | 4 | ||||||
| 2025-08-12 | 13F | Cornerstone Wealth Management, LLC | 27.173 | 7,80 | 549 | 6,82 | ||||
| 2025-08-13 | 13F | Level Four Advisory Services, Llc | 30.487 | -13,98 | 616 | -14,82 | ||||
| 2025-08-04 | 13F | MeadowBrook Investment Advisors LLC | 2.850 | 90,00 | 58 | 90,00 | ||||
| 2025-08-29 | NP | JAFEX - Total Stock Market Index Trust NAV | 641 | 19,37 | 13 | 9,09 | ||||
| 2025-05-14 | 13F | Virtus ETF Advisers LLC | 0 | -100,00 | 0 | |||||
| 2025-07-10 | 13F | Capital Advisory Group Advisory Services, LLC | 77.618 | 1,98 | 1.568 | 1,03 | ||||
| 2025-08-08 | 13F | Hartland & Co., LLC | 20.661 | 0,44 | 417 | -0,48 | ||||
| 2025-05-16 | 13F | McIlrath & Eck, LLC | 0 | -100,00 | 0 | |||||
| 2025-07-18 | 13F | Truist Financial Corp | 45.703 | -2,67 | 909 | -5,12 | ||||
| 2025-07-29 | 13F | TrueMark Investments, LLC | 0 | -100,00 | 0 | |||||
| 2025-08-11 | 13F | Brown Brothers Harriman & Co | 5.337 | 0,00 | 108 | -0,93 | ||||
| 2025-07-17 | 13F | Janney Montgomery Scott LLC | 10.463 | 0,00 | 0 | |||||
| 2025-08-14 | 13F | Stifel Financial Corp | 13.995 | -21,95 | 283 | -22,74 | ||||
| 2025-08-13 | 13F | Virtus Investment Advisers, Inc. | 41.255 | -2,66 | 833 | -3,59 | ||||
| 2025-08-14 | 13F | Quantinno Capital Management LP | 27.165 | 549 | ||||||
| 2025-08-14 | 13F | Bnp Paribas Arbitrage, Sa | 38 | 1 | ||||||
| 2025-06-18 | NP | Putnam ETF Trust - Putnam BDC ETF - | 166.576 | 17,21 | 3.148 | -2,02 | ||||
| 2025-05-02 | 13F | Hager Investment Management Services, Llc | 0 | -100,00 | 0 | |||||
| 2025-07-23 | 13F | Morey & Quinn Wealth Partners, LLC | 14.778 | 0,00 | 299 | -1,00 | ||||
| 2025-08-14 | 13F | Smartleaf Asset Management LLC | 7 | 0,00 | 0 | |||||
| 2025-07-23 | 13F | 1 North Wealth Services Llc | 600 | 0,00 | 12 | 0,00 | ||||
| 2025-08-13 | 13F | Advisory Research Inc | 10.574 | 6,14 | 214 | 4,93 | ||||
| 2025-08-14 | 13F | Summit Trail Advisors, Llc | 22.502 | 455 | ||||||
| 2025-08-14 | 13F | Mercer Global Advisors Inc /adv | 29.783 | 602 | ||||||
| 2025-07-07 | 13F | Enterprise Bank & Trust Co | 55.912 | 0,00 | 1.129 | -0,96 | ||||
| 2025-07-24 | 13F | Capital Advisors, Ltd. LLC | 2.250 | 0,00 | 0 | |||||
| 2025-08-01 | 13F | Y-Intercept (Hong Kong) Ltd | 62.361 | 472,96 | 1.260 | 469,68 | ||||
| 2025-07-08 | 13F | Davis Investment Partners, LLC | 77.104 | -5,57 | 1.570 | 5,73 | ||||
| 2025-07-16 | 13F | Eagle Global Advisors Llc | 22.325 | 56,01 | 451 | 54,64 | ||||
| 2025-05-30 | NP | ERNZ - TrueShares Active Yield ETF | 11.462 | -85,27 | 234 | -85,75 | ||||
| 2025-08-05 | 13F | Palogic Value Management, L.P. | 69.101 | 2,65 | 1.396 | 1,68 | ||||
| 2025-08-13 | 13F | Mackenzie Financial Corp | 0 | -100,00 | 0 | |||||
| 2025-08-11 | 13F | Private Advisor Group, LLC | 14.734 | 29,12 | 298 | 28,02 | ||||
| 2025-08-21 | NP | BIZD - VanEck Vectors BDC Income ETF | 793.209 | 6,18 | 16.023 | 5,19 | ||||
| 2025-08-01 | 13F | Koss-Olinger Consulting, LLC | 16.153 | 326 | ||||||
| 2025-05-14 | 13F | Credit Agricole S A | 47.649 | 0,00 | 972 | -3,00 | ||||
| 2025-07-16 | 13F | ORG Partners LLC | 1.416 | 0,00 | 29 | -3,45 | ||||
| 2025-08-25 | 13F/A | Promus Capital, LLC | 2.023 | 0,00 | 41 | -2,44 | ||||
| 2025-07-31 | 13F | MQS Management LLC | 36.583 | -20,28 | 739 | -21,07 | ||||
| 2025-07-11 | 13F | Farther Finance Advisors, LLC | 7.346 | -2,92 | 148 | -5,13 | ||||
| 2025-08-12 | 13F | Jpmorgan Chase & Co | 4.398 | -66,67 | 89 | -67,29 | ||||
| 2025-08-08 | 13F | Pnc Financial Services Group, Inc. | 750 | 0,00 | 15 | 0,00 | ||||
| 2025-08-13 | 13F | Natixis | 26.751 | 0,00 | 539 | -1,47 | ||||
| 2025-07-24 | 13F | Blair William & Co/il | 0 | -100,00 | 0 | |||||
| 2025-05-05 | 13F | Transce3nd, LLC | 0 | -100,00 | 0 | |||||
| 2025-07-11 | 13F | Kingstone Capital Partners Texas, LLC | 27.409.759 | 549 | ||||||
| 2025-07-31 | 13F | Oak Harbor Wealth Partners, Llc | 17.981 | 0,00 | 363 | -0,82 | ||||
| 2025-07-25 | 13F | Atria Wealth Solutions, Inc. | 10.089 | 204 | ||||||
| 2025-06-27 | NP | LBO - WHITEWOLF Publicly Listed Private Equity ETF | 676 | 14,19 | 13 | -7,69 | ||||
| 2025-08-12 | 13F | Steward Partners Investment Advisory, Llc | 25.284 | 7,89 | 511 | 6,92 | ||||
| 2025-08-13 | 13F | Quantbot Technologies LP | 9.047 | -7,65 | 183 | -8,54 | ||||
| 2025-08-14 | 13F | Bank Of America Corp /de/ | 17.673 | -2,65 | 357 | -3,78 | ||||
| 2025-07-31 | 13F | Sumitomo Mitsui Trust Holdings, Inc. | 152.463 | 68,49 | 3.080 | 66,88 | ||||
| 2025-08-14 | 13F | Royal Bank Of Canada | 12.088 | 5,72 | 244 | 4,72 | ||||
| 2025-08-07 | 13F | Hennion & Walsh Asset Management, Inc. | 44.016 | 0,05 | 889 | -0,89 | ||||
| 2025-08-12 | 13F | BlackRock, Inc. | 193.153 | 30,75 | 3.902 | 29,52 | ||||
| 2025-08-13 | 13F | Millstone Evans Group, LLC | 3.686 | 0,00 | 74 | -1,33 | ||||
| 2025-08-14 | 13F | Jane Street Group, Llc | 0 | -100,00 | 0 | |||||
| 2025-08-15 | 13F | Morgan Stanley | 267.445 | -12,38 | 5.402 | -13,19 | ||||
| 2025-08-15 | 13F | Great West Life Assurance Co /can/ | 33.094 | 4,65 | 1 | |||||
| 2025-08-18 | 13F | N.E.W. Advisory Services LLC | 62 | 0,00 | 1 | 0,00 | ||||
| 2025-08-14 | 13F | Millennium Management Llc | 0 | -100,00 | 0 | |||||
| 2025-08-06 | 13F | Prospera Financial Services Inc | 20.171 | 0,02 | 407 | -0,97 | ||||
| 2025-08-13 | 13F | Beacon Pointe Advisors, LLC | 22.628 | 457 | ||||||
| 2025-08-18 | 13F | Geneos Wealth Management Inc. | 51 | 0,00 | 1 | 0,00 | ||||
| 2025-08-14 | 13F | Van Eck Associates Corp | 846.994 | 10,94 | 17 | 13,33 | ||||
| 2025-07-14 | 13F | Golden State Equity Partners | 15.740 | 318 | ||||||
| 2025-07-10 | 13F | Wealth Enhancement Advisory Services, Llc | 20.462 | 13,39 | 425 | 15,80 | ||||
| 2025-08-13 | 13F | Baird Financial Group, Inc. | 313.002 | 10,57 | 6.323 | 9,53 | ||||
| 2025-08-08 | 13F | Cetera Investment Advisers | 370.335 | 10,38 | 7.481 | 9,36 | ||||
| 2025-07-14 | 13F | AdvisorNet Financial, Inc | 1.728 | 137,36 | 35 | 142,86 | ||||
| 2025-08-12 | 13F | Virtu Financial LLC | 0 | -100,00 | 0 | |||||
| 2025-08-08 | 13F | Accredited Investors Inc. | 20.000 | 404 | ||||||
| 2025-08-14 | 13F | Wells Fargo & Company/mn | 23.887 | -14,58 | 483 | -15,44 | ||||
| 2025-07-31 | 13F | Optimum Investment Advisors | 20.393 | 9,32 | 412 | 8,16 | ||||
| 2025-07-31 | 13F | Cambridge Investment Research Advisors, Inc. | 26.905 | 10,85 | 1 | |||||
| 2025-08-08 | 13F | Cedar Wealth Management, LLC | 992 | 0,00 | 20 | 0,00 | ||||
| 2025-08-05 | 13F | GPS Wealth Strategies Group, LLC | 2.739 | -36,96 | 55 | -37,50 | ||||
| 2025-06-25 | NP | VPC - Virtus Private Credit Strategy ETF | 38.715 | -12,90 | 732 | -27,19 | ||||
| 2025-05-14 | 13F | Comerica Bank | 0 | -100,00 | 0 | |||||
| 2025-07-31 | 13F | Peterson Wealth Services | 122 | 0,83 | 2 | 0,00 | ||||
| 2025-05-13 | 13F | Neuberger Berman Group LLC | 0 | -100,00 | 0 | |||||
| 2025-07-29 | 13F | Stratos Wealth Partners, LTD. | 26.200 | 61,73 | 529 | 60,30 | ||||
| 2025-08-04 | 13F | Spire Wealth Management | 0 | -100,00 | 0 | |||||
| 2025-08-14 | 13F | Bragg Financial Advisors, Inc | 13.011 | 0,00 | 263 | -1,13 | ||||
| 2025-08-14 | 13F | Aquatic Capital Management LLC | 0 | -100,00 | 0 | |||||
| 2025-08-14 | 13F | Raymond James Financial Inc | 813.702 | -13,26 | 16.437 | -14,07 | ||||
| 2025-07-09 | 13F | Fiduciary Alliance LLC | 13.025 | 0,00 | 263 | -0,75 | ||||
| 2025-07-17 | 13F | GraniteShares Advisors LLC | 132.532 | 6,67 | 2.677 | 5,68 | ||||
| 2025-08-14 | 13F | Citadel Advisors Llc | Call | 24.800 | 10,22 | 501 | 9,17 | |||
| 2025-08-13 | 13F | Northwestern Mutual Wealth Management Co | 150 | 3 | ||||||
| 2025-08-25 | NP | TMVAX - RBC Microcap Value Fund A Shares | 4.400 | 0,00 | 89 | -1,12 | ||||
| 2025-04-21 | 13F | Nelson, Van Denburg & Campbell Wealth Management Group, LLC | 0 | -100,00 | 0 | |||||
| 2025-08-12 | 13F | Advisors Asset Management, Inc. | 154.610 | -27,54 | 3.123 | -28,21 | ||||
| 2025-07-23 | 13F | Columbus Macro, LLC | 322.543 | 12,14 | 6.515 | 11,10 | ||||
| 2025-07-31 | 13F | Oppenheimer & Co Inc | 20.323 | 6,82 | 411 | 5,94 | ||||
| 2025-08-06 | 13F | Ethos Financial Group, LLC | 137.365 | 2,22 | 2.775 | 1,24 | ||||
| 2025-08-12 | 13F | Dynamic Technology Lab Private Ltd | 0 | -100,00 | 0 | |||||
| 2025-08-12 | 13F | MAI Capital Management | 3.132 | 0,00 | 63 | 0,00 | ||||
| 2025-08-15 | 13F | Tower Research Capital LLC (TRC) | 699 | 2.812,50 | 14 | |||||
| 2025-08-12 | 13F | Franklin Resources Inc | 167.016 | -0,42 | 3.374 | -1,35 | ||||
| 2025-07-25 | 13F | Cwm, Llc | 749 | 1.602,27 | 0 | |||||
| 2025-08-14 | 13F | Mariner, LLC | 11.515 | 13,68 | 233 | 12,62 | ||||
| 2025-08-11 | 13F | HighTower Advisors, LLC | 90.865 | 0,22 | 1.835 | -0,70 | ||||
| 2025-08-12 | 13F | Laurel Wealth Advisors LLC | 31.755 | 7.588,86 | 2 | -87,50 | ||||
| 2025-07-17 | 13F | HB Wealth Management, LLC | 13.599 | 0,00 | 275 | -1,08 | ||||
| 2025-08-11 | 13F | Citigroup Inc | 0 | -100,00 | 0 | |||||
| 2025-08-12 | 13F | Trexquant Investment LP | 76.533 | 56,54 | 1.546 | 55,12 | ||||
| 2025-08-13 | 13F | Legacy Capital Wealth Partners, LLC | 66.037 | -2,68 | 1.334 | -3,62 | ||||
| 2025-08-12 | 13F | Global Retirement Partners, LLC | 788 | 16 | ||||||
| 2025-08-14 | 13F | Two Sigma Investments, Lp | 287.879 | -27,85 | 5.815 | -28,52 | ||||
| 2025-07-29 | 13F | Novare Capital Management Llc | 190.275 | 0,60 | 3.844 | -0,34 | ||||
| 2025-08-14 | 13F | Qube Research & Technologies Ltd | 64.929 | 39,81 | 1.312 | 38,58 | ||||
| 2025-09-04 | 13F/A | Advisor Group Holdings, Inc. | 13.092 | 7,56 | 264 | 6,45 | ||||
| 2025-08-29 | NP | GraniteShares ETF Trust - GraniteShares HIPS US High Income ETF | 132.532 | 6,67 | 2.677 | 5,68 | ||||
| 2025-08-06 | 13F | Commonwealth Equity Services, Llc | 35.124 | 20,65 | 1 | |||||
| 2025-07-08 | 13F | Nbc Securities, Inc. | 0 | -100,00 | 0 | |||||
| 2025-08-12 | 13F | LPL Financial LLC | 82.993 | -3,48 | 1.676 | -4,39 | ||||
| 2025-07-22 | 13F | Sage Investment Counsel LLC | 12.070 | 0,00 | 244 | -1,22 | ||||
| 2025-07-15 | 13F | Riverbridge Partners Llc | 38.975 | 3,92 | 787 | 3,01 | ||||
| 2025-08-07 | 13F | PFG Advisors | 188.495 | 3,76 | 3.808 | 2,81 | ||||
| 2025-08-12 | 13F | Proequities, Inc. | Put | 0 | 0 | |||||
| 2025-08-12 | 13F | Proequities, Inc. | Call | 0 | 0 | |||||
| 2025-08-12 | 13F | Proequities, Inc. | 0 | 0 | ||||||
| 2025-08-14 | 13F | Citadel Advisors Llc | Put | 0 | -100,00 | 0 | ||||
| 2025-08-13 | 13F | Russell Investments Group, Ltd. | 72 | 0,00 | 1 | 0,00 | ||||
| 2025-08-14 | 13F | UBS Group AG | 298.390 | 50,83 | 6.027 | 49,44 | ||||
| 2025-08-14 | 13F | Susquehanna International Group, Llp | 0 | -100,00 | 0 | |||||
| 2025-08-14 | 13F | Hrt Financial Lp | 54.066 | 26,75 | 1 | |||||
| 2025-08-14 | 13F | Susquehanna International Group, Llp | Call | 24.000 | 485 | |||||
| 2025-08-14 | 13F | IHT Wealth Management, LLC | 69.581 | 10,12 | 1.406 | 9,08 | ||||
| 2025-08-14 | 13F | Susquehanna International Group, Llp | Put | 12.000 | -7,69 | 242 | -8,68 | |||
| 2025-08-13 | 13F | Invesco Ltd. | 446.703 | 2,20 | 9.023 | 1,26 | ||||
| 2025-05-13 | 13F | EverSource Wealth Advisors, LLC | 0 | -100,00 | 0 | |||||
| 2025-08-14 | 13F | Ameriprise Financial Inc | 92.080 | -13,40 | 1.858 | -13,14 | ||||
| 2025-08-14 | 13F | MGB Wealth Management, LLC | 89.775 | 2,07 | 1.807 | 0,61 | ||||
| 2025-08-11 | 13F | Greenland Capital Management LP | 53.190 | -9,39 | 1.074 | -10,20 | ||||
| 2025-07-17 | 13F | Sound Income Strategies, LLC | 1.898 | -63,27 | 38 | -63,81 | ||||
| 2025-07-30 | 13F | D.a. Davidson & Co. | 115.872 | 159,06 | 2.341 | 156,86 | ||||
| 2025-08-05 | 13F | Simplex Trading, Llc | Put | 200 | 100,00 | 0 | ||||
| 2025-08-05 | 13F | Simplex Trading, Llc | 16.458 | 0 | ||||||
| 2025-08-05 | 13F | Simplex Trading, Llc | Call | 100 | -95,65 | 0 | ||||
| 2025-08-14 | 13F | Two Sigma Advisers, Lp | 380.613 | -8,49 | 7.688 | -9,34 | ||||
| 2025-08-13 | 13F | Northern Trust Corp | 20.202 | 408 | ||||||
| 2025-08-14 | 13F | Citadel Advisors Llc | 0 | -100,00 | 0 | |||||
| 2025-05-06 | 13F | WT Wealth Management | 53.376 | -3,72 | 1.088 | -6,61 |