Statistiche di base
| Proprietari istituzionali | 182 total, 181 long only, 0 short only, 1 long/short - change of 1,10% MRQ |
| Allocazione media del portafoglio | 0.1502 % - change of 60,47% MRQ |
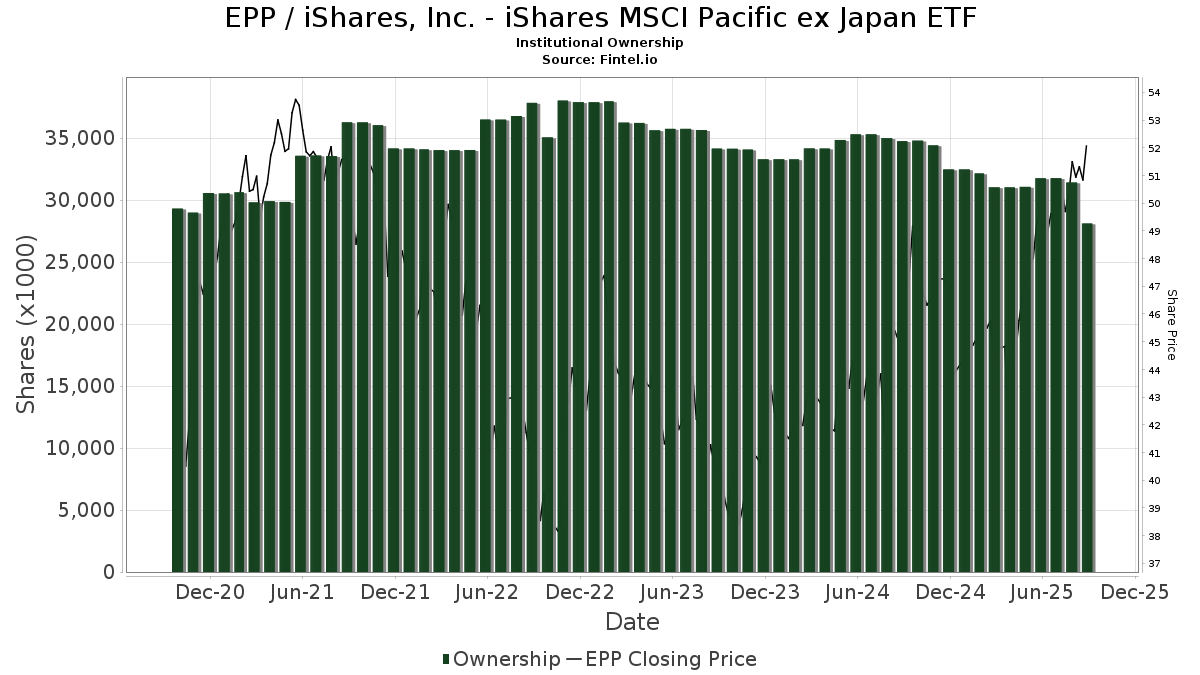
| Azioni istituzionali (Long) | 28.114.875 (ex 13D/G) - change of -3,65MM shares -11,50% MRQ |
| Valore istituzionale (Long) | $ 1.375.415 USD ($1000) |
Proprietà istituzionale e azionisti
iShares, Inc. - iShares MSCI Pacific ex Japan ETF (US:EPP) ha 182 proprietari istituzionali e azionisti che hanno presentato i moduli 13D/G o 13F alla Securities Exchange Commission (SEC). Queste istituzioni detengono un totale di 28,114,875 azioni. I maggiori azionisti includono Jpmorgan Chase & Co, Goldman Sachs Group Inc, Bank Of America Corp /de/, BlackRock, Inc., Asset Management One Co., Ltd., Morgan Stanley, UBS Group AG, Deutsche Bank Ag\, Prudential Plc, and Royal Bank Of Canada .
(iShares, Inc. - iShares MSCI Pacific ex Japan ETF (ARCA:EPP) la struttura proprietaria istituzionale mostra le attuali posizioni nella società da parte di istituzioni e fondi, nonché le ultime variazioni nella dimensione della posizione. I principali azionisti possono essere singoli investitori, fondi comuni, hedge fund o istituzioni. L'allegato 13D indica che l'investitore detiene (o ha detenuto) più del 5% della società e intende (o intendeva) perseguire attivamente un cambiamento nella strategia aziendale. L'allegato 13G indica un investimento passivo superiore al 5%.
The share price as of September 5, 2025 is 51,42 / share. Previously, on September 6, 2024, the share price was 44,55 / share. This represents an increase of 15,42% over that period.
Indice del sentiment dei fondi
L'indice del sentiment dei fondi (anche noto come "indice di accumulo di proprietà") individua i titoli più acquistati dai fondi. È il risultato di un sofisticato modello quantitativo multi-fattore che identifica le società con i più alti livelli di accumulo istituzionale. Il modello utilizza una combinazione dell'aumento totale dei proprietari dichiarati, delle variazioni nelle allocazioni di portafoglio di tali proprietari e di altre metriche. Il punteggio varia da 0 a 100: i numeri più alti indicano un livello di accumulo superiore ad altre società, mentre 50 rappresenta la media.
Frequenza di aggiornamento: giornaliera
Consulta Ownership Explorer per visualizzare l'elenco delle aziende con il ranking più alto.
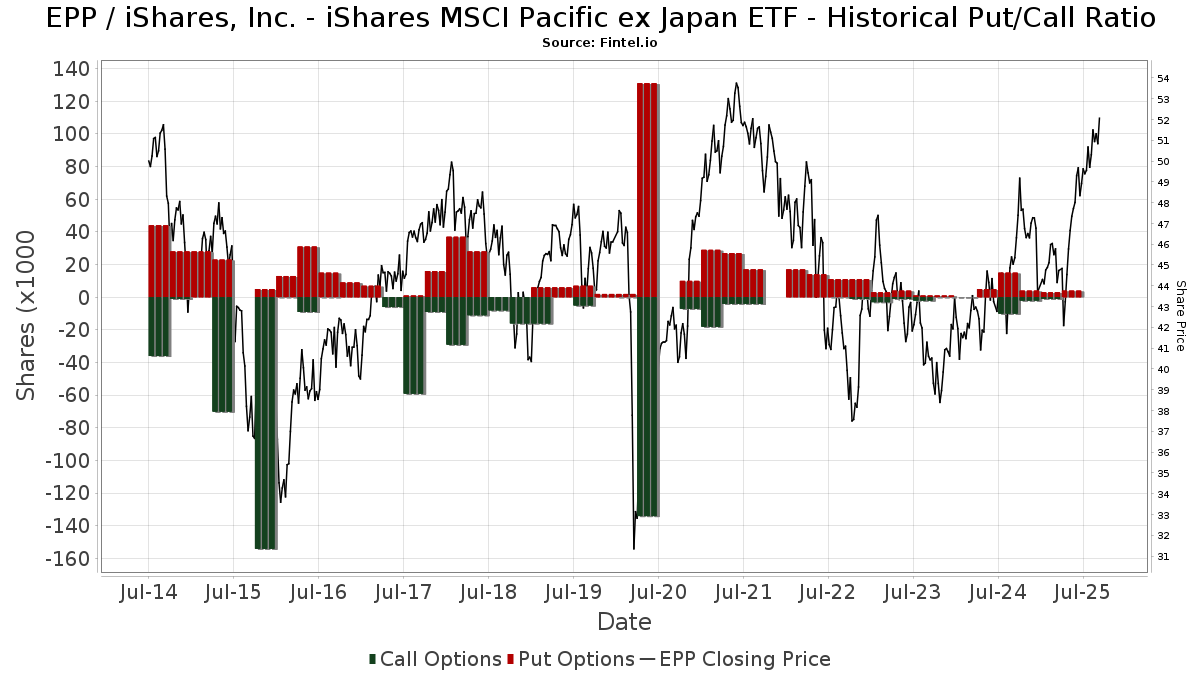
Rapporto put/call istituzionale
Oltre a segnalare le emissioni standard di titoli azionari e di debito, gli istituti con più di 100 milioni di asset in gestione devono anche dichiarare le loro partecipazioni in opzioni put e call. Poiché le opzioni put indicano generalmente un sentiment negativo e le opzioni call un sentiment positivo, possiamo avere un'idea del sentiment istituzionale complessivo attraverso il rapporto tra put e call. Il grafico a destra mostra il rapporto storico put/call per questo strumento.
L'utilizzo del rapporto put/call come indicatore del sentiment degli investitori consente di superare una delle principali lacune dell'utilizzo della proprietà istituzionale totale, ovvero il fatto che una quantità significativa di asset in gestione viene investita passivamente per seguire gli indici. Generalmente, i fondi a gestione passiva non acquistano opzioni, per cui il rapporto put/call riflette più fedelmente il sentiment dei fondi a gestione attiva.
Depositi 13F e NPORT
Le informazioni relative ai depositi 13F sono gratuite. Per accedere alle informazioni relative ai depositi NP è necessario un'abbonamento premium. Le righe verdi indicano le nuove posizioni. Le righe rosse indicano le posizioni chiuse. Fai clic sull'icona del link per visualizzare la cronologia completa delle transazioni.
Esegui l'upgrade
per sbloccare i dati premium ed esportarli in Excel ![]() .
.
| Data di deposito | Fonte | Investitore | Tipo | Prezzo medio (Stima) |
Azioni | Δ Azioni (%) |
Valore dichiarato ($ 1000) |
Δ Valore (%) |
Allocazione del portafoglio (%) |
|
|---|---|---|---|---|---|---|---|---|---|---|
| 2025-08-12 | 13F | MAI Capital Management | 90 | 4 | ||||||
| 2025-08-14 | 13F | BTG Pactual Asset Management US LLC | 79.459 | -0,17 | 3.923 | 11,74 | ||||
| 2025-08-12 | 13F | O'shaughnessy Asset Management, Llc | 561 | -8,33 | 28 | 3,85 | ||||
| 2025-08-13 | 13F | Flow Traders U.s. Llc | 114.179 | 6 | ||||||
| 2025-07-31 | 13F | Brinker Capital Investments, LLC | 0 | -100,00 | 0 | -100,00 | ||||
| 2025-07-10 | 13F | Wealth Enhancement Advisory Services, Llc | 5.945 | 0,00 | 295 | 12,60 | ||||
| 2025-08-13 | 13F | Forthright Family Wealth Advisory LLC | 0 | -100,00 | 0 | |||||
| 2025-07-24 | 13F | Us Bancorp \de\ | 3.283 | 1,64 | 162 | 14,08 | ||||
| 2025-09-04 | 13F/A | Advisor Group Holdings, Inc. | 39.846 | 16,84 | 1.967 | 30,87 | ||||
| 2025-08-14 | 13F | Raymond James Financial Inc | 74.480 | -40,01 | 3.677 | -32,84 | ||||
| 2025-08-14 | 13F | Wharton Business Group, LLC | 7.127 | -5,75 | 0 | |||||
| 2025-08-14 | 13F | Fmr Llc | 3.199 | 13,40 | 158 | 26,61 | ||||
| 2025-08-05 | 13F | Huntington National Bank | 296 | 12,12 | ||||||
| 2025-08-14 | 13F | Ancora Advisors, LLC | 1.100 | 0,00 | 54 | 12,50 | ||||
| 2025-07-31 | 13F | Glass Jacobson Investment Advisors llc | 225 | 0,00 | 11 | 22,22 | ||||
| 2025-07-17 | 13F | City Holding Co | 0 | -100,00 | 0 | |||||
| 2025-07-21 | 13F | Synergy Financial Management, LLC | 8.536 | 421 | ||||||
| 2025-08-14 | 13F | Syon Capital Llc | 147.298 | 48,08 | 7.272 | 65,80 | ||||
| 2025-08-14 | 13F | Aberdeen Wealth Management LLC | 300 | 15 | ||||||
| 2025-08-18 | 13F/A | National Bank Of Canada /fi/ | 190 | 0,00 | 9 | 12,50 | ||||
| 2025-07-31 | 13F | Asset Management One Co., Ltd. | 1.494.651 | 0,80 | 73.791 | 12,84 | ||||
| 2025-07-24 | 13F | Lmcg Investments, Llc | 90.740 | -4,86 | 4.480 | 6,49 | ||||
| 2025-08-13 | 13F | Northwestern Mutual Wealth Management Co | 5.426 | -73,90 | 268 | -70,85 | ||||
| 2025-07-08 | 13F/A | Salem Investment Counselors Inc | 40 | 0,00 | 2 | 0,00 | ||||
| 2025-08-08 | 13F | SBI Securities Co., Ltd. | 6.167 | 6,16 | 304 | 18,75 | ||||
| 2025-08-14 | 13F | Quantinno Capital Management LP | 5.841 | 4,62 | 288 | 17,07 | ||||
| 2025-05-14 | 13F | Renaissance Technologies Llc | 0 | -100,00 | 0 | -100,00 | ||||
| 2025-08-28 | NP | Northern Lights Fund Trust - Sierra Tactical Risk Spectrum 70 Fund Investor Class | 39.900 | 1.970 | ||||||
| 2025-07-09 | 13F | Massmutual Trust Co Fsb/adv | 15.320 | -4,00 | 756 | 7,54 | ||||
| 2025-08-07 | 13F/A | Curat Global, LLC | 9.368 | 0,00 | 462 | 11,86 | ||||
| 2025-08-12 | 13F | Stelac Advisory Services LLC | 48.101 | 0,00 | 2.375 | 11,82 | ||||
| 2025-08-01 | 13F | Biltmore Family Office, LLC | 5.178 | 0,00 | 256 | 11,84 | ||||
| 2025-08-14 | 13F | Federation des caisses Desjardins du Quebec | 270 | 0,00 | 13 | 18,18 | ||||
| 2025-08-14 | 13F | Hilltop Holdings Inc. | 40.077 | 1.979 | ||||||
| 2025-04-11 | 13F | Ehrlich Financial Group | 0 | -100,00 | 0 | -100,00 | ||||
| 2025-07-24 | 13F | Jfs Wealth Advisors, Llc | 250 | 0,00 | 12 | 9,09 | ||||
| 2025-08-11 | 13F | HighTower Advisors, LLC | 8.936 | -39,92 | 441 | -32,67 | ||||
| 2025-08-12 | 13F | LPL Financial LLC | 91.323 | 29,26 | 4.509 | 44,72 | ||||
| 2025-08-04 | 13F | Keybank National Association/oh | 14.587 | -7,72 | 720 | 3,30 | ||||
| 2025-08-08 | 13F | VERITY Wealth Advisors | 5.740 | 0,00 | 283 | 11,86 | ||||
| 2025-08-14 | 13F | Stifel Financial Corp | 17.523 | 865 | ||||||
| 2025-08-12 | 13F | Archer Investment Corp | 69 | 0,00 | 3 | 0,00 | ||||
| 2025-05-15 | 13F | GWM Advisors LLC | 0 | -100,00 | 0 | |||||
| 2025-08-19 | 13F | Delos Wealth Advisors, LLC | 112 | 6 | ||||||
| 2025-07-07 | 13F | Versant Capital Management, Inc | 12 | 0,00 | 1 | |||||
| 2025-08-12 | 13F | Prudential Plc | 293.500 | 14.490 | ||||||
| 2025-07-29 | 13F | Yoffe Investment Management, LLC | 8.163 | 0,00 | 403 | 12,26 | ||||
| 2025-07-08 | 13F | Parallel Advisors, LLC | 0 | -100,00 | 0 | |||||
| 2025-08-12 | 13F | Boreal Capital Management LLC | 545 | 27 | ||||||
| 2025-08-05 | 13F | Israel Discount Bank of New York | 6.740 | -1,12 | 333 | 10,67 | ||||
| 2025-08-13 | 13F | Northern Trust Corp | 7.319 | 361 | ||||||
| 2025-08-08 | 13F | Banco Bilbao Vizcaya Argentaria, S.a. | 40.615 | 0,00 | 2.004 | 11,65 | ||||
| 2025-08-12 | 13F | SRS Capital Advisors, Inc. | 250 | 0,00 | 12 | 9,09 | ||||
| 2025-07-24 | 13F | Blair William & Co/il | 11.035 | -5,61 | 545 | 5,63 | ||||
| 2025-04-22 | 13F | PFG Investments, LLC | 0 | -100,00 | 0 | |||||
| 2025-08-06 | 13F | Golden State Wealth Management, LLC | 54 | 3 | ||||||
| 2025-08-12 | 13F | Franklin Resources Inc | 2.000 | 99 | ||||||
| 2025-08-14 | 13F | Ameriprise Financial Inc | 93.302 | -13,05 | 4.605 | -2,72 | ||||
| 2025-08-14 | 13F/A | Skopos Labs, Inc. | 7.971 | 329 | ||||||
| 2025-08-12 | 13F | Insigneo Advisory Services, Llc | 4.768 | 235 | ||||||
| 2025-08-14 | 13F | DZ BANK AG Deutsche Zentral Genossenschafts Bank, Frankfurt am Main | 0 | -100,00 | 0 | |||||
| 2025-08-07 | 13F | Rathbone Brothers plc | 109.977 | -3,34 | 5.430 | 8,21 | ||||
| 2025-07-28 | 13F | BRYN MAWR TRUST Co | 2.806 | 10,08 | 139 | 23,21 | ||||
| 2025-05-09 | 13F | Wealthspire Advisors, LLC | 0 | -100,00 | 0 | |||||
| 2025-08-08 | 13F | Atlantic Trust, LLC | 43 | 2 | ||||||
| 2025-08-28 | NP | Northern Lights Fund Trust - Sierra Tactical Risk Spectrum 30 Fund Instl Class | 46.700 | 2.306 | ||||||
| 2025-08-08 | 13F | Gts Securities Llc | 11.538 | 7,23 | 570 | 20,04 | ||||
| 2025-07-23 | 13F | 1 North Wealth Services Llc | 1 | 0,00 | 0 | |||||
| 2025-08-14 | 13F | Susquehanna International Group, Llp | 29.134 | -66,15 | 1.438 | -62,11 | ||||
| 2025-07-23 | 13F | Integris Wealth Management, LLC | 39.577 | -1,34 | 1.954 | 10,40 | ||||
| 2025-08-14 | 13F | Susquehanna International Group, Llp | Put | 4.800 | 237 | |||||
| 2025-08-13 | 13F | Lido Advisors, LLC | 7.332 | -10,93 | 362 | -0,28 | ||||
| 2025-08-04 | 13F | AMG National Trust Bank | 5.451 | -3,11 | 269 | 8,47 | ||||
| 2025-08-07 | 13F | Resolute Advisors LLC | 21.145 | 1,79 | 1.044 | 13,86 | ||||
| 2025-08-05 | 13F | swisspartners Advisors Ltd | 11.225 | 5,75 | 554 | 33,57 | ||||
| 2025-07-08 | 13F | Nbc Securities, Inc. | 1.600 | -50,00 | 0 | |||||
| 2025-07-24 | 13F | Brandywine Oak Private Wealth Llc | 9.158 | 0,00 | 452 | 12,16 | ||||
| 2025-07-25 | 13F | Cwm, Llc | 491 | 29,89 | 0 | |||||
| 2025-07-24 | 13F | IFP Advisors, Inc | 579 | 0,00 | 29 | 12,00 | ||||
| 2025-08-14 | 13F | Blue Capital, Inc. | 0 | -100,00 | 0 | |||||
| 2025-07-17 | 13F | Park Place Capital Corp | 0 | -100,00 | 0 | |||||
| 2025-08-08 | 13F | Cetera Investment Advisers | 4.556 | 225 | ||||||
| 2025-08-15 | 13F | Kestra Advisory Services, LLC | 8.055 | -93,47 | 398 | -92,70 | ||||
| 2025-08-14 | 13F/A | Rockefeller Capital Management L.P. | 101.460 | -1,86 | 5.009 | 9,87 | ||||
| 2025-08-14 | 13F | Cooperman Leon G | 7.610 | 0,00 | 376 | 11,94 | ||||
| 2025-08-14 | 13F | Bnp Paribas Arbitrage, Sa | 12 | -99,95 | 1 | -100,00 | ||||
| 2025-08-14 | 13F | Citadel Advisors Llc | 74.919 | 278,25 | 3.699 | 323,60 | ||||
| 2025-08-01 | 13F | Bessemer Group Inc | 10.005 | 0,00 | 0 | |||||
| 2025-08-15 | 13F | CI Private Wealth, LLC | 48.503 | -42,93 | 2.395 | -36,13 | ||||
| 2025-04-23 | 13F | GHP Investment Advisors, Inc. | 0 | -100,00 | 0 | |||||
| 2025-08-14 | 13F | Citadel Advisors Llc | Call | 0 | -100,00 | 0 | ||||
| 2025-08-27 | 13F/A | Squarepoint Ops LLC | 10.809 | 534 | ||||||
| 2025-08-13 | 13F | Cerity Partners LLC | 26.786 | -1,84 | 1.322 | 9,89 | ||||
| 2025-08-05 | 13F | Tsfg, Llc | 31 | 0,00 | 0 | |||||
| 2025-07-24 | 13F | Robertson Stephens Wealth Management, LLC | 26.403 | 2,20 | 1.304 | 14,40 | ||||
| 2025-08-14 | 13F | Becker Capital Management Inc | 8.554 | 0,00 | 422 | 11,94 | ||||
| 2025-08-14 | 13F | Comerica Bank | 8.797 | -0,49 | 434 | 11,57 | ||||
| 2025-08-11 | 13F | TD Waterhouse Canada Inc. | 5.528 | 273 | ||||||
| 2025-08-12 | 13F | CIBC Private Wealth Group, LLC | 500 | 0,00 | 25 | 26,32 | ||||
| 2025-07-31 | 13F/A | Avion Wealth | 27 | 0,00 | 0 | |||||
| 2025-08-01 | 13F | Providence First Trust Co | 46.582 | -2,87 | 2.300 | 8,75 | ||||
| 2025-08-12 | 13F | Jpmorgan Chase & Co | 8.109.223 | -3,15 | 400.352 | 8,42 | ||||
| 2025-07-17 | 13F | Peoples Financial Services Corp. | 50 | 0,00 | 2 | 0,00 | ||||
| 2025-04-21 | 13F | Nelson, Van Denburg & Campbell Wealth Management Group, LLC | 0 | -100,00 | 0 | |||||
| 2025-08-08 | 13F | Pnc Financial Services Group, Inc. | 189.884 | -1,57 | 9.375 | 10,19 | ||||
| 2025-08-11 | 13F | Principal Securities, Inc. | 50 | 56,25 | 2 | 100,00 | ||||
| 2025-08-14 | 13F | Two Sigma Securities, Llc | 8.403 | 415 | ||||||
| 2025-05-15 | 13F | National Wealth Management Group, LLC | 0 | -100,00 | 0 | |||||
| 2025-08-14 | 13F | Bank Of America Corp /de/ | 3.131.894 | 29,72 | 154.622 | 45,22 | ||||
| 2025-07-25 | 13F | Johnson Investment Counsel Inc | 5.335 | 0,00 | 263 | 11,91 | ||||
| 2025-08-13 | 13F | Johnson Financial Group, Inc. | 21 | 1 | ||||||
| 2025-08-11 | 13F | Citigroup Inc | 167.455 | 20,71 | 8.267 | 35,15 | ||||
| 2025-07-31 | 13F | Money Design Co.,Ltd. | 0 | -100,00 | 0 | -100,00 | ||||
| 2025-08-13 | 13F | Amundi | 189.625 | 0,53 | 9.409 | 13,94 | ||||
| 2025-07-17 | 13F | Sound Income Strategies, LLC | 10 | -94,19 | 0 | -100,00 | ||||
| 2025-05-13 | 13F | Quadrature Capital Ltd | 0 | -100,00 | 0 | -100,00 | ||||
| 2025-08-26 | 13F/A | Thrivent Financial For Lutherans | 0 | -100,00 | 0 | -100,00 | ||||
| 2025-07-16 | 13F | Tru Independence Asset Management 2, Llc | 18.211 | 17,71 | 899 | 31,82 | ||||
| 2025-08-19 | 13F | Anchor Investment Management, LLC | 189 | 0,00 | 9 | 12,50 | ||||
| 2025-08-28 | NP | Northern Lights Fund Trust - Sierra Tactical Core Growth Fund Investor Class Shares | 8.265 | 408 | ||||||
| 2025-07-22 | 13F | Checchi Capital Advisers, LLC | 139.616 | 74,14 | 6.893 | 94,96 | ||||
| 2025-07-31 | 13F | Lee Danner & Bass Inc | 20.525 | 0,00 | 1.013 | 11,93 | ||||
| 2025-08-14 | 13F | Transamerica Financial Advisors, Inc. | 1.483 | -7,72 | 73 | |||||
| 2025-04-21 | 13F | Roman Butler Fullerton & Co | 0 | -100,00 | 0 | |||||
| 2025-04-23 | 13F | Professional Financial Advisors, LLC | 0 | -100,00 | 0 | |||||
| 2025-08-13 | 13F | Rsm Us Wealth Management Llc | 4.328 | 214 | ||||||
| 2025-08-14 | 13F | CoreCap Advisors, LLC | 0 | -100,00 | 0 | |||||
| 2025-08-28 | NP | Northern Lights Fund Trust - Sierra Tactical Risk Spectrum 50 Fund Investor Class | 138.600 | 6.843 | ||||||
| 2025-08-05 | 13F | Cherry Tree Wealth Management, LLC | 2.993 | 0,00 | 148 | 12,21 | ||||
| 2025-08-14 | 13F | Headlands Technologies LLC | 0 | -100,00 | 0 | -100,00 | ||||
| 2025-04-09 | 13F | Milestone Asset Management, Llc | 0 | -100,00 | 0 | |||||
| 2025-08-08 | 13F | Family Firm, Inc. | 0 | -100,00 | 0 | |||||
| 2025-08-07 | 13F | CENTRAL TRUST Co | 1.620 | 0,00 | 80 | 11,27 | ||||
| 2025-07-14 | 13F | Acropolis Investment Management, LLC | 0 | -100,00 | 0 | |||||
| 2025-08-01 | 13F | Envestnet Asset Management Inc | 70.037 | -3,12 | 3.458 | 8,47 | ||||
| 2025-08-15 | 13F | Tower Research Capital LLC (TRC) | 1.161 | 23.120,00 | 57 | |||||
| 2025-07-31 | 13F | Sharper & Granite LLC | 43.783 | 4,24 | 2.173 | 17,28 | ||||
| 2025-08-06 | 13F | First Horizon Advisors, Inc. | 9.285 | 0,00 | 458 | 11,98 | ||||
| 2025-07-10 | 13F | Global Financial Private Client, LLC | 0 | -100,00 | 0 | |||||
| 2025-07-15 | 13F | BigSur Wealth Management LLC | 1.730 | 0,00 | 85 | 11,84 | ||||
| 2025-08-06 | 13F | Savant Capital, LLC | 8.084 | 0,30 | 399 | 12,39 | ||||
| 2025-08-14 | 13F | Daiwa Securities Group Inc. | 15.660 | -10,15 | 1 | |||||
| 2025-08-08 | 13F | Fortis Group Advisors, LLC | 10 | 0,00 | 0 | |||||
| 2025-07-18 | 13F | SOA Wealth Advisors, LLC. | 493 | 1,86 | 24 | 14,29 | ||||
| 2025-08-07 | 13F | Montag A & Associates Inc | 6.900 | 0,00 | 341 | 11,84 | ||||
| 2025-07-16 | 13F | Signaturefd, Llc | 0 | -100,00 | 0 | -100,00 | ||||
| 2025-08-08 | 13F | Itau Unibanco Holding S.A. | 4.000 | -55,80 | 197 | |||||
| 2025-08-13 | 13F | Hsbc Holdings Plc | 86.496 | -0,05 | 4.270 | 11,90 | ||||
| 2025-08-12 | 13F | BlackRock, Inc. | 1.876.034 | -1,68 | 92.620 | 10,07 | ||||
| 2025-08-13 | 13F | EverSource Wealth Advisors, LLC | 6 | 0,00 | 0 | |||||
| 2025-07-18 | 13F | Truist Financial Corp | 39.527 | 1,68 | 1.951 | 13,83 | ||||
| 2025-08-14 | 13F | Kovitz Investment Group Partners, LLC | 55.581 | 2.744 | ||||||
| 2025-04-11 | 13F | Davis Capital Management | 90 | 0,00 | 4 | 0,00 | ||||
| 2025-08-12 | 13F | Coldstream Capital Management Inc | 0 | -100,00 | 0 | |||||
| 2025-08-13 | 13F | Jones Financial Companies Lllp | 90 | -71,43 | 4 | -69,23 | ||||
| 2025-07-11 | 13F | Farther Finance Advisors, LLC | 4.520 | -2,16 | 223 | 8,25 | ||||
| 2025-08-14 | 13F | Old Mission Capital Llc | 0 | -100,00 | 0 | |||||
| 2025-07-08 | 13F | Next Level Private LLC | 13.933 | -0,02 | 688 | 11,89 | ||||
| 2025-08-11 | 13F | Private Advisor Group, LLC | 4.741 | -8,49 | 234 | 2,63 | ||||
| 2025-07-25 | 13F | Hazlett, Burt & Watson, Inc. | 300 | 0,00 | 0 | |||||
| 2025-07-30 | 13F | Phillips Financial Management, Llc | 4.138 | 0,00 | 204 | 12,09 | ||||
| 2025-08-08 | 13F | Capital Investment Advisory Services, LLC | 63 | 0,00 | 3 | 50,00 | ||||
| 2025-08-13 | 13F | Invesco Ltd. | 14.755 | -8,11 | 728 | 2,82 | ||||
| 2025-07-07 | 13F | Investors Research Corp | 124 | 0,00 | 6 | 20,00 | ||||
| 2025-05-06 | 13F | Venturi Wealth Management, LLC | 0 | -100,00 | 0 | |||||
| 2025-07-14 | 13F | Park Avenue Securities Llc | 0 | -100,00 | 0 | |||||
| 2025-08-06 | 13F | Commonwealth Equity Services, Llc | 45.529 | -8,08 | 2 | 0,00 | ||||
| 2025-04-28 | 13F | Mutual Advisors, LLC | 0 | -100,00 | 0 | |||||
| 2025-07-24 | NP | PLUSX - DWS Multi-Asset Moderate Allocation Fund Class A | 6.529 | 15,89 | 315 | 25,00 | ||||
| 2025-08-14 | 13F | Goldman Sachs Group Inc | 6.955.810 | -32,53 | 343.408 | -24,46 | ||||
| 2025-07-29 | 13F | Activest Wealth Management | 11 | 0,00 | 1 | |||||
| 2025-08-14 | 13F | Glen Eagle Advisors, LLC | 10 | 0,00 | 0 | |||||
| 2025-04-28 | 13F | Resonant Capital Advisors, LLC | 0 | -100,00 | 0 | |||||
| 2025-07-23 | 13F | Vontobel Holding Ltd. | 5.250 | -5,23 | 259 | 6,15 | ||||
| 2025-08-13 | 13F | Vega Investment Solutions | 12.362 | 0,00 | 610 | 11,72 | ||||
| 2025-08-14 | 13F | Mml Investors Services, Llc | 48.294 | 0,81 | 2 | 0,00 | ||||
| 2025-07-14 | 13F | AdvisorNet Financial, Inc | 88 | 0,00 | 4 | 33,33 | ||||
| 2025-08-08 | 13F | Creative Planning | 16.101 | -13,17 | 795 | -2,82 | ||||
| 2025-08-12 | 13F | TCTC Holdings, LLC | 18.200 | 0,00 | 899 | 11,97 | ||||
| 2025-08-06 | 13F | AE Wealth Management LLC | 120 | 0,00 | 6 | 0,00 | ||||
| 2025-08-12 | 13F | Global Retirement Partners, LLC | 6.323 | 34,53 | 312 | 52,20 | ||||
| 2025-05-14 | 13F | Truvestments Capital Llc | 0 | -100,00 | 0 | |||||
| 2025-07-31 | 13F | CVA Family Office, LLC | 3.916 | 0,00 | 193 | 12,21 | ||||
| 2025-08-14 | 13F | Citadel Advisors Llc | Put | 0 | -100,00 | 0 | ||||
| 2025-08-11 | 13F | Hexagon Capital Partners LLC | 0 | -100,00 | 0 | |||||
| 2025-07-30 | 13F | Whittier Trust Co | 75 | 0,00 | 4 | 0,00 | ||||
| 2025-08-12 | 13F | Steward Partners Investment Advisory, Llc | 2.390 | -87,02 | 118 | -85,57 | ||||
| 2025-08-13 | 13F | Schroder Investment Management Group | 1.400 | 0,00 | 69 | 13,11 | ||||
| 2025-07-30 | 13F | Whittier Trust Co Of Nevada Inc | 4.275 | 66,67 | 211 | 86,73 | ||||
| 2025-08-01 | 13F | Banco Santander, S.A. | 160.399 | 54,59 | 7.919 | 73,07 | ||||
| 2025-08-14 | 13F | Royal Bank Of Canada | 203.991 | 87,01 | 10.072 | 109,40 | ||||
| 2025-08-14 | 13F | Partners Capital Investment Group, Llp | 138.569 | -48,12 | 6.841 | -41,91 | ||||
| 2025-07-15 | 13F | Fifth Third Bancorp | 550 | 0,00 | 27 | 12,50 | ||||
| 2025-08-13 | 13F | Cresset Asset Management, LLC | 0 | -100,00 | 0 | |||||
| 2025-08-14 | 13F | McIlrath & Eck, LLC | 0 | -100,00 | 0 | |||||
| 2025-07-22 | 13F | Highland Capital Management, Llc | 11.468 | 0,00 | 566 | 12,08 | ||||
| 2025-08-14 | 13F | Glenmede Investment Management, LP | 600 | 30 | ||||||
| 2025-07-24 | NP | SPDAX - DWS Multi-Asset Conservative Allocation Fund Class A | 9.818 | 0,00 | 474 | 7,74 | ||||
| 2025-08-14 | 13F | FIL Ltd | 25.983 | -39,45 | 1.283 | -32,24 | ||||
| 2025-07-11 | 13F | Afg Fiduciary Services Limited Partnership | 18.798 | 0,00 | 927 | 17,19 | ||||
| 2025-08-13 | 13F | Metlife Inc | 8.803 | -1,96 | 435 | 9,60 | ||||
| 2025-07-14 | 13F | GAMMA Investing LLC | 80 | 4 | ||||||
| 2025-08-08 | 13F | Abc Arbitrage Sa | 15.541 | 24,23 | 767 | 39,20 | ||||
| 2025-08-14 | 13F | Jane Street Group, Llc | 53.267 | -73,92 | 2.630 | -70,81 | ||||
| 2025-08-14 | 13F | UBS Group AG | 525.598 | 17,38 | 25.949 | 31,41 | ||||
| 2025-07-15 | 13F | Compagnie Lombard Odier SCmA | 6.150 | 0,00 | 304 | 11,81 | ||||
| 2025-07-09 | 13F | Breakwater Investment Management | 1.005 | 0,00 | 50 | 11,36 | ||||
| 2025-07-31 | 13F | GenTrust, LLC | 4.490 | -10,20 | 222 | 0,45 | ||||
| 2025-08-05 | 13F | Simplex Trading, Llc | 0 | -100,00 | 0 | |||||
| 2025-08-12 | 13F | Deutsche Bank Ag\ | 361.374 | -25,12 | 17.841 | -16,17 | ||||
| 2025-08-15 | 13F | Morgan Stanley | 1.266.672 | -26,40 | 62.536 | -17,60 | ||||
| 2025-05-15 | 13F | Glenmede Trust Co Na | 600 | 0,00 | 26 | 0,00 | ||||
| 2025-08-13 | 13F | Colonial Trust Advisors | 300 | 0,00 | 15 | 7,69 | ||||
| 2025-08-14 | 13F | Qube Research & Technologies Ltd | 32.505 | 419,83 | 1.605 | 483,27 | ||||
| 2025-08-07 | 13F | Allworth Financial LP | 220 | 340,00 | 11 | 400,00 | ||||
| 2025-08-05 | 13F | Bank Of Montreal /can/ | 4.555 | 9,52 | 225 | 22,40 | ||||
| 2025-08-11 | 13F | Brown Brothers Harriman & Co | 15 | 0,00 | 1 | |||||
| 2025-08-05 | 13F | Bank of New York Mellon Corp | 28.582 | 0,00 | 1.411 | 11,98 | ||||
| 2025-05-15 | 13F | Manufacturers Life Insurance Company, The | 0 | -100,00 | 0 | |||||
| 2025-08-14 | 13F | Engineers Gate Manager LP | 0 | -100,00 | 0 | |||||
| 2025-08-08 | 13F | Mv Capital Management, Inc. | 420 | 43,34 | 21 | 66,67 | ||||
| 2025-08-12 | 13F | Proequities, Inc. | 0 | 0 | ||||||
| 2025-08-13 | 13F | Green Harvest Asset Management LLC | 7.373 | -1,23 | 364 | 10,64 | ||||
| 2025-07-31 | 13F | Cambridge Investment Research Advisors, Inc. | 10.246 | -71,98 | 1 | -100,00 | ||||
| 2025-07-25 | 13F | Sequoia Financial Advisors, LLC | 5.355 | -8,70 | 264 | 2,33 | ||||
| 2025-08-14 | 13F | Wells Fargo & Company/mn | 134.878 | 0,92 | 6.659 | 12,98 | ||||
| 2025-07-18 | 13F | USA Financial Portformulas Corp | 3.061 | -35,30 | 151 | -27,40 | ||||
| 2025-05-14 | 13F | Oarsman Capital, Inc. | 0 | -100,00 | 0 |