Statistiche di base
| Azioni istituzionali (Long) | 587.582.579 - 65,54% (ex 13D/G) - change of 53,79MM shares 10,08% MRQ |
| Valore istituzionale (Long) | $ 953.283 USD ($1000) |
Proprietà istituzionale e azionisti
Denison Mines Corp. (US:DNN) ha 263 proprietari istituzionali e azionisti che hanno presentato i moduli 13D/G o 13F alla Securities Exchange Commission (SEC). Queste istituzioni detengono un totale di 587,582,579 azioni. I maggiori azionisti includono Alps Advisors Inc, Van Eck Associates Corp, MIRAE ASSET GLOBAL ETFS HOLDINGS Ltd., URA - Global X Uranium ETF, NLR - VanEck Vectors Uranium+Nuclear Energy ETF, Sprott Funds Trust - Sprott Uranium Miners Etf, Segra Capital Management, LLC, Hood River Capital Management LLC, SPROTT FUNDS TRUST - Sprott Junior Uranium Miners ETF, and HRSMX - Hood River Small-Cap Growth Fund Institutional Shares .
(Denison Mines Corp. (NYSEAM:DNN) la struttura proprietaria istituzionale mostra le attuali posizioni nella società da parte di istituzioni e fondi, nonché le ultime variazioni nella dimensione della posizione. I principali azionisti possono essere singoli investitori, fondi comuni, hedge fund o istituzioni. L'allegato 13D indica che l'investitore detiene (o ha detenuto) più del 5% della società e intende (o intendeva) perseguire attivamente un cambiamento nella strategia aziendale. L'allegato 13G indica un investimento passivo superiore al 5%.
The share price as of September 4, 2025 is 2,28 / share. Previously, on September 5, 2024, the share price was 1,49 / share. This represents an increase of 53,02% over that period.

Indice del sentiment dei fondi
L'indice del sentiment dei fondi (anche noto come "indice di accumulo di proprietà") individua i titoli più acquistati dai fondi. È il risultato di un sofisticato modello quantitativo multi-fattore che identifica le società con i più alti livelli di accumulo istituzionale. Il modello utilizza una combinazione dell'aumento totale dei proprietari dichiarati, delle variazioni nelle allocazioni di portafoglio di tali proprietari e di altre metriche. Il punteggio varia da 0 a 100: i numeri più alti indicano un livello di accumulo superiore ad altre società, mentre 50 rappresenta la media.
Frequenza di aggiornamento: giornaliera
Consulta Ownership Explorer per visualizzare l'elenco delle aziende con il ranking più alto.
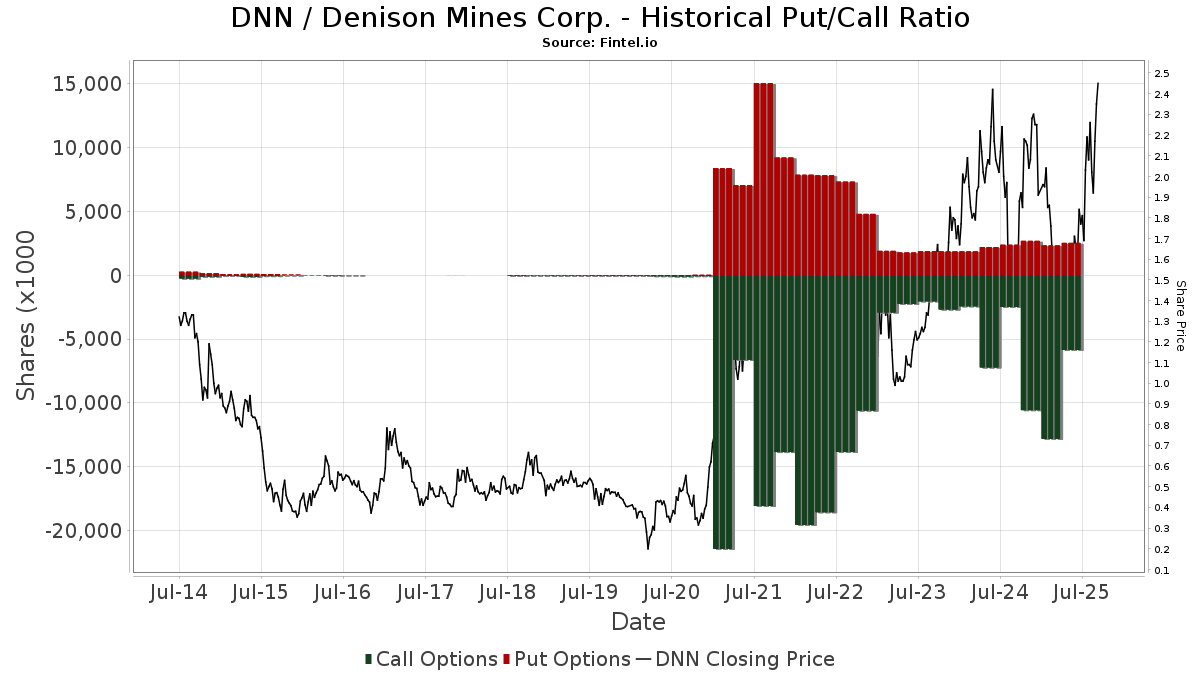
Rapporto put/call istituzionale
Oltre a segnalare le emissioni standard di titoli azionari e di debito, gli istituti con più di 100 milioni di asset in gestione devono anche dichiarare le loro partecipazioni in opzioni put e call. Poiché le opzioni put indicano generalmente un sentiment negativo e le opzioni call un sentiment positivo, possiamo avere un'idea del sentiment istituzionale complessivo attraverso il rapporto tra put e call. Il grafico a destra mostra il rapporto storico put/call per questo strumento.
L'utilizzo del rapporto put/call come indicatore del sentiment degli investitori consente di superare una delle principali lacune dell'utilizzo della proprietà istituzionale totale, ovvero il fatto che una quantità significativa di asset in gestione viene investita passivamente per seguire gli indici. Generalmente, i fondi a gestione passiva non acquistano opzioni, per cui il rapporto put/call riflette più fedelmente il sentiment dei fondi a gestione attiva.
Depositi 13D/G
Presentiamo i depositi 13D/G separatamente dai depositi 13F a causa del diverso trattamento da parte della SEC. I depositi 13D/G possono essere presentati da gruppi di investitori (con un unico leader), mentre i depositi 13F no. Ciò comporta situazioni in cui un investitore può depositare un documento 13D/G riportando un valore per il totale delle azioni (che rappresenta tutte le azioni possedute dal gruppo di investitori), e poi depositare un documento 13F riportando un valore diverso per il totale delle azioni (che rappresenta esclusivamente la propria proprietà). Ciò significa che la proprietà delle azioni nei depositi 13D/G e nei depositi 13F spesso non sono direttamente comparabili, pertanto le presentiamo separatamente.
Nota: a partire dal 16 maggio 2021, non mostriamo più i proprietari che non hanno depositato un documento 13D/G nellultimo anno. In precedenza, mostravamo lintero storico dei depositi 13D/G. In generale, le entità che sono tenute a depositare i documenti 13D/G devono farlo almeno una volta all'anno prima di presentare un deposito di chiusura. Tuttavia, a volte i fondi escono dalle posizioni senza presentare un deposito di chiusura (cioè, procedono a una liquidazione), per cui la visualizzazione dell'intero storico a volte generava confusione sull'attuale proprietà. Per evitare confusione, ora mostriamo solo i proprietari "attuali", ossia quelli che hanno effettuato un deposito nell'ultimo anno.
Upgrade to unlock premium data.
| Data di deposito | Modulo | Investitore | Azioni precedenti |
Ultime azioni |
Δ Azioni (Percentuale) |
Proprietà (Percentuale) |
Δ Proprietà (Percentuale) |
|
|---|---|---|---|---|---|---|---|---|
| 2025-08-14 | VAN ECK ASSOCIATES CORP | 53,746,220 | 5.99 | |||||
| 2025-08-14 | Global X Management CO LLC | 62,240,343 | 50,280,944 | -19.21 | 5.61 | -19.51 |
Depositi 13F e NPORT
Le informazioni relative ai depositi 13F sono gratuite. Per accedere alle informazioni relative ai depositi NP è necessario un'abbonamento premium. Le righe verdi indicano le nuove posizioni. Le righe rosse indicano le posizioni chiuse. Fai clic sull'icona del link per visualizzare la cronologia completa delle transazioni.
Esegui l'upgrade
per sbloccare i dati premium ed esportarli in Excel ![]() .
.
| Data di deposito | Fonte | Investitore | Tipo | Prezzo medio (Stima) |
Azioni | Δ Azioni (%) |
Valore dichiarato ($ 1000) |
Δ Valore (%) |
Allocazione del portafoglio (%) |
|
|---|---|---|---|---|---|---|---|---|---|---|
| 2025-07-15 | 13F | Public Employees Retirement System Of Ohio | 206.652 | -6,85 | 377 | 30,45 | ||||
| 2025-08-05 | 13F | GPS Wealth Strategies Group, LLC | 9.666 | 0,00 | 18 | 41,67 | ||||
| 2025-05-30 | NP | WASIX - Seven Canyons Strategic Income Fund Investor Class | 336.000 | 437 | ||||||
| 2025-03-26 | NP | DFA INVESTMENT DIMENSIONS GROUP INC - International Social Core Equity Portfolio Institutional Class This fund is a listed as child fund of Dimensional Fund Advisors Lp and if that institution has disclosed ownership in this security, then these positions will not be double counted when calculating total shares and total value | 97.775 | 0,00 | 179 | -13,17 | ||||
| 2025-07-22 | 13F | IMC-Chicago, LLC | 257.990 | 2,08 | 470 | 42,99 | ||||
| 2025-07-09 | 13F | Shore Point Advisors, LLC | 10.000 | 0,00 | 18 | 38,46 | ||||
| 2025-07-22 | 13F | IMC-Chicago, LLC | Put | 215.100 | 6,59 | 391 | 49,24 | |||
| 2025-07-28 | 13F | Harbour Investments, Inc. | 1.108 | -59,08 | 2 | -33,33 | ||||
| 2025-08-15 | 13F | CI Private Wealth, LLC | 20.000 | 0,00 | 36 | 38,46 | ||||
| 2025-06-26 | NP | IDEV - iShares Core MSCI International Developed Markets ETF | 1.080.776 | 9,79 | 1.552 | -13,83 | ||||
| 2025-08-28 | NP | SPDW - SPDR(R) Portfolio Developed World ex-US ETF | 410.589 | 2,76 | 749 | 43,76 | ||||
| 2025-07-28 | 13F | Mutual Advisors, LLC | 16.531 | 0,00 | 37 | 63,64 | ||||
| 2025-08-12 | 13F | SRS Capital Advisors, Inc. | 2.000 | 0,00 | 4 | 50,00 | ||||
| 2025-08-19 | 13F | Advisory Services Network, LLC | 17.200 | -20,00 | 36 | 29,63 | ||||
| 2025-06-24 | NP | TLTD - FlexShares Morningstar Developed Markets ex-US Factor Tilt Index Fund | 19.424 | 0,00 | 28 | -22,86 | ||||
| 2025-08-08 | 13F | Old West Investment Management, LLC | 694.614 | 70,12 | 1.264 | 138,49 | ||||
| 2025-08-14 | 13F | Farringdon Capital, Ltd. | 0 | -100,00 | 0 | -100,00 | ||||
| 2025-08-07 | 13F | Rathbone Brothers plc | 75.300 | 0,00 | 137 | 39,80 | ||||
| 2025-08-13 | 13F | Renaissance Technologies Llc | 5.152.401 | -57,34 | 9.377 | -40,27 | ||||
| 2025-08-29 | 13F | Centaurus Financial, Inc. | 14.175 | 0,00 | 0 | |||||
| 2025-08-12 | 13F | Kimelman & Baird, LLC | 517 | 0,00 | 1 | |||||
| 2025-08-13 | 13F | Amundi | 0 | -100,00 | 0 | |||||
| 2025-08-14 | 13F | Hood River Capital Management LLC | 26.596.628 | -1,12 | 48.406 | 38,43 | ||||
| 2025-08-13 | 13F | Flow Traders U.s. Llc | 82.445 | 0 | ||||||
| 2025-08-15 | 13F | Great West Life Assurance Co /can/ | 744.631 | 137,95 | 1 | |||||
| 2025-08-11 | 13F | TD Waterhouse Canada Inc. | 322.108 | 3.076,29 | 563 | 4.223,08 | ||||
| 2025-08-12 | 13F | Legal & General Group Plc | 1.070.969 | 20,74 | 1.954 | 68,74 | ||||
| 2025-08-13 | 13F | De Lisle Partners LLP | 2.037.909 | 7,95 | 3.709 | 51,10 | ||||
| 2025-08-14 | 13F | Colony Group, LLC | 14.800 | 27 | ||||||
| 2025-08-14 | 13F | Headlands Technologies LLC | 231.658 | 7.014,80 | 422 | 10.425,00 | ||||
| 2025-07-16 | 13F | ORG Partners LLC | 5.750 | 0,00 | 10 | 42,86 | ||||
| 2025-08-13 | 13F | Russell Investments Group, Ltd. | 970.034 | 0,00 | 1.770 | 39,70 | ||||
| 2025-08-04 | 13F | Pensionmark Financial Group, Llc | 10.000 | 18 | ||||||
| 2025-08-14 | 13F | Bank Of America Corp /de/ | 1.352.928 | -40,30 | 2.462 | -16,40 | ||||
| 2025-05-15 | 13F | Two Sigma Advisers, Lp | 0 | -100,00 | 0 | |||||
| 2025-06-26 | NP | DFAX - Dimensional World ex U.S. Core Equity 2 ETF | 146.292 | 0,00 | 210 | -22,01 | ||||
| 2025-05-21 | 13F/A | Geneos Wealth Management Inc. | 500 | 0,00 | 1 | |||||
| 2025-08-14 | 13F | Two Sigma Investments, Lp | 947.878 | 1.725 | ||||||
| 2025-05-12 | 13F | Fmr Llc | 0 | -100,00 | 0 | |||||
| 2025-05-15 | 13F | Oxford Asset Management Llp | 0 | -100,00 | 0 | -100,00 | ||||
| 2025-08-28 | NP | SSGVX - State Street Global Equity ex-U.S. Index Portfolio State Street Global All Cap Equity ex-U.S. Index Portfolio This fund is a listed as child fund of State Street Corp and if that institution has disclosed ownership in this security, then these positions will not be double counted when calculating total shares and total value | 235.400 | 0,00 | 430 | 39,74 | ||||
| 2025-08-12 | 13F | Jpmorgan Chase & Co | 0 | -100,00 | 0 | -100,00 | ||||
| 2025-08-14 | 13F | CIBC Asset Management Inc | 803.334 | -22,83 | 1.468 | 7,94 | ||||
| 2025-04-08 | 13F | Rothschild Investment Llc | 0 | -100,00 | 0 | |||||
| 2025-08-13 | 13F | Bridgewater Associates, LP | 4.617.008 | -41,19 | 8.403 | -17,68 | ||||
| 2025-08-14 | 13F | Ardsley Advisory Partners Lp | 2.000.000 | 100,00 | 3.640 | 180,00 | ||||
| 2025-08-12 | 13F | Winnow Wealth Llc | 340.913 | 620 | ||||||
| 2025-08-14 | 13F | Citadel Advisors Llc | Put | 710.700 | -2,17 | 1.293 | 36,97 | |||
| 2025-08-14 | 13F | Hrt Financial Lp | 69.971 | -95,42 | 0 | -100,00 | ||||
| 2025-08-11 | 13F | Banque Cantonale Vaudoise | 288.364 | 1 | ||||||
| 2025-08-14 | 13F | GeoSphere Capital Management | 1.300.000 | 2.366 | ||||||
| 2025-08-11 | 13F | Sprott Inc. | 798.498 | 3,42 | 1.453 | 44,87 | ||||
| 2025-08-27 | NP | TIFF INVESTMENT PROGRAM - TIFF Multi-Asset Fund | 997.790 | 19,93 | 1.816 | 67,90 | ||||
| 2025-08-08 | 13F | Avantax Advisory Services, Inc. | 27.400 | 5,79 | 50 | 48,48 | ||||
| 2025-07-16 | 13F | Eagle Global Advisors Llc | 205.400 | 0,00 | 374 | 39,70 | ||||
| 2025-08-12 | 13F | NFP Retirement, Inc. | 83.000 | 0,00 | 151 | 41,12 | ||||
| 2025-08-14 | 13F | Optiver Holding B.V. | 0 | -100,00 | 0 | |||||
| 2025-08-14 | 13F | Group One Trading, L.p. | 373.222 | 107,54 | 679 | 191,42 | ||||
| 2025-08-04 | 13F | Assetmark, Inc | 1.000 | 0,00 | 2 | 0,00 | ||||
| 2025-08-13 | 13F | Bank Of Nova Scotia | 13.828 | -51,72 | 25 | -32,43 | ||||
| 2025-08-14 | 13F | ArrowMark Colorado Holdings LLC | 2.499.000 | 26,53 | 4.548 | 77,17 | ||||
| 2025-08-29 | 13F | Total Investment Management Inc | 1.221 | 2 | ||||||
| 2025-08-14 | 13F | Group One Trading, L.p. | Put | 302.600 | 7,19 | 551 | 50,27 | |||
| 2025-08-14 | 13F | Vident Advisory, LLC | 9.755.610 | 41,92 | 17.755 | 98,69 | ||||
| 2025-08-14 | 13F | Group One Trading, L.p. | Call | 2.579.600 | -57,98 | 4.695 | -41,19 | |||
| 2025-06-26 | NP | DFIS - Dimensional International Small Cap ETF | 0 | -100,00 | 0 | -100,00 | ||||
| 2025-08-12 | 13F | Fulcrum Asset Management LLP | Put | 0 | -100,00 | 0 | -100,00 | |||
| 2025-08-13 | 13F | Marshall Wace, Llp | 0 | -100,00 | 0 | |||||
| 2025-07-14 | 13F | Legacy Capital Group California, Inc. | 122.887 | 69,88 | 224 | 137,23 | ||||
| 2025-08-25 | NP | AMERICAN FUNDS INSURANCE SERIES - Global Small Capitalization Fund Class 1 This fund is a listed as child fund of Capital World Investors and if that institution has disclosed ownership in this security, then these positions will not be double counted when calculating total shares and total value | 1.375.744 | 41,22 | 2.516 | 97,72 | ||||
| 2025-07-29 | 13F | Mb, Levis & Associates, Llc | 152 | 0,00 | 0 | |||||
| 2025-08-14 | 13F | Goldman Sachs Group Inc | 4.482.265 | 165,56 | 8.158 | 271,79 | ||||
| 2025-04-28 | NP | CRIT - Optica Rare Earths & Critical Materials ETF | 18.795 | -1,70 | 28 | -39,13 | ||||
| 2025-07-23 | 13F | Shell Asset Management Co | 45.871 | 3,15 | 0 | |||||
| 2025-08-11 | 13F | HighTower Advisors, LLC | 87.330 | -14,53 | 159 | 19,70 | ||||
| 2025-07-23 | 13F | Vontobel Holding Ltd. | 182.274 | -1,35 | 334 | 38,17 | ||||
| 2025-08-12 | 13F | Nuveen, LLC | 674.581 | -14,22 | 1.231 | 19,86 | ||||
| 2025-08-13 | 13F | Mirabella Financial Services Llp | 0 | -100,00 | 0 | |||||
| 2025-08-11 | 13F | Citigroup Inc | 218.317 | 94,17 | 398 | 172,60 | ||||
| 2025-07-25 | 13F | Welch Group, LLC | 11.428 | 0,00 | 21 | 33,33 | ||||
| 2025-07-14 | 13F | UMA Financial Services, Inc. | 140 | 0,00 | 0 | |||||
| 2025-08-13 | 13F | Jones Financial Companies Lllp | 6.952 | 117,25 | 12 | 200,00 | ||||
| 2025-08-07 | 13F | Zurcher Kantonalbank (Zurich Cantonalbank) | 252.645 | -1,10 | 461 | 38,44 | ||||
| 2025-08-12 | 13F | LPL Financial LLC | 132.938 | -14,32 | 242 | 19,90 | ||||
| 2025-03-21 | NP | PASIX - PACE Alternative Strategies Investments Class A | 0 | -100,00 | 0 | -100,00 | ||||
| 2025-07-16 | 13F | Arlington Capital Management, Inc. | 0 | -100,00 | 0 | |||||
| 2025-05-12 | 13F | Fiduciary Family Office, Llc | 0 | -100,00 | 0 | -100,00 | ||||
| 2025-07-29 | 13F | JTC Employer Solutions Trusteee Ltd | 11.356 | 0,00 | 0 | |||||
| 2025-08-25 | NP | SMCWX - SMALLCAP WORLD FUND INC Class A | 10.080.191 | 28,33 | 18.432 | 79,62 | ||||
| 2025-05-16 | 13F | McIlrath & Eck, LLC | 0 | -100,00 | 0 | |||||
| 2025-08-14 | 13F | Arosa Capital Management LP | 1.285.200 | -12,01 | 2.339 | 23,23 | ||||
| 2025-08-04 | 13F | Center for Financial Planning, Inc. | 490 | 0,00 | 1 | |||||
| 2025-08-14 | 13F | Caption Management, LLC | Call | 120.200 | 219 | |||||
| 2025-07-21 | 13F | Mirae Asset Global Investments Co., Ltd. | 0 | -100,00 | 0 | -100,00 | ||||
| 2025-08-14 | 13F | Caption Management, LLC | 700.000 | 833,33 | 1.274 | 1.213,40 | ||||
| 2025-08-25 | NP | SPROTT FUNDS TRUST - Sprott Junior Uranium Miners ETF | 19.402.291 | 21,33 | 35.312 | 69,86 | ||||
| 2025-05-07 | 13F | David R. Rahn & Associates Inc. | 0 | -100,00 | 0 | |||||
| 2025-08-13 | 13F | Pictet Asset Management Holding SA | 129.090 | -18,61 | 236 | 13,53 | ||||
| 2025-08-05 | 13F | Bank Of Montreal /can/ | Put | 11.400 | 0,00 | 21 | 42,86 | |||
| 2025-07-31 | 13F | Caitong International Asset Management Co., Ltd | 58.512 | 7.904,38 | 106 | |||||
| 2025-08-14 | 13F | Federation des caisses Desjardins du Quebec | 1.782.708 | -0,05 | 3.246 | 39,99 | ||||
| 2025-08-11 | 13F | Aptus Capital Advisors, LLC | 37.000 | 0,00 | 67 | 39,58 | ||||
| 2025-06-26 | NP | DFIEX - International Core Equity Portfolio - Institutional Class This fund is a listed as child fund of Dimensional Fund Advisors Lp and if that institution has disclosed ownership in this security, then these positions will not be double counted when calculating total shares and total value | 1.668.715 | 0,00 | 2.397 | -21,55 | ||||
| 2025-08-07 | 13F | Hennion & Walsh Asset Management, Inc. | 223.412 | 63,62 | 407 | 129,38 | ||||
| 2025-08-14 | 13F | Southport Management, L.l.c. | 91.000 | 37,88 | 166 | 94,12 | ||||
| 2025-07-23 | 13F | Triasima Portfolio Management inc. | 0 | -100,00 | 0 | |||||
| 2025-08-13 | 13F/A | StoneX Group Inc. | 0 | -100,00 | 0 | -100,00 | ||||
| 2025-08-04 | 13F | Deuterium Capital Management, LLC | 120.243 | 0,00 | 219 | 39,74 | ||||
| 2025-08-12 | 13F | Fulcrum Asset Management LLP | 17.057 | 31 | ||||||
| 2025-08-13 | 13F | Falcon Edge Capital, LP | 1.843.479 | 56,22 | 3.355 | 118,71 | ||||
| 2025-07-31 | 13F | R Squared Ltd | 21.660 | 39 | ||||||
| 2025-08-06 | 13F | Commonwealth Equity Services, Llc | 20.264 | 4,11 | 0 | |||||
| 2025-07-22 | 13F | DAVENPORT & Co LLC | 150.000 | 0,00 | 273 | 40,00 | ||||
| 2025-07-22 | NP | GRHIX - Goehring & Rozencwajg Resources Fund Institutional Class Shares | 2.026.200 | 0,00 | 3.222 | 6,69 | ||||
| 2025-08-05 | 13F | Bank Of Montreal /can/ | 3.974.353 | 60,38 | 7.272 | 124,55 | ||||
| 2025-08-13 | 13F | Beutel, Goodman & Co Ltd. | 5.856.260 | -3,31 | 11 | 42,86 | ||||
| 2025-08-14 | 13F | Van Eck Associates Corp | 53.454.626 | 57,99 | 97 | 125,58 | ||||
| 2025-06-26 | NP | DFA INVESTMENT DIMENSIONS GROUP INC - World ex U.S. Core Equity Portfolio Institutional Class Shares | 90.674 | 0,00 | 130 | -21,21 | ||||
| 2025-08-04 | 13F | Bay Colony Advisory Group, Inc d/b/a Bay Colony Advisors | 12.502 | 19,04 | 23 | 69,23 | ||||
| 2025-08-13 | 13F | New Harbor Financial Group, LLC | 25.000 | -10,71 | 46 | 25,00 | ||||
| 2025-08-14 | 13F | Toronto Dominion Bank | Call | 0 | -100,00 | 0 | -100,00 | |||
| 2025-08-07 | 13F | CENTRAL TRUST Co | 0 | -100,00 | 0 | |||||
| 2025-08-14 | 13F | Toronto Dominion Bank | 28.603 | 1,53 | 52 | 44,44 | ||||
| 2025-08-13 | 13F | Continuum Advisory, LLC | 34.141 | 2,20 | 62 | 44,19 | ||||
| 2025-08-14 | 13F | Peak6 Llc | 20.075 | 37 | ||||||
| 2025-08-14 | 13F | Peak6 Llc | Put | 50.000 | 0,00 | 91 | 40,00 | |||
| 2025-08-14 | 13F | Mariner, LLC | 37.718 | -13,04 | 69 | 21,43 | ||||
| 2025-08-11 | 13F | Vanguard Group Inc | 737.947 | 0,00 | 1.349 | 39,94 | ||||
| 2025-08-14 | 13F | Peak6 Llc | Call | 46.500 | -94,81 | 85 | -92,79 | |||
| 2025-08-13 | 13F | ExodusPoint Capital Management, LP | 706.100 | 1 | ||||||
| 2025-08-27 | NP | ALLIANZ VARIABLE INSURANCE PRODUCTS TRUST - AZL DFA International Core Equity Fund | 5.000 | 0,00 | 9 | 50,00 | ||||
| 2025-05-14 | 13F | Oarsman Capital, Inc. | 0 | -100,00 | 0 | |||||
| 2025-08-13 | 13F | Tejara Capital Ltd | 338.286 | -56,36 | 616 | -38,93 | ||||
| 2025-08-25 | NP | MVALX - MERIDIAN CONTRARIAN FUND Legacy Class | 2.499.000 | 26,53 | 4.548 | 77,17 | ||||
| 2025-05-14 | 13F | PineBridge Investments, L.P. | 0 | -100,00 | 0 | |||||
| 2025-08-14 | 13F | Toroso Investments, LLC | 31.769 | -23,29 | 58 | 7,55 | ||||
| 2025-08-12 | 13F | XTX Topco Ltd | 757.158 | 503,98 | 1.378 | 750,62 | ||||
| 2025-08-06 | 13F | MMCAP International Inc. SPC | 13.412.284 | -43,87 | 24.410 | -21,42 | ||||
| 2025-08-12 | 13F | Goehring & Rozencwajg Associates, LLC | 3.756.986 | -0,95 | 6.838 | 17,82 | ||||
| 2025-08-19 | 13F/A | L1 Capital Pty Ltd | 301.620 | 552 | ||||||
| 2025-08-15 | NP | MBEQX - M International Equity Fund | 7.600 | 0,00 | 14 | 44,44 | ||||
| 2025-08-13 | 13F | Scotia Capital Inc. | 240.107 | 2,48 | 437 | 43,75 | ||||
| 2025-08-14 | 13F | Wells Fargo & Company/mn | 1.408.602 | -11,35 | 2.564 | 24,12 | ||||
| 2025-05-15 | 13F | Tower Research Capital LLC (TRC) | 0 | -100,00 | 0 | |||||
| 2025-08-12 | 13F | Pathstone Holdings, LLC | 19.300 | 0,00 | 35 | 40,00 | ||||
| 2025-07-28 | 13F | Triton Wealth Management, PLLC | 10.000 | 0,00 | 23 | 10,00 | ||||
| 2025-08-14 | 13F | Segra Capital Management, LLC | 33.901.398 | 12,63 | 61.701 | 57,69 | ||||
| 2025-08-14 | 13F | Mangrove Partners | 465.275 | 0,00 | 847 | 40,07 | ||||
| 2025-06-26 | NP | DFA INVESTMENT DIMENSIONS GROUP INC - International Vector Equity Portfolio Shares | 174.739 | 0,00 | 251 | -21,63 | ||||
| 2025-08-13 | 13F | Northwest & Ethical Investments L.P. | 67.819 | -18,57 | 124 | 13,89 | ||||
| 2025-08-12 | 13F | Global Retirement Partners, LLC | 0 | -100,00 | 0 | |||||
| 2025-08-14 | 13F | Scientech Research LLC | 39.326 | 72 | ||||||
| 2025-08-14 | 13F | Integrity Wealth Advisors, Inc. | 59.700 | 0,00 | 109 | 40,26 | ||||
| 2025-04-02 | 13F | Marcum Wealth, LLC | 50.000 | 0,00 | 65 | -27,78 | ||||
| 2025-08-13 | 13F | Invesco Ltd. | 26.631 | 0,33 | 48 | 41,18 | ||||
| 2025-08-14 | 13F | Susquehanna International Group, Llp | 5.310.393 | 101,57 | 9.665 | 182,24 | ||||
| 2025-08-19 | 13F | National Asset Management, Inc. | 21.000 | -16,00 | 38 | -15,56 | ||||
| 2025-07-24 | 13F | U S Global Investors Inc | 0 | -100,00 | 0 | |||||
| 2025-08-14 | 13F | Susquehanna International Group, Llp | Call | 816.900 | -75,77 | 1.487 | -66,10 | |||
| 2025-08-01 | 13F | Vision Financial Markets Llc | 157 | 0,00 | 0 | |||||
| 2025-08-14 | 13F | Susquehanna International Group, Llp | Put | 888.300 | 29,66 | 1.617 | 81,57 | |||
| 2025-06-26 | NP | DFIC - Dimensional International Core Equity 2 ETF | 167.002 | 0,00 | 235 | -22,44 | ||||
| 2025-08-14 | 13F | Alliancebernstein L.p. | 322.181 | 7,12 | 586 | 49,87 | ||||
| 2025-08-12 | 13F | BlackRock, Inc. | 418.217 | -0,58 | 761 | 39,38 | ||||
| 2025-08-05 | 13F | Simplex Trading, Llc | 0 | -100,00 | 0 | |||||
| 2025-08-06 | 13F | Rialto Wealth Management, LLC | 6.000 | 0,00 | 11 | 42,86 | ||||
| 2025-08-14 | 13F | Integrated Investment Consultants, LLC | 15.000 | 0,00 | 27 | 42,11 | ||||
| 2025-08-12 | 13F | Swiss National Bank | 1.723.400 | -0,97 | 3.139 | 37,98 | ||||
| 2025-03-26 | NP | DFA INVESTMENT DIMENSIONS GROUP INC - International Small Cap Growth Portfolio Institutional Class This fund is a listed as child fund of Dimensional Fund Advisors Lp and if that institution has disclosed ownership in this security, then these positions will not be double counted when calculating total shares and total value | 54.363 | 162,90 | 99 | 130,23 | ||||
| 2025-08-12 | 13F | Deutsche Bank Ag\ | 63.468 | 0,00 | 116 | 40,24 | ||||
| 2025-08-15 | 13F | Morgan Stanley | 4.030.730 | -49,74 | 7.336 | -29,65 | ||||
| 2025-08-14 | 13F | Raymond James Financial Inc | 63.084 | 39,63 | 115 | 96,55 | ||||
| 2025-08-18 | 13F | Wolverine Trading, Llc | Put | 74.800 | -4,47 | 134 | 27,88 | |||
| 2025-05-15 | 13F | Cinctive Capital Management LP | 0 | -100,00 | 0 | |||||
| 2025-07-17 | 13F | Refined Wealth Management | 10.850 | 0,00 | 20 | 35,71 | ||||
| 2025-07-23 | 13F | Sachetta, LLC | 5.000 | 0,00 | 9 | 50,00 | ||||
| 2025-08-14 | 13F | Two Sigma Securities, Llc | 503.270 | 1.016,02 | 916 | 1.477,59 | ||||
| 2025-08-18 | 13F | Wolverine Trading, Llc | 45.782 | -24,24 | 82 | 1,25 | ||||
| 2025-08-18 | 13F | Wolverine Trading, Llc | Call | 280.800 | -14,34 | 503 | 15,40 | |||
| 2025-08-14 | 13F | Investment Management Corp of Ontario | 50.569 | -5,07 | 92 | 33,33 | ||||
| 2025-05-27 | NP | PSPFX - Global Resources Fund | 50.000 | -56,52 | 65 | -68,60 | ||||
| 2025-07-10 | 13F | Wealth Enhancement Advisory Services, Llc | 64.521 | 504,75 | 117 | 800,00 | ||||
| 2025-08-14 | 13F | Integrated Wealth Concepts LLC | 18.551 | 1,07 | 34 | 43,48 | ||||
| 2025-08-14 | 13F/A | Barclays Plc | 185.975 | -0,61 | 0 | |||||
| 2025-08-12 | 13F | Steward Partners Investment Advisory, Llc | 6.000 | 0,00 | 11 | 42,86 | ||||
| 2025-08-06 | 13F | Titan Global Capital Management Usa Llc | 1.961.719 | 15,56 | 3.570 | 61,83 | ||||
| 2025-07-21 | 13F | Azarias Capital Management, L.P. | 3.064.876 | 0,00 | 5.578 | 40,01 | ||||
| 2025-08-13 | 13F | Capital Research Global Investors | 11.455.935 | 29,75 | 20.948 | 81,61 | ||||
| 2025-08-06 | NP | LINCOLN VARIABLE INSURANCE PRODUCTS TRUST - LVIP Dimensional International Core Equity Fund Standard Class | 25.260 | 0,00 | 46 | 39,39 | ||||
| 2025-07-22 | 13F | Cedar Mountain Advisors, LLC | 749 | 0,00 | 1 | |||||
| 2025-08-08 | 13F | SG Americas Securities, LLC | 0 | -100,00 | 0 | |||||
| 2025-08-12 | 13F | Dimensional Fund Advisors Lp | 445.541 | -2,59 | 811 | 36,36 | ||||
| 2025-07-25 | 13F | JustInvest LLC | 25.857 | -17,33 | 47 | 17,50 | ||||
| 2025-08-14 | 13F | MIRAE ASSET GLOBAL ETFS HOLDINGS Ltd. | 50.305.240 | -13,46 | 91.799 | 20,90 | ||||
| 2025-07-14 | 13F | Pacifica Partners Inc. | 45.300 | 0,00 | 81 | 42,86 | ||||
| 2025-06-26 | NP | AMTAX - AB All Market Real Return Portfolio Class A | 253.996 | 365 | ||||||
| 2025-08-12 | 13F | Accordant Advisory Group Inc | 340.913 | -1,45 | 620 | 38,08 | ||||
| 2025-08-25 | NP | SETM - Sprott Energy Transition Materials ETF | 569.409 | 9,88 | 1.036 | 53,94 | ||||
| 2025-07-29 | NP | JISAX - International Small Company Fund Class NAV | 0 | -100,00 | 0 | -100,00 | ||||
| 2025-05-15 | 13F | Cubist Systematic Strategies, LLC | 0 | -100,00 | 0 | |||||
| 2025-07-17 | 13F | Vermillion Wealth Management, Inc. | 1.043 | 0,00 | 2 | 0,00 | ||||
| 2025-06-27 | NP | URA - Global X Uranium ETF This fund is a listed as child fund of Mirae Asset Global Investments Co., Ltd. and if that institution has disclosed ownership in this security, then these positions will not be double counted when calculating total shares and total value | 49.456.393 | -17,17 | 70.892 | -35,36 | ||||
| 2025-05-15 | 13F | D. E. Shaw & Co., Inc. | 0 | -100,00 | 0 | -100,00 | ||||
| 2025-08-14 | 13F | Ubs Asset Management Americas Inc | 1.390.082 | -7,59 | 2.530 | 29,36 | ||||
| 2025-08-12 | 13F | MAI Capital Management | 0 | -100,00 | 0 | |||||
| 2025-07-14 | 13F | AdvisorNet Financial, Inc | 7.202 | 18,28 | 13 | 85,71 | ||||
| 2025-08-07 | 13F | Allworth Financial LP | 2.424 | 1.854,84 | 4 | |||||
| 2025-08-12 | 13F | Atlas Capital Advisors Llc | 0 | -100,00 | 0 | |||||
| 2025-08-13 | 13F | Lido Advisors, LLC | 12.000 | -5,09 | 22 | 31,25 | ||||
| 2025-07-28 | 13F | Ritholtz Wealth Management | 11.788 | 21 | ||||||
| 2025-08-27 | NP | Brighthouse Funds Trust II - Brighthouse/Dimensional International Small Company Portfolio Class A | 87.299 | -1,80 | 160 | 37,07 | ||||
| 2025-08-11 | 13F | NewEdge Wealth, LLC | 15.000 | 0,00 | 34 | 73,68 | ||||
| 2025-08-15 | 13F | Kestra Advisory Services, LLC | 0 | -100,00 | 0 | |||||
| 2025-08-12 | 13F | J.w. Cole Advisors, Inc. | 58.620 | 54,26 | 107 | 116,33 | ||||
| 2025-06-26 | NP | Dfa Investment Dimensions Group Inc - Va International Small Portfolio This fund is a listed as child fund of Dimensional Fund Advisors Lp and if that institution has disclosed ownership in this security, then these positions will not be double counted when calculating total shares and total value | 14.027 | -71,90 | 20 | -73,24 | ||||
| 2025-08-14 | 13F | SIH Partners, LLLP | 0 | -100,00 | 0 | |||||
| 2025-07-24 | 13F | Total Wealth Planning & Management, Inc. | 24.100 | 12,09 | 44 | 59,26 | ||||
| 2025-08-14 | 13F | Lloyd Harbor Capital Management, LLC | 6.710.162 | 4,68 | 12.212 | 46,55 | ||||
| 2025-07-24 | 13F | Total Wealth Planning & Management, Inc. | Call | 5.000 | 0,00 | 12 | 33,33 | |||
| 2025-08-12 | 13F | Nemes Rush Group LLC | 500 | 0,00 | 1 | |||||
| 2025-09-04 | 13F | SevenBridge Financial Group, LLC | 37.000 | 0,00 | 80 | 41,07 | ||||
| 2025-07-31 | 13F | Fielder Capital Group LLC | 1.194.892 | -1,32 | 2.175 | 38,12 | ||||
| 2025-08-05 | 13F | Huntington National Bank | 0 | -100,00 | 0 | |||||
| 2025-07-17 | 13F | Sound Income Strategies, LLC | 5.400 | 0,00 | 10 | 28,57 | ||||
| 2025-08-05 | 13F | Ninepoint Partners LP | 235.000 | 0,00 | 428 | 40,00 | ||||
| 2025-05-14 | 13F | Credit Agricole S A | 0 | -100,00 | 0 | |||||
| 2025-05-15 | 13F | Point72 Asset Management, L.P. | 0 | -100,00 | 0 | |||||
| 2025-08-12 | 13F | Virtu Financial LLC | 1.150.616 | 426,18 | 2 | |||||
| 2025-08-13 | 13F | Formula Growth Ltd | 868.725 | 1.581 | ||||||
| 2025-08-01 | 13F | Brookwood Investment Group LLC | 71.215 | 321,71 | 130 | 514,29 | ||||
| 2025-08-14 | 13F | Janus Henderson Group Plc | 3.561.186 | 1,03 | 6.510 | 37,52 | ||||
| 2025-05-15 | 13F | Bayesian Capital Management, LP | 0 | -100,00 | 0 | -100,00 | ||||
| 2025-08-04 | 13F | Canton Hathaway, LLC | 41.000 | 0 | ||||||
| 2025-08-07 | 13F | Connor, Clark & Lunn Investment Management Ltd. | 8.945.229 | 35,39 | 16.367 | 89,61 | ||||
| 2025-08-08 | 13F | Keebeck Alpha, LP | 0 | -100,00 | 0 | -100,00 | ||||
| 2025-08-27 | 13F/A | Squarepoint Ops LLC | Call | 22.600 | 0,00 | 41 | 41,38 | |||
| 2025-05-27 | NP | HRITX - Hood River International Opportunity Fund Retirement Shares | 597.961 | 66,76 | 777 | 20,47 | ||||
| 2025-08-12 | 13F | Proequities, Inc. | Put | 0 | 0 | |||||
| 2025-08-13 | 13F | Level Four Advisory Services, Llc | 22.205 | -15,57 | 40 | 17,65 | ||||
| 2025-08-14 | 13F | BW Gestao de Investimentos Ltda. | 2.930.000 | 5.333 | ||||||
| 2025-08-14 | 13F | GWM Advisors LLC | 206.127 | -9,52 | 375 | 26,69 | ||||
| 2025-08-05 | 13F | VGI Partners Ltd | 493.445 | -50,69 | 898 | -30,98 | ||||
| 2025-08-12 | 13F | Proequities, Inc. | Call | 0 | 0 | |||||
| 2025-08-12 | 13F | Proequities, Inc. | 0 | 0 | ||||||
| 2025-08-27 | 13F/A | Squarepoint Ops LLC | Put | 28.200 | -0,70 | 51 | 41,67 | |||
| 2025-08-27 | 13F/A | Squarepoint Ops LLC | 139.573 | -24,95 | 254 | 5,39 | ||||
| 2025-07-25 | NP | FILL - iShares MSCI Global Energy Producers ETF | 27.242 | -5,63 | 43 | 0,00 | ||||
| 2025-08-08 | 13F | SBI Securities Co., Ltd. | 8.818 | 10,72 | 16 | 60,00 | ||||
| 2025-08-14 | 13F | Atomi Financial Group, Inc. | 41.000 | 0,17 | 75 | 39,62 | ||||
| 2025-08-06 | 13F | Stone House Investment Management, LLC | 2.678 | 0,00 | 5 | 33,33 | ||||
| 2025-05-15 | 13F | Polar Asset Management Partners Inc. | 0 | -100,00 | 0 | -100,00 | ||||
| 2025-08-12 | 13F | Catalyst Funds Management Pty Ltd | 1.877.700 | 3.417 | ||||||
| 2025-08-14 | 13F | UBS Group AG | 8.640.294 | 128,87 | 15.725 | 220,46 | ||||
| 2025-06-26 | NP | FTIHX - Fidelity Total International Index Fund This fund is a listed as child fund of Fmr Llc and if that institution has disclosed ownership in this security, then these positions will not be double counted when calculating total shares and total value | 401.579 | 2,44 | 577 | -19,67 | ||||
| 2025-08-14 | 13F | CoreCap Advisors, LLC | 12.438 | 0,00 | 23 | 37,50 | ||||
| 2025-08-14 | 13F | Cantor Fitzgerald, L. P. | 465.629 | 42,41 | 847 | 99,29 | ||||
| 2025-08-14 | 13F | Alyeska Investment Group, L.P. | 1.500.000 | 0,00 | 2.730 | 40,00 | ||||
| 2025-05-21 | 13F | Impala Asset Management LLC | 0 | -100,00 | 0 | |||||
| 2025-07-28 | 13F | Td Asset Management Inc | 8.987.804 | 4,08 | 16.401 | 45,40 | ||||
| 2025-08-27 | NP | URAN - Themes Uranium & Nuclear ETF | 178.001 | 50,54 | 325 | 111,04 | ||||
| 2025-08-14 | 13F | Banque Transatlantique SA | 0 | -100,00 | 0 | |||||
| 2025-08-12 | 13F | Rhumbline Advisers | 26 | 0,00 | 0 | |||||
| 2025-08-18 | 13F/A | National Bank Of Canada /fi/ | 1.045.463 | -2,07 | 1.906 | 37,22 | ||||
| 2025-04-15 | 13F | NewGen Asset Management Ltd | 0 | -100,00 | 0 | -100,00 | ||||
| 2025-08-14 | 13F | Jane Street Group, Llc | 1.695.910 | -64,85 | 3.103 | -50,78 | ||||
| 2025-07-31 | 13F | Cambridge Investment Research Advisors, Inc. | 303.142 | -24,50 | 1 | |||||
| 2025-08-14 | 13F | Jane Street Group, Llc | Put | 44.100 | 29,71 | 81 | 81,82 | |||
| 2025-07-31 | 13F | Ground Swell Capital, LLC | 0 | -100,00 | 0 | |||||
| 2025-08-08 | 13F | Larson Financial Group LLC | 12.849 | 0,00 | 23 | 43,75 | ||||
| 2025-08-14 | 13F | Jane Street Group, Llc | Call | 601.000 | 15,22 | 1.100 | 61,38 | |||
| 2025-08-13 | 13F | Natixis | 344.462 | 6,23 | 616 | 46,43 | ||||
| 2025-08-14 | 13F | Balyasny Asset Management Llc | 4.394.528 | 7.998 | ||||||
| 2025-07-01 | 13F | Confluence Investment Management Llc | 266.880 | -1,09 | 486 | 38,57 | ||||
| 2025-08-14 | 13F | Millennium Management Llc | 4.746.410 | -16,88 | 8.655 | 16,58 | ||||
| 2025-05-15 | 13F | Tudor Investment Corp Et Al | 0 | -100,00 | 0 | |||||
| 2025-08-14 | 13F | Intact Investment Management Inc. | 2.727.100 | 32,72 | 4.985 | 85,73 | ||||
| 2025-08-07 | 13F | PCJ Investment Counsel Ltd. | 2.049.490 | 32,02 | 3.750 | 84,86 | ||||
| 2025-07-15 | 13F | Compagnie Lombard Odier SCmA | 5.500 | 0,00 | 10 | 42,86 | ||||
| 2025-06-26 | NP | CCSO - Carbon Collective Climate Solutions U.S. Equity ETF | 31.769 | -25,85 | 45 | -42,86 | ||||
| 2025-08-14 | 13F | Prelude Capital Management, Llc | 0 | -100,00 | 0 | |||||
| 2025-08-08 | 13F | Emerald Investment Partners, Llc | 18.000 | 50,00 | 33 | 113,33 | ||||
| 2025-06-26 | NP | DFAI - Dimensional International Core Equity Market ETF | 60.776 | -69,86 | 87 | -69,37 | ||||
| 2025-08-11 | 13F | Fore Capital, LLC | 0 | -100,00 | 0 | -100,00 | ||||
| 2025-08-13 | 13F | Providence Capital Advisors, LLC | 23.371 | 0,00 | 43 | 40,00 | ||||
| 2025-08-14 | 13F | Scopus Asset Management, L.p. | 7.611.802 | -1,36 | 13.928 | 38,13 | ||||
| 2025-05-15 | 13F | Crestline Management, LP | 0 | -100,00 | 0 | |||||
| 2025-08-11 | 13F | Alps Advisors Inc | 60.006.874 | 3,83 | 109.213 | 45,37 | ||||
| 2025-08-14 | 13F | Bnp Paribas Arbitrage, Sa | 1.440.393 | 14.403.830,00 | 2.622 | |||||
| 2025-07-31 | 13F | Acuitas Investments, LLC | 0 | -100,00 | 0 | |||||
| 2025-08-05 | 13F | Strategic Financial Concepts, LLC | 71.772 | 0,00 | 131 | 0,00 | ||||
| 2025-09-04 | 13F/A | Advisor Group Holdings, Inc. | 54.647 | 24,17 | 99 | 73,68 | ||||
| 2025-08-19 | 13F | Hohimer Wealth Management, Llc | 22.900 | 42 | ||||||
| 2025-08-08 | 13F | Cetera Investment Advisers | 954.140 | 0,57 | 1.737 | 40,79 | ||||
| 2025-08-14 | 13F | Stifel Financial Corp | 294.656 | 10,95 | 536 | 55,36 | ||||
| 2025-07-16 | 13F | ORG Wealth Partners, LLC | 400 | 0,00 | 1 | |||||
| 2025-08-05 | 13F | Simplex Trading, Llc | Put | 214.300 | 37,28 | 0 | ||||
| 2025-08-05 | 13F | Simplex Trading, Llc | Call | 1.192.800 | -0,88 | 2 | 100,00 | |||
| 2025-07-22 | 13F | Hickory Asset Management, Inc. | 10.000 | 0,00 | 18 | 38,46 | ||||
| 2025-07-25 | NP | WSML - iShares MSCI World Small-Cap ETF | 51.597 | 81 | ||||||
| 2025-08-14 | 13F | Citadel Advisors Llc | 10.492.541 | 9,47 | 19.096 | 53,26 | ||||
| 2025-08-14 | 13F | Citadel Advisors Llc | Call | 175.200 | -32,85 | 319 | -6,19 | |||
| 2025-07-16 | 13F | Crown Wealth Group, LLC | 42.712 | 78 | ||||||
| 2025-08-21 | NP | NLR - VanEck Vectors Uranium+Nuclear Energy ETF | 42.716.837 | 82,76 | 77.745 | 155,87 | ||||
| 2025-08-14 | 13F | Financial Advisors Network, Inc. | 17.425 | 0,00 | 32 | 40,91 | ||||
| 2025-08-05 | 13F | Sigma Planning Corp | 0 | -100,00 | 0 | -100,00 | ||||
| 2025-08-25 | NP | Sprott Funds Trust - Sprott Uranium Miners Etf | 40.035.174 | -3,02 | 72.864 | 35,77 | ||||
| 2025-08-13 | 13F | Walleye Trading LLC | Call | 0 | -100,00 | 0 | ||||
| 2025-08-14 | 13F | Royal Bank Of Canada | 5.664.155 | 31,18 | 10.309 | 83,66 | ||||
| 2025-06-26 | NP | IXUS - iShares Core MSCI Total International Stock ETF | 1.612.115 | 0,83 | 2.315 | -20,88 | ||||
| 2025-04-28 | 13F | Financial Advocates Investment Management | 0 | -100,00 | 0 | |||||
| 2025-08-08 | 13F | Geode Capital Management, Llc | 490.480 | 5,57 | 901 | 47,06 | ||||
| 2025-08-01 | 13F | Advisory Alpha, LLC | 21.932 | 40 | ||||||
| 2025-07-31 | 13F | Buckingham Strategic Partners | 0 | -100,00 | 0 | |||||
| 2025-08-13 | 13F | Summit Financial, LLC | 2.379.247 | 0,00 | 4.330 | 39,99 | ||||
| 2025-08-14 | 13F | SummitTX Capital, L.P. | 2.074.658 | 141,24 | 3.776 | 237,66 | ||||
| 2025-08-29 | NP | JAJDX - International Small Company Trust NAV | 17.895 | 0,00 | 33 | 39,13 | ||||
| 2025-07-16 | 13F | Beaumont Financial Advisors, LLC | 10.700 | 0,00 | 19 | 46,15 | ||||
| 2025-08-14 | 13F | BRITISH COLUMBIA INVESTMENT MANAGEMENT Corp | 505.761 | 7,82 | 925 | 51,14 | ||||
| 2025-05-07 | 13F | Prescott Group Capital Management, L.l.c. | 0 | -100,00 | 0 | |||||
| 2025-08-12 | 13F | CIBC Private Wealth Group, LLC | 1.000 | 0,00 | 2 | 0,00 | ||||
| 2025-08-14 | 13F | CIBC World Markets Inc. | 247.675 | -39,00 | 453 | -14,53 | ||||
| 2025-05-15 | 13F | Manatuck Hill Partners, LLC | 0 | -100,00 | 0 | |||||
| 2025-07-11 | 13F | Afg Fiduciary Services Limited Partnership | 15.000 | 0,00 | 26 | 36,84 | ||||
| 2025-08-14 | 13F | Manufacturers Life Insurance Company, The | 4.559.953 | 0,00 | 8.284 | 39,09 | ||||
| 2025-08-13 | 13F | Quantbot Technologies LP | 0 | -100,00 | 0 | |||||
| 2025-08-05 | 13F | Bank of New York Mellon Corp | 19.362 | 0,01 | 35 | 40,00 | ||||
| 2025-08-13 | 13F | Mackenzie Financial Corp | 513.946 | 5,97 | 940 | 48,50 | ||||
| 2025-08-28 | NP | GWX - SPDR(R) S&P(R) International Small Cap ETF | 395.059 | -1,57 | 721 | 37,40 | ||||
| 2025-07-14 | 13F | Sowell Financial Services LLC | 20.272 | 0,00 | 37 | 38,46 | ||||
| 2025-08-14 | 13F | Gotham Asset Management, LLC | 63.437 | 481,94 | 115 | 721,43 | ||||
| 2025-08-01 | 13F | Envestnet Asset Management Inc | 55.962 | 29,37 | 102 | 80,36 | ||||
| 2025-07-11 | 13F | Farther Finance Advisors, LLC | 1.214 | 4,30 | 2 | 100,00 | ||||
| 2025-05-14 | 13F | Northwestern Mutual Wealth Management Co | 0 | -100,00 | 0 | |||||
| 2025-08-28 | NP | QCSTRX - Stock Account Class R1 | 709.085 | -9,83 | 1.297 | 26,19 | ||||
| 2025-07-09 | 13F | HFG Wealth Management, LLC | 25.000 | 32 | ||||||
| 2025-08-14 | 13F | Visionary Wealth Advisors | 17.500 | 0,00 | 32 | 40,91 | ||||
| 2025-08-14 | 13F | Moore Capital Management, Lp | 2.002.110 | 3.644 | ||||||
| 2025-03-31 | NP | PDAVX - PineBridge Dynamic Asset Allocation Fund Investor Servicing Shares | 38.096 | 0,00 | 69 | -13,75 | ||||
| 2025-07-23 | 13F | Heathbridge Capital Management Ltd. | 100.000 | 0,00 | 183 | 40,00 | ||||
| 2025-08-14 | 13F | Kerrisdale Advisers, LLC | 86.800 | 0,00 | 158 | 40,18 | ||||
| 2025-08-27 | NP | HRSMX - Hood River Small-Cap Growth Fund Institutional Shares | 17.021.024 | -2,13 | 30.978 | 37,02 | ||||
| 2025-06-26 | NP | DFA INVESTMENT TRUST CO - The Canadian Small Company Series This fund is a listed as child fund of Dimensional Fund Advisors Lp and if that institution has disclosed ownership in this security, then these positions will not be double counted when calculating total shares and total value | 1.481.731 | 3.528,85 | 2.128 | 2.775,68 | ||||
| 2025-07-24 | 13F | Vantage Point Financial LLC | 18.620 | 0,00 | 34 | 37,50 | ||||
| 2025-08-29 | NP | FTWO - Strive FAANG 2.0 ETF | 39.542 | 19,48 | 72 | 67,44 |