Statistiche di base
| Proprietari istituzionali | 128 total, 128 long only, 0 short only, 0 long/short - change of -2,29% MRQ |
| Allocazione media del portafoglio | 0.2973 % - change of 23,64% MRQ |
| Azioni istituzionali (Long) | 41.336.195 (ex 13D/G) - change of 12,81MM shares 44,92% MRQ |
| Valore istituzionale (Long) | $ 275.548 USD ($1000) |
Proprietà istituzionale e azionisti
Cornerstone Strategic Investment Fund, Inc. (US:CLM) ha 128 proprietari istituzionali e azionisti che hanno presentato i moduli 13D/G o 13F alla Securities Exchange Commission (SEC). Queste istituzioni detengono un totale di 41,336,195 azioni. I maggiori azionisti includono Alpine Global Management, LLC, Boothbay Fund Management, Llc, Sit Investment Associates Inc, Advisor Group Holdings, Inc., Sculptor Capital LP, Rivernorth Capital Management, Llc, LPL Financial LLC, Absolute Investment Advisers Llc, Yakira Capital Management, Inc., and Thomas J. Herzfeld Advisors, Inc. .
(Cornerstone Strategic Investment Fund, Inc. (NYSEAM:CLM) la struttura proprietaria istituzionale mostra le attuali posizioni nella società da parte di istituzioni e fondi, nonché le ultime variazioni nella dimensione della posizione. I principali azionisti possono essere singoli investitori, fondi comuni, hedge fund o istituzioni. L'allegato 13D indica che l'investitore detiene (o ha detenuto) più del 5% della società e intende (o intendeva) perseguire attivamente un cambiamento nella strategia aziendale. L'allegato 13G indica un investimento passivo superiore al 5%.
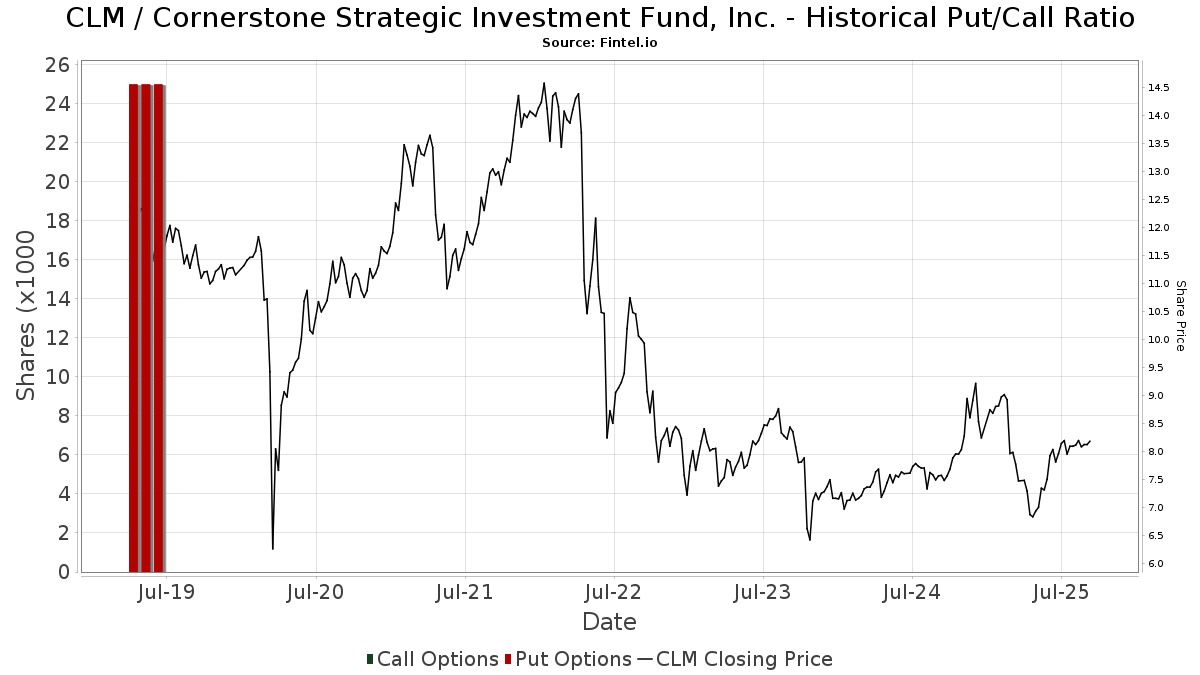
The share price as of September 5, 2025 is 8,21 / share. Previously, on September 9, 2024, the share price was 7,52 / share. This represents an increase of 9,18% over that period.

Indice del sentiment dei fondi
L'indice del sentiment dei fondi (anche noto come "indice di accumulo di proprietà") individua i titoli più acquistati dai fondi. È il risultato di un sofisticato modello quantitativo multi-fattore che identifica le società con i più alti livelli di accumulo istituzionale. Il modello utilizza una combinazione dell'aumento totale dei proprietari dichiarati, delle variazioni nelle allocazioni di portafoglio di tali proprietari e di altre metriche. Il punteggio varia da 0 a 100: i numeri più alti indicano un livello di accumulo superiore ad altre società, mentre 50 rappresenta la media.
Frequenza di aggiornamento: giornaliera
Consulta Ownership Explorer per visualizzare l'elenco delle aziende con il ranking più alto.
Rapporto put/call istituzionale
Oltre a segnalare le emissioni standard di titoli azionari e di debito, gli istituti con più di 100 milioni di asset in gestione devono anche dichiarare le loro partecipazioni in opzioni put e call. Poiché le opzioni put indicano generalmente un sentiment negativo e le opzioni call un sentiment positivo, possiamo avere un'idea del sentiment istituzionale complessivo attraverso il rapporto tra put e call. Il grafico a destra mostra il rapporto storico put/call per questo strumento.
L'utilizzo del rapporto put/call come indicatore del sentiment degli investitori consente di superare una delle principali lacune dell'utilizzo della proprietà istituzionale totale, ovvero il fatto che una quantità significativa di asset in gestione viene investita passivamente per seguire gli indici. Generalmente, i fondi a gestione passiva non acquistano opzioni, per cui il rapporto put/call riflette più fedelmente il sentiment dei fondi a gestione attiva.
Depositi 13F e NPORT
Le informazioni relative ai depositi 13F sono gratuite. Per accedere alle informazioni relative ai depositi NP è necessario un'abbonamento premium. Le righe verdi indicano le nuove posizioni. Le righe rosse indicano le posizioni chiuse. Fai clic sull'icona del link per visualizzare la cronologia completa delle transazioni.
Esegui l'upgrade
per sbloccare i dati premium ed esportarli in Excel ![]() .
.
| Data di deposito | Fonte | Investitore | Tipo | Prezzo medio (Stima) |
Azioni | Δ Azioni (%) |
Valore dichiarato ($ 1000) |
Δ Valore (%) |
Allocazione del portafoglio (%) |
|
|---|---|---|---|---|---|---|---|---|---|---|
| 2025-08-14 | 13F | Garden State Investment Advisory Services LLC | 61.706 | 21,56 | 501 | 32,89 | ||||
| 2025-08-14 | 13F | Sunbelt Securities, Inc. | 1.181 | -4,83 | 10 | 11,11 | ||||
| 2025-08-14 | 13F/A | Rockefeller Capital Management L.P. | 25.702 | -5,17 | 209 | 3,48 | ||||
| 2025-08-14 | 13F | Boothbay Fund Management, Llc | 6.135.929 | 3,99 | 49.824 | 13,64 | ||||
| 2025-07-21 | 13F | Clarity Capital Partners LLC | 14.089 | -78,71 | 114 | -76,78 | ||||
| 2025-07-08 | 13F | Nbc Securities, Inc. | 18.455 | 0,00 | 0 | |||||
| 2025-08-14 | 13F | Ursa Fund Management, LLC | 275.000 | 1.000,00 | 2.233 | 1.107,03 | ||||
| 2025-08-12 | 13F | RPG Investment Advisory, LLC | 0 | -100,00 | 0 | |||||
| 2025-05-15 | 13F | Tower Research Capital LLC (TRC) | 0 | -100,00 | 0 | |||||
| 2025-08-14 | 13F | Banque Transatlantique SA | 0 | -100,00 | 0 | |||||
| 2025-07-10 | 13F | Marshall Financial Group LLC | 10.000 | 0,00 | 82 | 9,46 | ||||
| 2025-08-14 | 13F | UBS Group AG | 23.194 | -56,53 | 188 | -52,53 | ||||
| 2025-08-26 | 13F/A | Thrivent Financial For Lutherans | 145.939 | 45,28 | 1 | |||||
| 2025-07-01 | 13F | Harbor Investment Advisory, Llc | 11.204 | 0,00 | 91 | 8,43 | ||||
| 2025-08-19 | 13F | Newbridge Financial Services Group, Inc. | 10.000 | 81 | ||||||
| 2025-07-25 | 13F | Sequoia Financial Advisors, LLC | 21.400 | -2,73 | 174 | 6,13 | ||||
| 2025-08-12 | 13F | Global Retirement Partners, LLC | 0 | -100,00 | 0 | |||||
| 2025-08-29 | 13F | Evolution Wealth Management Inc. | 19.425 | 158 | ||||||
| 2025-07-14 | 13F | Buska Wealth Management, LLC | 18.017 | 9,07 | 146 | 19,67 | ||||
| 2025-07-29 | 13F | Stratos Wealth Partners, LTD. | 548.477 | 49,72 | 4.454 | 63,65 | ||||
| 2025-08-04 | 13F | Assetmark, Inc | 1.971 | -68,38 | 16 | -65,22 | ||||
| 2025-08-11 | 13F | Anfield Capital Management, LLC | 6.528 | 0,00 | 53 | 10,42 | ||||
| 2025-07-08 | 13F/A | Salem Investment Counselors Inc | 700 | 0,00 | 6 | 0,00 | ||||
| 2025-05-12 | 13F | Independent Advisor Alliance | 0 | -100,00 | 0 | |||||
| 2025-08-14 | 13F | Benjamin Edwards Inc | 109.511 | -10,65 | 889 | -2,31 | ||||
| 2025-08-13 | 13F | Yakira Capital Management, Inc. | 1.197.769 | 80,72 | 9.726 | 97,50 | ||||
| 2025-08-14 | 13F | Ameriprise Financial Inc | 15.916 | 0,00 | 129 | 9,32 | ||||
| 2025-08-01 | 13F | Envestnet Asset Management Inc | 45.212 | -12,29 | 367 | -4,18 | ||||
| 2025-08-05 | 13F | GPS Wealth Strategies Group, LLC | 8.010 | 17,62 | 65 | 30,00 | ||||
| 2025-08-14 | 13F | Alpine Global Management, LLC | 6.612.795 | 5,36 | 53.696 | 15,15 | ||||
| 2025-08-14 | 13F | Cohen & Steers, Inc. | 734.931 | 21,04 | 6 | 25,00 | ||||
| 2025-07-10 | 13F | HF Advisory Group, LLC | 21.939 | 3,96 | 178 | 14,10 | ||||
| 2025-08-11 | 13F | Perennial Investment Advisors, LLC | 451.228 | 3,27 | 3.664 | 12,85 | ||||
| 2025-08-06 | 13F | Vantage Financial Partners, LLC | 21.437 | -14,28 | 174 | -5,95 | ||||
| 2025-08-15 | 13F | Morgan Stanley | 508.044 | 12,11 | 4.125 | 22,51 | ||||
| 2025-07-11 | 13F | Seacrest Wealth Management, Llc | 23.938 | 26,61 | 194 | 38,57 | ||||
| 2025-07-10 | 13F | Redhawk Wealth Advisors, Inc. | 23.678 | 4,94 | 192 | 14,97 | ||||
| 2025-08-13 | 13F | Northwestern Mutual Wealth Management Co | 9.755 | -30,90 | 79 | -24,04 | ||||
| 2025-08-05 | 13F | Dunhill Financial, LLC | 856 | 7 | ||||||
| 2025-07-21 | 13F | Ameritas Advisory Services, LLC | 1.191 | 10 | ||||||
| 2025-07-22 | 13F | Firethorn Wealth Partners, Llc | 17.146 | 4,94 | 139 | 14,88 | ||||
| 2025-08-11 | 13F | United Capital Financial Advisers, Llc | 0 | -100,00 | 0 | |||||
| 2025-08-12 | 13F | Park Square Financial Group, LLC | 5.695 | 0,00 | 46 | 9,52 | ||||
| 2025-07-14 | 13F | Capital CS Group, LLC | 22.568 | 28,56 | 183 | 40,77 | ||||
| 2025-08-14 | 13F | Millennium Management Llc | 26.574 | 216 | ||||||
| 2025-08-27 | NP | ACEFX - Absolute Strategies Fund Institutional Shares | 41.440 | 336 | ||||||
| 2025-08-11 | 13F | HighTower Advisors, LLC | 59.496 | -43,94 | 483 | -38,71 | ||||
| 2025-08-14 | 13F | Fmr Llc | 39.673 | 90.065,91 | 322 | |||||
| 2025-08-07 | 13F | Allworth Financial LP | 14.463 | 2.228,99 | 117 | 2.825,00 | ||||
| 2025-07-15 | 13F | Absolute Investment Advisers Llc | 1.229.119 | 9.980 | ||||||
| 2025-08-11 | 13F | Mosaic Family Wealth Partners, Llc | 11.448 | 7,85 | 93 | 17,95 | ||||
| 2025-03-12 | 13F | Centaurus Financial, Inc. | 0 | -100,00 | 0 | -100,00 | ||||
| 2025-09-04 | 13F/A | Advisor Group Holdings, Inc. | 3.493.550 | 29,30 | 28.367 | 41,31 | ||||
| 2025-08-28 | NP | Rivernorth Opportunities Fund, Inc. | 287.123 | 70,61 | 2.331 | 94,41 | ||||
| 2025-08-01 | 13F | First Command Advisory Services, Inc. | 0 | 0 | ||||||
| 2025-08-15 | 13F/A | Cable Car Capital LLC | 661.825 | -0,11 | 5.374 | 9,18 | ||||
| 2025-07-21 | 13F | Ameriflex Group, Inc. | 0 | -100,00 | 0 | |||||
| 2025-07-31 | 13F | BIP Wealth, LLC | 0 | -100,00 | 0 | |||||
| 2025-07-17 | 13F | Sound Income Strategies, LLC | 4.864 | 0,00 | 39 | 8,33 | ||||
| 2025-08-14 | 13F | Raymond James Financial Inc | 351.430 | 13,12 | 2.854 | 23,61 | ||||
| 2025-07-31 | 13F | Cambridge Investment Research Advisors, Inc. | 498.849 | -4,43 | 4 | 33,33 | ||||
| 2025-08-14 | 13F | Rivernorth Capital Management, Llc | 1.803.392 | 14.644 | ||||||
| 2025-08-27 | NP | AAHYX - Thrivent Diversified Income Plus Fund Class A | 21.815 | 41,12 | 177 | 55,26 | ||||
| 2025-04-10 | 13F | Charles Schwab Trust Co | 0 | -100,00 | 0 | |||||
| 2025-08-27 | NP | THRIVENT SERIES FUND INC - Thrivent Balanced Income Plus Portfolio Class A | 5.094 | 33,35 | 41 | 46,43 | ||||
| 2025-08-07 | 13F | Resources Investment Advisors, LLC. | 10.260 | 83 | ||||||
| 2025-05-02 | 13F | Dakota Wealth Management | 0 | -100,00 | 0 | |||||
| 2025-08-12 | 13F | Proequities, Inc. | 0 | 0 | ||||||
| 2025-07-30 | 13F | BlueChip Wealth Advisors LLC | 13.497 | 3,12 | 110 | 12,37 | ||||
| 2025-08-06 | 13F | Tabor Asset Management, LP | 0 | -100,00 | 0 | -100,00 | ||||
| 2025-07-09 | 13F | Dynamic Advisor Solutions LLC | 41.545 | 5,33 | 337 | 15,02 | ||||
| 2025-08-08 | 13F | Cetera Investment Advisers | 610.585 | 20,88 | 4.958 | 32,08 | ||||
| 2025-05-13 | 13F | Soltis Investment Advisors LLC | 0 | -100,00 | 0 | |||||
| 2025-08-06 | 13F | Commonwealth Equity Services, Llc | 251.740 | 0,51 | 2 | 100,00 | ||||
| 2025-07-29 | 13F | Chicago Partners Investment Group LLC | 26.351 | -15,44 | 213 | -2,29 | ||||
| 2025-08-13 | 13F | Baird Financial Group, Inc. | 91.397 | -1,35 | 742 | 7,85 | ||||
| 2025-08-14 | 13F | Toronto Dominion Bank | 50.000 | 406 | ||||||
| 2025-08-08 | 13F | Avantax Advisory Services, Inc. | 83.899 | 681 | ||||||
| 2025-05-16 | 13F | Jones Financial Companies Lllp | 0 | -100,00 | 0 | |||||
| 2025-08-12 | 13F | BlackRock, Inc. | 83.144 | 79,03 | 675 | 95,65 | ||||
| 2025-07-18 | 13F | PFG Investments, LLC | 37.318 | -26,30 | 303 | -19,41 | ||||
| 2025-08-14 | 13F | Ieq Capital, Llc | 0 | -100,00 | 0 | |||||
| 2025-08-14 | 13F | Stifel Financial Corp | 47.215 | 12,64 | 383 | 23,15 | ||||
| 2025-05-16 | 13F | Coppell Advisory Solutions LLC | 0 | -100,00 | 0 | |||||
| 2025-07-23 | 13F | Valmark Advisers, Inc. | 10.000 | 0,00 | 81 | 9,46 | ||||
| 2025-07-22 | 13F | DAVENPORT & Co LLC | 12.773 | 0,00 | 104 | 9,57 | ||||
| 2025-08-06 | 13F | Wedbush Securities Inc | 13.850 | -30,49 | 0 | |||||
| 2025-08-14 | 13F | GWM Advisors LLC | 29.865 | 29,85 | 243 | 42,35 | ||||
| 2025-07-11 | 13F | Farther Finance Advisors, LLC | 4.804 | 55,52 | 39 | 77,27 | ||||
| 2025-07-17 | 13F | Janney Montgomery Scott LLC | 0 | -100,00 | 0 | |||||
| 2025-08-08 | 13F | Larson Financial Group LLC | 10.122 | 52,42 | 82 | 67,35 | ||||
| 2025-08-14 | 13F | Citadel Advisors Llc | 37.929 | -23,98 | 308 | -17,03 | ||||
| 2025-08-14 | 13F | Sit Investment Associates Inc | 5.730.776 | 16.273,65 | 47 | |||||
| 2025-07-25 | 13F | We Are One Seven, LLC | 35.300 | 42,82 | 287 | 56,28 | ||||
| 2025-08-28 | NP | Cohen & Steers Closed-end Opportunity Fund, Inc. | 734.931 | 21,04 | 5.968 | 32,28 | ||||
| 2025-08-12 | 13F | Pathstone Holdings, LLC | 21.012 | 0,00 | 171 | 8,97 | ||||
| 2025-08-06 | 13F | AE Wealth Management LLC | 50.164 | 407 | ||||||
| 2025-08-13 | 13F | StoneX Group Inc. | 133.949 | 45,52 | 1.088 | 59,15 | ||||
| 2025-07-25 | 13F | Atria Wealth Solutions, Inc. | 32.531 | -84,04 | 268 | -82,33 | ||||
| 2025-08-11 | 13F | Principal Securities, Inc. | 700 | 0,00 | 6 | -16,67 | ||||
| 2025-08-14 | 13F | CoreCap Advisors, LLC | 51.956 | 23,66 | 422 | 34,94 | ||||
| 2025-05-02 | 13F | Signaturefd, Llc | 0 | -100,00 | 0 | |||||
| 2025-04-22 | 13F | TrueMark Investments, LLC | 0 | -100,00 | 0 | |||||
| 2025-08-14 | 13F | Royal Bank Of Canada | 2.594 | 130,37 | 21 | 162,50 | ||||
| 2025-05-13 | 13F | Bokf, Na | 0 | -100,00 | 0 | |||||
| 2025-05-14 | 13F | Karpus Management, Inc. | 0 | -100,00 | 0 | |||||
| 2025-08-14 | 13F | Jane Street Group, Llc | 65.005 | 82,02 | 528 | 98,87 | ||||
| 2025-08-07 | 13F | Kestra Private Wealth Services, Llc | 24.297 | 19,81 | 197 | 31,33 | ||||
| 2025-06-26 | NP | AABFX - Thrivent Balanced Income Plus Fund Class A | 4.131 | 0,00 | 29 | -22,22 | ||||
| 2025-08-12 | 13F | AlphaCore Capital LLC | 0 | -100,00 | 0 | |||||
| 2025-06-26 | NP | AAINX - Thrivent Opportunity Income Plus Fund Class A | 33.107 | 0,00 | 229 | -22,37 | ||||
| 2025-07-17 | 13F | Sonora Investment Management Group, LLC | 10.135 | 0,00 | 82 | 9,33 | ||||
| 2025-08-08 | 13F | Kingsview Wealth Management, LLC | 10.000 | 0,00 | 81 | 9,46 | ||||
| 2025-08-13 | 13F | Townsquare Capital Llc | 0 | -100,00 | 0 | |||||
| 2025-08-11 | 13F | Aptus Capital Advisors, LLC | 217.910 | 1,33 | 1.769 | 10,77 | ||||
| 2025-05-07 | 13F | Sheaff Brock Investment Advisors, LLC | 13.830 | 0,00 | 103 | -13,56 | ||||
| 2025-05-15 | 13F | Mercer Global Advisors Inc /adv | 0 | -100,00 | 0 | |||||
| 2025-08-12 | 13F | Jpmorgan Chase & Co | 0 | -100,00 | 0 | |||||
| 2025-07-23 | 13F | Godsey & Gibb Associates | 1.000 | 0,00 | 8 | 14,29 | ||||
| 2025-05-13 | 13F | SHEPHERD WEALTH MANAGEMENT Ltd LIABILITY Co | 0 | -100,00 | 0 | |||||
| 2025-08-11 | 13F | Private Advisor Group, LLC | 51.681 | 1,27 | 420 | 10,55 | ||||
| 2025-08-04 | 13F | Creative Financial Designs Inc /adv | 81.742 | 15,17 | 664 | 25,81 | ||||
| 2025-07-11 | 13F | Adirondack Trust Co | 0 | -100,00 | 0 | |||||
| 2025-08-14 | 13F | Wells Fargo & Company/mn | 3 | -25,00 | 0 | |||||
| 2025-08-05 | 13F | Strategic Financial Concepts, LLC | 64.700 | -10,26 | 525 | -1,87 | ||||
| 2025-08-15 | 13F | Kestra Advisory Services, LLC | 34.447 | 119,88 | 280 | 140,52 | ||||
| 2025-05-12 | 13F | Evernest Financial Advisors, LLC | 0 | -100,00 | 0 | -100,00 | ||||
| 2025-07-24 | 13F | Us Bancorp \de\ | 256.505 | 0,00 | 2.083 | 9,29 | ||||
| 2025-08-12 | 13F | MAI Capital Management | 19.865 | 6,75 | 161 | 16,67 | ||||
| 2025-08-08 | 13F | Avalon Trust Co | 1.000 | -50,00 | 8 | -42,86 | ||||
| 2025-08-14 | 13F | Goldman Sachs Group Inc | 20.000 | 162 | ||||||
| 2025-08-01 | 13F | Pasadena Private Wealth, LLC | 13.945 | 20,18 | 113 | 31,40 | ||||
| 2025-08-11 | 13F | TD Waterhouse Canada Inc. | 0 | -100,00 | 0 | |||||
| 2025-08-14 | 13F | Sculptor Capital LP | 2.666.574 | 21.653 | ||||||
| 2025-07-28 | 13F | Harbour Investments, Inc. | 38 | 0,00 | 0 | |||||
| 2025-07-31 | 13F | Oppenheimer & Co Inc | 15.966 | -0,03 | 130 | 9,32 | ||||
| 2025-08-14 | 13F | Susquehanna International Group, Llp | 28.161 | -72,03 | 229 | -69,52 | ||||
| 2025-05-08 | 13F | Armis Advisers, LLC | 0 | -100,00 | 0 | |||||
| 2025-07-10 | 13F | Wealth Enhancement Advisory Services, Llc | 31.100 | 73,68 | 256 | 92,48 | ||||
| 2025-05-15 | 13F | Hrt Financial Lp | 0 | -100,00 | 0 | |||||
| 2025-08-12 | 13F | Steward Partners Investment Advisory, Llc | 1 | -99,99 | 0 | -100,00 | ||||
| 2025-08-08 | 13F | Capital Investment Advisory Services, LLC | 12.137 | 99 | ||||||
| 2025-08-12 | 13F | Virtu Financial LLC | 0 | -100,00 | 0 | |||||
| 2025-08-08 | 13F | Pnc Financial Services Group, Inc. | 1.200 | 0,00 | 10 | 12,50 | ||||
| 2025-08-12 | 13F | J.w. Cole Advisors, Inc. | 205.931 | 24,12 | 1.672 | 35,71 | ||||
| 2025-08-05 | 13F | Tsfg, Llc | 2.351 | 13.729,41 | 0 | |||||
| 2025-08-08 | 13F | Creative Planning | 120.974 | 26,88 | 982 | 38,70 | ||||
| 2025-08-08 | 13F | Meridian Wealth Management, LLC | 19.126 | 91,26 | 155 | 109,46 | ||||
| 2025-08-12 | 13F | Change Path, LLC | 39.112 | 318 | ||||||
| 2025-08-13 | 13F | Rsm Us Wealth Management Llc | 14.969 | 122 | ||||||
| 2025-08-14 | 13F | Bank Of America Corp /de/ | 3.904 | -99,79 | 32 | -99,78 | ||||
| 2025-08-13 | 13F | Summit Financial, LLC | 21.627 | 176 | ||||||
| 2025-07-24 | 13F | IFP Advisors, Inc | 0 | -100,00 | 0 | |||||
| 2025-08-14 | 13F | Quarry LP | 506.996 | 4.118,64 | 4.117 | 4.524,72 | ||||
| 2025-08-12 | 13F | LPL Financial LLC | 1.362.299 | 22,37 | 11.062 | 33,73 | ||||
| 2025-07-25 | 13F | Cwm, Llc | 31 | 0,00 | 0 | |||||
| 2025-08-07 | 13F | Encompass More Asset Management | 80.317 | 4,89 | 652 | 14,79 | ||||
| 2025-08-01 | 13F | Winebrenner Capital Management Llc | 108.426 | 0,00 | 880 | 9,32 | ||||
| 2025-08-13 | 13F | Thomas J. Herzfeld Advisors, Inc. | 1.074.966 | 1.109,29 | 8.729 | 1.222,42 | ||||
| 2025-08-04 | 13F | Integrity Alliance, Llc. | 0 | -100,00 | 0 | |||||
| 2025-08-06 | 13F | Prospera Financial Services Inc | 70.726 | 11,27 | 574 | 21,61 | ||||
| 2025-08-14 | 13F | Almitas Capital LLC | 0 | -100,00 | 0 | |||||
| 2025-08-27 | NP | THRIVENT SERIES FUND INC - Thrivent Diversified Income Plus Portfolio Class A | 12.946 | 33,34 | 105 | 45,83 | ||||
| 2025-05-12 | 13F | Kane Investment Management, Inc. | 0 | -100,00 | 0 | |||||
| 2025-08-14 | 13F | Integrated Wealth Concepts LLC | 12.210 | -1,47 | 99 | 7,61 | ||||
| 2025-07-22 | 13F | Grimes & Company, Inc. | 0 | -100,00 | 0 | |||||
| 2025-08-27 | NP | THRIVENT SERIES FUND INC - Thrivent Opportunity Income Plus Portfolio Class A | 9.906 | 33,34 | 80 | 45,45 |