Statistiche di base
| Proprietari istituzionali | 186 total, 181 long only, 1 short only, 4 long/short - change of -0,53% MRQ |
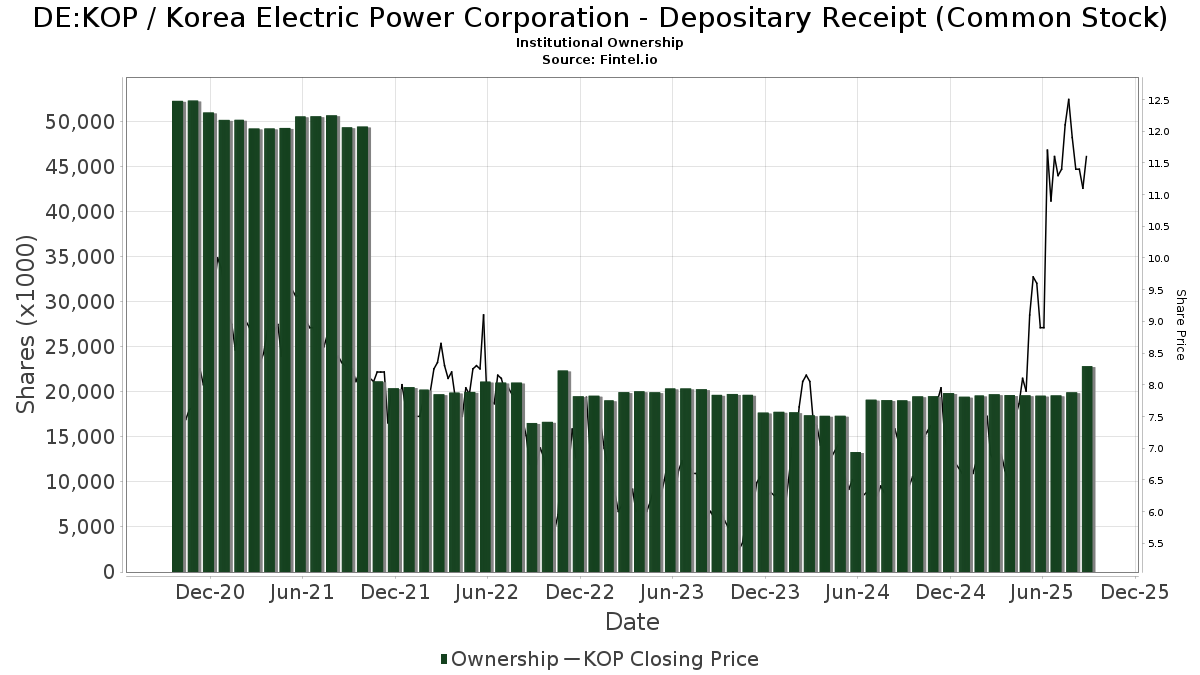
| Prezzo dell'azione | 13,90 |
| Allocazione media del portafoglio | 0.0196 % - change of -72,71% MRQ |
| Azioni istituzionali (Long) | 23.330.629 (ex 13D/G) - change of -0,74MM shares -3,08% MRQ |
| Valore istituzionale (Long) | $ 380.357 USD ($1000) |
Proprietà istituzionale e azionisti
Korea Electric Power Corporation - Depositary Receipt (Common Stock) (DE:KOP) ha 186 proprietari istituzionali e azionisti che hanno presentato i moduli 13D/G o 13F alla Securities Exchange Commission (SEC). Queste istituzioni detengono un totale di 23,330,629 azioni. I maggiori azionisti includono Morgan Stanley, BlackRock, Inc., Arrowstreet Capital, Limited Partnership, Vanguard Group Inc, VGTSX - Vanguard Total International Stock Index Fund Investor Shares, State Street Corp, Goldman Sachs Group Inc, Dimensional Fund Advisors Lp, American Century Companies Inc, and Capital Wealth Planning, LLC .
(Korea Electric Power Corporation - Depositary Receipt (Common Stock) (DB:KOP) la struttura proprietaria istituzionale mostra le attuali posizioni nella società da parte di istituzioni e fondi, nonché le ultime variazioni nella dimensione della posizione. I principali azionisti possono essere singoli investitori, fondi comuni, hedge fund o istituzioni. L'allegato 13D indica che l'investitore detiene (o ha detenuto) più del 5% della società e intende (o intendeva) perseguire attivamente un cambiamento nella strategia aziendale. L'allegato 13G indica un investimento passivo superiore al 5%.
The share price as of March 6, 2026 is 13,90 / share. Previously, on March 10, 2025, the share price was 6,90 / share. This represents an increase of 101,45% over that period.
Indice del sentiment dei fondi
L'indice del sentiment dei fondi (anche noto come "indice di accumulo di proprietà") individua i titoli più acquistati dai fondi. È il risultato di un sofisticato modello quantitativo multi-fattore che identifica le società con i più alti livelli di accumulo istituzionale. Il modello utilizza una combinazione dell'aumento totale dei proprietari dichiarati, delle variazioni nelle allocazioni di portafoglio di tali proprietari e di altre metriche. Il punteggio varia da 0 a 100: i numeri più alti indicano un livello di accumulo superiore ad altre società, mentre 50 rappresenta la media.
Frequenza di aggiornamento: giornaliera
Consulta Ownership Explorer per visualizzare l'elenco delle aziende con il ranking più alto.
AI+ Ask Fintel’s AI assistant about Korea Electric Power Corporation - Depositary Receipt (Common Stock).
Select a question to share a public post with an AI-crafted answer.
Thinking of good questions…
Depositi 13F e NPORT
Le informazioni relative ai depositi 13F sono gratuite. Per accedere alle informazioni relative ai depositi NP è necessario un'abbonamento premium. Le righe verdi indicano le nuove posizioni. Le righe rosse indicano le posizioni chiuse. Fai clic sull'icona del link per visualizzare la cronologia completa delle transazioni.
Esegui l'upgrade
per sbloccare i dati premium ed esportarli in Excel ![]() .
.
| Data di deposito | Fonte | Investitore | Tipo | Prezzo medio (Stima) |
Azioni | Δ Azioni (%) |
Valore dichiarato ($ 1000) |
Δ Valore (%) |
Allocazione del portafoglio (%) |
|
|---|---|---|---|---|---|---|---|---|---|---|
| 2026-02-11 | 13F | Group One Trading, L.p. | Put | 3.000 | 66,67 | 50 | 113,04 | |||
| 2026-02-17 | 13F | Aquatic Capital Management LLC | 42.648 | -26,61 | 704 | -7,26 | ||||
| 2025-11-14 | 13F | Jane Street Group, Llc | 0 | -100,00 | 0 | -100,00 | ||||
| 2026-02-13 | 13F | Causeway Capital Management Llc | 11.202 | -12,15 | 185 | 10,84 | ||||
| 2026-02-11 | 13F | Group One Trading, L.p. | Call | 3.300 | -19,51 | 54 | 1,89 | |||
| 2026-02-13 | 13F | Kopernik Global Investors, LLC | 268.151 | 0,00 | 4.424 | 26,44 | ||||
| 2025-09-24 | NP | DAINX - Dunham International Stock Fund Class A | 11.855 | 163 | ||||||
| 2026-02-17 | 13F | Summit Global Investments | 39.976 | 183,04 | 1 | |||||
| 2026-02-09 | 13F | Key FInancial Inc | 580 | 0,00 | 10 | 28,57 | ||||
| 2026-02-04 | 13F | Argos Wealth Advisors, LLC | 12.474 | 206 | ||||||
| 2026-01-05 | 13F | GAMMA Investing LLC | 16.443 | 3,45 | 271 | 30,92 | ||||
| 2026-02-10 | 13F | AdvisorShares Investments LLC | 80.143 | 2,83 | 1.322 | 29,99 | ||||
| 2026-02-11 | 13F | LPL Financial LLC | 151.701 | 11,10 | 2.503 | 40,54 | ||||
| 2026-02-14 | 13F | Rockefeller Capital Management L.P. | 2.264 | 47,01 | 37 | 85,00 | ||||
| 2026-02-03 | 13F | SBI Securities Co., Ltd. | 4 | 0,00 | 0 | |||||
| 2026-02-05 | 13F | Td Private Client Wealth Llc | 2.178 | -14,25 | 36 | 6,06 | ||||
| 2026-01-21 | 13F | Yousif Capital Management, Llc | 23.954 | 0,00 | 514 | 64,42 | ||||
| 2026-02-12 | 13F | BlackRock, Inc. | 1.671.215 | 5,04 | 27.575 | 32,81 | ||||
| 2025-11-14 | 13F | Wetherby Asset Management Inc | 30.608 | -0,09 | 399 | -8,49 | ||||
| 2026-02-11 | 13F | Janney Montgomery Scott LLC | 62.733 | 9,27 | 1 | |||||
| 2026-02-24 | 13F | Bell Investment Advisors, Inc | 796 | 222,27 | 13 | 333,33 | ||||
| 2025-11-12 | 13F | Sterling Capital Management LLC | 0 | -100,00 | 0 | |||||
| 2026-01-14 | 13F | ORG Wealth Partners, LLC | 361 | 4,94 | 6 | 25,00 | ||||
| 2026-02-17 | 13F | Voleon Capital Management Lp | 40.645 | 5,96 | 671 | 34,00 | ||||
| 2026-02-17 | 13F | SageView Advisory Group, LLC | 226 | 4 | ||||||
| 2026-01-23 | 13F | Assetmark, Inc | 293.704 | -16,49 | 4.846 | 5,60 | ||||
| 2025-09-25 | NP | DFAE - Dimensional Emerging Core Equity Market ETF | 109.570 | 11,07 | 1.505 | 67,97 | ||||
| 2026-02-13 | 13F | MAI Capital Management | 251 | 4 | ||||||
| 2026-02-13 | 13F | Wells Fargo & Company/mn | 3.585 | 155,34 | 59 | 227,78 | ||||
| 2025-11-14 | 13F | Binnacle Investments Inc | 0 | -100,00 | 0 | |||||
| 2026-01-21 | 13F | Steadtrust LLC | 11.500 | 190 | ||||||
| 2026-02-12 | 13F | Rossby Financial, LCC | 99 | 2 | ||||||
| 2026-02-17 | 13F | Two Sigma Advisers, Lp | 21.932 | 362 | ||||||
| 2026-02-17 | 13F | Russell Investments Group, Ltd. | 196.826 | 2,95 | 3.248 | 30,19 | ||||
| 2026-02-18 | 13F | Vident Advisory, LLC | 175.891 | -10,56 | 2.902 | 13,09 | ||||
| 2025-11-06 | 13F | Whipplewood Advisors, LLC | 0 | -100,00 | 0 | -100,00 | ||||
| 2025-11-06 | 13F | Oppenheimer Asset Management Inc. | 0 | -100,00 | 0 | -100,00 | ||||
| 2026-02-13 | 13F | Pathstone Holdings, LLC | 33.081 | 2,21 | 546 | 29,15 | ||||
| 2026-02-03 | 13F | Diversify Wealth Management, Llc | 101.543 | 8,80 | 1.943 | 30,42 | ||||
| 2026-02-11 | 13F | Jpmorgan Chase & Co | 309.222 | -17,64 | 5.102 | 4,14 | ||||
| 2026-01-30 | 13F | Us Bancorp \de\ | 9.244 | -0,47 | 153 | 25,62 | ||||
| 2026-02-13 | 13F | Arrowstreet Capital, Limited Partnership | 1.382.963 | -8,67 | 22.819 | 15,48 | ||||
| 2026-02-13 | 13F | Manufacturers Life Insurance Company, The | 0 | -100,00 | 0 | |||||
| 2026-01-15 | 13F | Highline Wealth Partners Llc | 27 | 0 | ||||||
| 2026-01-26 | 13F | Private Trust Co Na | 280 | -19,77 | 5 | 0,00 | ||||
| 2025-11-14 | 13F | Cubist Systematic Strategies, LLC | 235.219 | 3.070 | ||||||
| 2026-01-23 | 13F | Diversify Advisory Services, LLC | 35.869 | 9,58 | 672 | 28,74 | ||||
| 2025-11-14 | 13F | Raymond James Financial Inc | 0 | -100,00 | 0 | |||||
| 2026-02-12 | 13F | Brinker Capital Investments, LLC | 14.736 | -69,10 | 243 | -60,93 | ||||
| 2026-01-14 | 13F | Generali Investments CEE, investicni spolecnost, a.s. | 34.200 | -29,05 | 564 | -10,33 | ||||
| 2026-02-17 | 13F | Brevan Howard Capital Management LP | 0 | -100,00 | 0 | |||||
| 2025-11-06 | 13F | Wealthstream Advisors, Inc. | 12.594 | 6,13 | 164 | -2,38 | ||||
| 2026-02-17 | 13F | Millennium Management Llc | 79.084 | -2,74 | 1.305 | 22,90 | ||||
| 2025-11-12 | 13F | Seeds Investor Llc | 0 | -100,00 | 0 | |||||
| 2026-02-13 | 13F | Citigroup Inc | 157.887 | 132,91 | 2.605 | 194,68 | ||||
| 2026-02-17 | 13F | Ameriprise Financial Inc | 23.198 | 53,11 | 383 | 93,91 | ||||
| 2026-02-13 | 13F | Toroso Investments, LLC | 49.510 | 20,08 | 817 | 51,67 | ||||
| 2026-01-23 | 13F | Farther Finance Advisors, LLC | 1.911 | 19,59 | 32 | 55,00 | ||||
| 2026-02-10 | 13F | Greenspring Advisors, LLC | 13.597 | 224 | ||||||
| 2026-02-17 | 13F | Advisor Group Holdings, Inc. | 1.767 | -88,06 | 29 | -84,97 | ||||
| 2026-02-17 | 13F | Wiley Bros.-aintree Capital, Llc | 11.011 | 0,40 | 182 | 26,57 | ||||
| 2026-02-12 | 13F | Jane Street Group, Llc | Put | 17.200 | 284 | |||||
| 2026-02-10 | 13F | Connor, Clark & Lunn Investment Management Ltd. | 232.188 | -34,71 | 3.831 | -17,44 | ||||
| 2026-02-17 | 13F | Trexquant Investment LP | 44.849 | 169,61 | 740 | 241,01 | ||||
| 2026-02-13 | 13F | Integrated Wealth Concepts LLC | 0 | -100,00 | 0 | |||||
| 2026-02-10 | 13F/A | Northwestern Mutual Wealth Management Co | 2.497 | 7,49 | 41 | 36,67 | ||||
| 2025-11-10 | 13F | Kovitz Investment Group Partners, LLC | 0 | -100,00 | 0 | |||||
| 2025-09-25 | NP | DFA INVESTMENT DIMENSIONS GROUP INC - World ex U.S. Core Equity Portfolio Institutional Class Shares | 1.200 | 0,00 | 16 | 60,00 | ||||
| 2026-01-27 | 13F | WealthCollab, LLC | 274 | 459,18 | 5 | |||||
| 2025-09-26 | NP | RAZAX - Multi-Asset Growth Strategy Fund Class A | 6.020 | -46,57 | 83 | -19,61 | ||||
| 2026-02-05 | 13F | Atria Investments Llc | 28.018 | -0,04 | 462 | 26,58 | ||||
| 2026-02-13 | 13F | Peak6 Llc | Call | 0 | -100,00 | 0 | -100,00 | |||
| 2025-10-22 | 13F | Geneos Wealth Management Inc. | 0 | -100,00 | 0 | -100,00 | ||||
| 2026-02-11 | 13F | Cerity Partners LLC | 81.849 | -21,74 | 1.351 | -1,03 | ||||
| 2025-09-25 | NP | DFCEX - Emerging Markets Core Equity Portfolio - Institutional Class This fund is a listed as child fund of Dimensional Fund Advisors Lp and if that institution has disclosed ownership in this security, then these positions will not be double counted when calculating total shares and total value | 326.264 | 0,00 | 4.483 | 51,16 | ||||
| 2026-02-05 | 13F | Elyxium Wealth, LLC | 186 | 3 | ||||||
| 2026-02-11 | 13F | Capital Wealth Planning, LLC | 595.498 | 56,57 | 9.921 | 99,88 | ||||
| 2026-02-17 | 13F | Cetera Investment Advisers | 40.881 | -6,58 | 675 | 18,04 | ||||
| 2025-09-26 | NP | RMYAX - Multi-Strategy Income Fund Class A | 667 | -78,47 | 9 | -67,86 | ||||
| 2025-11-14 | 13F | National Bank Of Canada /fi/ | 0 | -100,00 | 0 | -100,00 | ||||
| 2026-02-12 | 13F | Quadrant Capital Group Llc | 16.268 | 0,01 | 268 | 26,42 | ||||
| 2026-02-02 | 13F | Advisors Preferred, LLC | 27.362 | 332,81 | 456 | 461,73 | ||||
| 2026-01-12 | 13F | Abound Wealth Management | 36 | 0,00 | 1 | |||||
| 2026-02-09 | 13F | Huntington National Bank | 1 | 0,00 | 0 | |||||
| 2026-02-17 | 13F | Qube Research & Technologies Ltd | 54.295 | 896 | ||||||
| 2026-02-13 | 13F | Caitong International Asset Management Co., Ltd | 1.319 | 5.634,78 | 22 | |||||
| 2026-02-10 | 13F | Sivia Capital Partners, LLC | 13.759 | -5,67 | 227 | 19,47 | ||||
| 2025-11-12 | 13F | NewSquare Capital LLC | 0 | -100,00 | 0 | |||||
| 2026-02-17 | 13F | Susquehanna International Group, Llp | 0 | -100,00 | 0 | |||||
| 2026-01-14 | 13F | Spire Wealth Management | 187 | 0,00 | 3 | 50,00 | ||||
| 2026-02-17 | 13F | PharVision Advisers, LLC | 13.051 | -44,06 | 215 | -29,28 | ||||
| 2026-02-11 | 13F | Simplex Trading, Llc | 10.124 | -70,00 | 167 | |||||
| 2026-02-11 | 13F | Simplex Trading, Llc | Call | 4.000 | -56,52 | 66 | ||||
| 2026-02-19 | 13F | CI Private Wealth, LLC | 152.850 | -0,03 | 2.497 | 25,16 | ||||
| 2025-10-21 | 13F | Simon Quick Advisors, Llc | 0 | -100,00 | 0 | -100,00 | ||||
| 2026-02-13 | 13F | State Street Corp | 883.266 | 5,32 | 14.574 | 33,16 | ||||
| 2026-02-11 | 13F | Simplex Trading, Llc | Put | 22.600 | 143,01 | 373 | ||||
| 2026-01-16 | 13F | Vanguard Capital Wealth Advisors This fund is a listed as child fund of Vanguard Group Inc and if that institution has disclosed ownership in this security, then these positions will not be double counted when calculating total shares and total value | 10.150 | -15,77 | 167 | 6,37 | ||||
| 2026-02-17 | 13F | CWM Advisors, LLC | 6.009 | 99 | ||||||
| 2025-11-14 | 13F | D. E. Shaw & Co., Inc. | 0 | -100,00 | 0 | |||||
| 2026-02-06 | 13F | Profund Advisors Llc | 12.096 | -6,25 | 200 | 18,45 | ||||
| 2026-02-11 | 13F | Vise Technologies, Inc. | 22.518 | 2,99 | 372 | 30,18 | ||||
| 2026-01-26 | 13F | PDS Planning, Inc | 25.622 | 0,85 | 423 | 27,49 | ||||
| 2026-02-10 | 13F | Goldman Sachs Group Inc | 847.902 | 9,13 | 13.990 | 37,98 | ||||
| 2025-11-13 | 13F | Donald Smith & Co., Inc. | 0 | -100,00 | 0 | |||||
| 2026-02-12 | 13F | Brown Brothers Harriman & Co | 187 | 0,00 | 3 | 50,00 | ||||
| 2026-02-09 | 13F | Hantz Financial Services, Inc. | 11.944 | 122,75 | 0 | |||||
| 2026-01-08 | 13F | True Wealth Design, LLC | 184 | 10,84 | 3 | 50,00 | ||||
| 2026-02-10 | 13F | Bnp Paribas Arbitrage, Sa | 114.546 | -20,85 | 1.890 | 0,11 | ||||
| 2026-02-10 | 13F | Natixis Advisors, L.p. | 0 | -100,00 | 0 | |||||
| 2026-01-29 | 13F | Vanguard Group Inc | 1.331.963 | 0,00 | 21.977 | 26,44 | ||||
| 2026-01-20 | 13F | Signaturefd, Llc | 23.201 | -1,13 | 383 | 24,84 | ||||
| 2025-11-13 | 13F | GeoWealth Management, LLC | 0 | -100,00 | 0 | |||||
| 2026-02-13 | 13F | Ariadne Wealth Management, LP | 19.438 | 5,76 | 414 | 35,41 | ||||
| 2026-02-19 | 13F | Atomi Financial Group, Inc. | 21.271 | 22,23 | 351 | 54,19 | ||||
| 2026-02-12 | 13F | EntryPoint Capital, LLC | 0 | -100,00 | 0 | |||||
| 2026-02-17 | 13F | Northern Trust Corp | 432.810 | 5,58 | 7.141 | 33,50 | ||||
| 2026-02-11 | 13F | Ramirez Asset Management, Inc. | 257.992 | 4.257 | ||||||
| 2026-02-12 | 13F | Principal Securities, Inc. | 0 | -100,00 | 0 | |||||
| 2026-02-17 | 13F | Fmr Llc | 115.840 | -4,59 | 1.911 | 20,64 | ||||
| 2026-02-05 | 13F | Gabelli Funds Llc | 381.000 | 0,00 | 6.286 | 26,43 | ||||
| 2026-02-13 | 13F | Pinnacle Wealth Planning Services, Inc. | 18.153 | 2,75 | 300 | 30,00 | ||||
| 2026-02-11 | 13F | O'shaughnessy Asset Management, Llc | 27.399 | 23,65 | 452 | 56,40 | ||||
| 2025-09-25 | NP | DEXC - Dimensional Emerging Markets ex China Core Equity ETF | 9.498 | 16,40 | 131 | 75,68 | ||||
| 2025-09-25 | NP | VGTSX - Vanguard Total International Stock Index Fund Investor Shares | 956.690 | 0,00 | 13.145 | 51,15 | ||||
| 2026-02-04 | 13F | Beverly Hills Private Wealth, LLC | 12.923 | 0,00 | 169 | 0,00 | ||||
| 2026-02-13 | 13F | Marshall Wace, Llp | 118.054 | 1.948 | ||||||
| 2026-02-13 | 13F | SRS Capital Advisors, Inc. | 8.802 | 603,60 | 145 | 806,25 | ||||
| 2026-01-22 | 13F | Venturi Wealth Management, LLC | 13.354 | 220 | ||||||
| 2026-02-06 | 13F | Larson Financial Group LLC | 888 | 1.024,05 | 15 | 1.300,00 | ||||
| 2026-02-13 | 13F | Smartleaf Asset Management LLC | 2.625 | 21,58 | 44 | 53,57 | ||||
| 2026-01-22 | 13F | Personal Cfo Solutions, Llc | 19.161 | 4,93 | 316 | 32,77 | ||||
| 2026-02-13 | 13F | Inspire Advisors, LLC | 11.522 | -1,75 | 190 | 24,18 | ||||
| 2026-02-20 | 13F | Dorsey Wright & Associates | 118.818 | 6,64 | 1.960 | 34,80 | ||||
| 2026-02-10 | 13F | Root Financial Partners, LLC | 86 | 1 | ||||||
| 2026-02-12 | 13F | Skopos Labs, Inc. | 40.985 | 687 | ||||||
| 2026-02-13 | 13F | Ieq Capital, Llc | 94.163 | 5,36 | 1.554 | 33,19 | ||||
| 2026-02-17 | 13F | Artisan Partners Limited Partnership | 142.443 | 2.350 | ||||||
| 2025-11-07 | 13F | HighTower Advisors, LLC | 0 | -100,00 | 0 | |||||
| 2026-02-13 | 13F | Atlas Capital Advisors Llc | 41.175 | 24,95 | 679 | 44,78 | ||||
| 2026-02-17 | 13F | Aqr Capital Management Llc | 58.571 | 13,15 | 966 | 43,11 | ||||
| 2026-02-17 | 13F | Lazard Asset Management Llc | 182.189 | -15,71 | 3.006 | 6,60 | ||||
| 2026-02-12 | 13F | Barometer Capital Management Inc. | 0 | -100,00 | 0 | |||||
| 2026-02-06 | 13F | FourThought Financial Partners, LLC | 15.918 | 263 | ||||||
| 2026-01-23 | 13F | Bridgewater Advisors Inc. | 11.367 | 264 | ||||||
| 2026-02-12 | 13F | BRYN MAWR TRUST Co | 4.500 | 0,00 | 74 | 27,59 | ||||
| 2026-02-13 | 13F | Barclays Plc | 2.757 | 45 | ||||||
| 2026-02-17 | 13F | Public Employees Retirement System Of Ohio | 57.647 | -17,69 | 951 | 4,16 | ||||
| 2026-02-12 | 13F | Campbell & CO Investment Adviser LLC | 47.301 | -38,26 | 780 | -21,92 | ||||
| 2026-02-13 | 13F | American Century Companies Inc | 685.276 | 13,02 | 11.307 | 42,91 | ||||
| 2026-02-17 | 13F | Point72 Asset Management, L.P. | 353.410 | 13,49 | 5.831 | 43,51 | ||||
| 2026-02-17 | 13F | Quantinno Capital Management LP | 324.640 | 12,60 | 5.357 | 42,37 | ||||
| 2026-02-17 | 13F | Engineers Gate Manager LP | 18.898 | 21,73 | 312 | 53,96 | ||||
| 2026-02-05 | 13F | HighMark Wealth Management LLC | 100 | 0,00 | 2 | 0,00 | ||||
| 2026-01-14 | 13F | Jfs Wealth Advisors, Llc | 653 | 0,00 | 11 | 25,00 | ||||
| 2026-02-17 | 13F | Laird Norton Trust Company, Llc | 89.964 | 1.484 | ||||||
| 2026-02-11 | 13F | West Family Investments, Inc. | 14.396 | 0,00 | 238 | 26,74 | ||||
| 2026-02-13 | 13F | First Trust Advisors Lp | 33.143 | 15,11 | 547 | 45,60 | ||||
| 2025-09-25 | NP | DFEM - Dimensional Emerging Markets Core Equity 2 ETF | 90.552 | 10,49 | 1.244 | 67,20 | ||||
| 2025-11-14 | 13F | Wolverine Trading, Llc | Call | 27.600 | 366 | |||||
| 2026-01-29 | 13F | Sanctuary Advisors, LLC | 42.138 | -36,07 | 695 | -19,19 | ||||
| 2026-02-13 | 13F | Cornerstone Financial Management LLC | 364 | 6 | ||||||
| 2026-02-06 | 13F | EverSource Wealth Advisors, LLC | 16.007 | -12,76 | 264 | 10,46 | ||||
| 2026-02-17 | 13F | Bank Of America Corp /de/ | 34.745 | -26,80 | 573 | -7,43 | ||||
| 2026-02-13 | 13F | JustInvest LLC | 208.312 | 12,75 | 3.437 | 42,55 | ||||
| 2025-10-29 | 13F | Wealth Enhancement Advisory Services, Llc | 0 | -100,00 | 0 | -100,00 | ||||
| 2026-02-13 | 13F | PCM Encore, LLC | 45.232 | 746 | ||||||
| 2026-02-13 | 13F | Sei Investments Co | 93.624 | -49,05 | 1.545 | -35,59 | ||||
| 2026-02-17 | 13F | Two Sigma Investments, Lp | 93.472 | 1.542 | ||||||
| 2026-02-13 | 13F | Rhumbline Advisers | 91.399 | -13,14 | 1.508 | 9,83 | ||||
| 2026-01-29 | 13F | IMC-Chicago, LLC | 16.877 | 278 | ||||||
| 2026-01-08 | 13F | Tuttle Tactical Management LLC | 10.510 | 173 | ||||||
| 2026-01-29 | 13F | IMC-Chicago, LLC | Put | 15.400 | 254 | |||||
| 2026-02-13 | 13F | Verition Fund Management LLC | 25.550 | 422 | ||||||
| 2026-01-15 | 13F | Nisa Investment Advisors, Llc | 1.827 | 21,80 | 30 | 57,89 | ||||
| 2026-02-12 | 13F | Wealthspire Advisors, LLC | 0 | -100,00 | 0 | |||||
| 2025-11-07 | 13F | Sierra Ocean, Llc | 0 | -100,00 | 0 | |||||
| 2026-02-10 | 13F | Acadian Asset Management Llc | 53.251 | 2.012,30 | 1 | |||||
| 2025-09-25 | NP | DFAX - Dimensional World ex U.S. Core Equity 2 ETF | 20.068 | 8,62 | 276 | 64,67 | ||||
| 2026-02-17 | 13F | Citadel Advisors Llc | Put | 17.000 | 280 | |||||
| 2026-02-17 | 13F | Citadel Advisors Llc | 210.282 | 70,46 | 3.470 | 115,60 | ||||
| 2026-02-17 | 13F | Citadel Advisors Llc | Call | 15.100 | -10,65 | 249 | 13,18 | |||
| 2025-09-25 | NP | DAADX - Emerging Markets ex China Core Equity Portfolio Institutional Class | 12.485 | -43,55 | 172 | -14,93 | ||||
| 2026-02-17 | 13F | Royal Bank Of Canada | 2.395 | -30,17 | 40 | -11,11 | ||||
| 2026-01-30 | 13F | North Star Investment Management Corp. | 242 | 4 | ||||||
| 2026-02-17 | 13F | XTX Topco Ltd | 0 | -100,00 | 0 | |||||
| 2026-02-10 | 13F | Envestnet Asset Management Inc | 174.872 | -15,29 | 2.885 | 7,13 | ||||
| 2026-02-17 | 13F | Advisory Services Network, LLC | 0 | -100,00 | 0 | |||||
| 2025-10-29 | 13F | WPG Advisers, LLC | 0 | -100,00 | 0 | -100,00 | ||||
| 2026-02-11 | 13F | Parallel Advisors, LLC | 1.476 | 0,00 | 24 | 26,32 | ||||
| 2026-01-26 | 13F | Cwm, Llc | 29.431 | 137,65 | 0 | |||||
| 2026-02-13 | 13F | Transamerica Financial Advisors, Inc. | 34 | 1 | ||||||
| 2026-02-10 | 13F | State of Wyoming | 0 | -100,00 | 0 | |||||
| 2026-02-06 | 13F | Pnc Financial Services Group, Inc. | 77.289 | -1,61 | 1.275 | 24,39 | ||||
| 2026-02-13 | 13F | Walleye Capital LLC | 141.494 | -5,87 | 2.335 | 19,02 | ||||
| 2026-02-12 | 13F | Dimensional Fund Advisors Lp | 703.998 | 1,28 | 11.624 | 28,01 | ||||
| 2026-02-18 | 13F | GWM Advisors LLC | 29.801 | -13,12 | 492 | 9,84 | ||||
| 2026-02-06 | 13F | Global Retirement Partners, LLC | 21.244 | 574,41 | 351 | 753,66 | ||||
| 2026-02-11 | 13F | Group One Trading, L.p. | 0 | -100,00 | 0 | -100,00 | ||||
| 2026-02-09 | 13F | Coldstream Capital Management Inc | 0 | -100,00 | 0 | |||||
| 2026-02-03 | 13F | Ethic Inc. | 10.588 | 175 | ||||||
| 2025-09-25 | NP | VEU - Vanguard FTSE All-World ex-US Index Fund ETF Shares | 343.598 | 6,33 | 4.721 | 60,74 | ||||
| 2026-02-13 | 13F | Dynamic Technology Lab Private Ltd | 13.744 | -60,64 | 227 | -50,22 | ||||
| 2026-02-17 | 13F | Jain Global LLC | 19.464 | 321 | ||||||
| 2026-01-16 | 13F | Ronald Blue Trust, Inc. | 35.802 | 0,90 | 591 | 27,43 | ||||
| 2026-02-06 | 13F | Bare Financial Services, Inc | 555 | -5,45 | 9 | 28,57 | ||||
| 2025-10-20 | 13F | Shilanski & Associates, Inc. | 19.635 | 256 | ||||||
| 2025-10-30 | 13F | Twin Peaks Wealth Advisors, LLC | 0 | -100,00 | 0 | |||||
| 2026-02-05 | 13F | Allworth Financial LP | 349 | -24,13 | 6 | -16,67 | ||||
| 2026-02-02 | 13F | Truist Financial Corp | 10.938 | -7,93 | 180 | 16,13 | ||||
| 2026-02-17 | 13F | Susquehanna International Group, Llp | Call | 15.000 | 248 | |||||
| 2026-02-03 | 13F | Sequoia Financial Advisors, LLC | 63.941 | -0,72 | 1.055 | 25,60 | ||||
| 2026-02-17 | 13F | Creative Planning | 15.004 | 3,25 | 248 | 30,69 | ||||
| 2026-01-21 | 13F | Stone House Investment Management, LLC | 87 | 1 | ||||||
| 2026-02-11 | 13F | Syon Capital Llc | 12.226 | 202 | ||||||
| 2026-02-12 | 13F | Hrt Financial Lp | 12.599 | 0 | ||||||
| 2026-01-29 | 13F | UBS Group AG | 244.688 | -9,90 | 4.037 | 13,91 | ||||
| 2026-02-12 | 13F | Integrated Quantitative Investments LLC | 41.477 | 169,63 | 684 | 242,00 | ||||
| 2026-02-13 | 13F | Ubs Asset Management Americas Inc | 2.731 | 45 | ||||||
| 2026-02-13 | 13F | Stifel Financial Corp | 71.418 | 2,38 | 1.178 | 29,45 | ||||
| 2026-02-17 | 13F | Graham Capital Management, L.P. | 0 | -100,00 | 0 | |||||
| 2026-01-22 | 13F | Financial Consulate, Inc | 72 | 1 | ||||||
| 2026-02-13 | 13F | Morgan Stanley | 6.037.153 | -2,48 | 99.613 | 23,30 | ||||
| 2025-11-14 | 13F | Peak6 Llc | Put | 0 | -100,00 | 0 | -100,00 | |||
| 2026-02-13 | 13F | Mariner, LLC | 118.681 | 17,92 | 1.963 | 49,43 | ||||
| 2026-01-30 | 13F | Pekin Hardy Strauss, Inc. | 41.000 | 134,29 | 676 | 196,49 | ||||
| 2026-01-27 | 13F | TD Waterhouse Canada Inc. | 36.072 | 647,76 | 594 | 873,77 | ||||
| 2026-02-06 | 13F | Vestmark Advisory Solutions, Inc. | 52.415 | 865 | ||||||
| 2026-01-15 | 13F | Burns Matteson Capital Management, LLC | 19.814 | 11,60 | 327 | 41,13 |
Other Listings
| US:KEP | 16,33 USD |