Statistiche di base
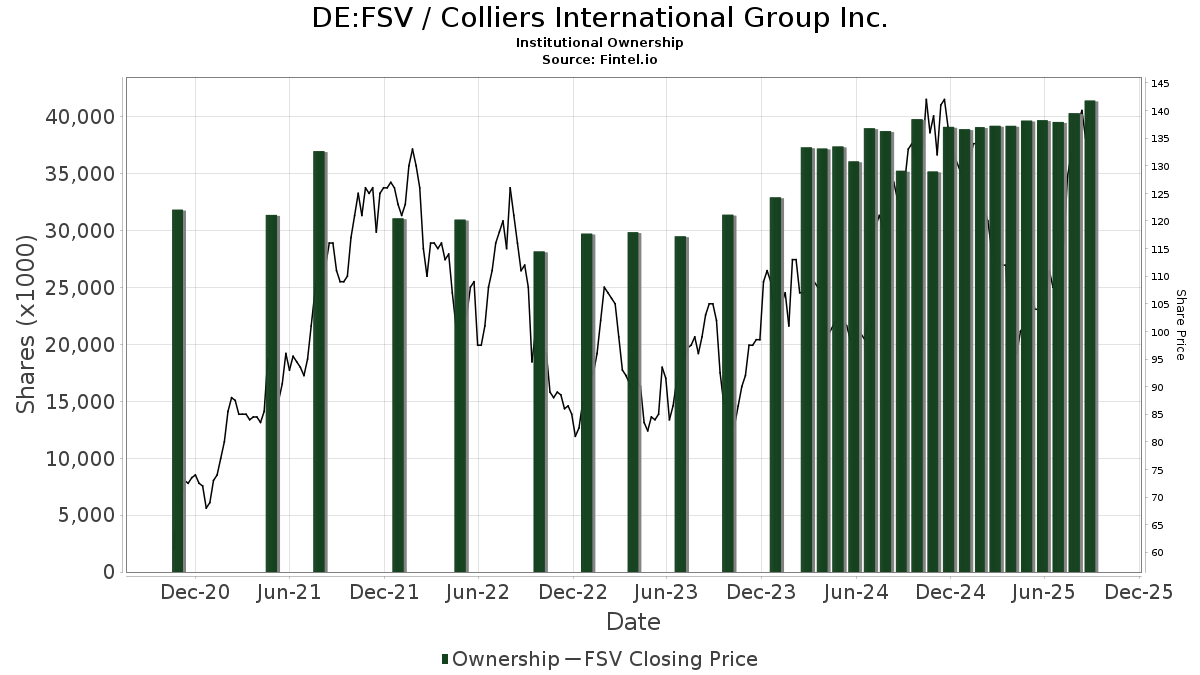
| Azioni istituzionali (Long) | 34.744.441 - 69,80% (ex 13D/G) - change of -6,11MM shares -14,95% MRQ |
| Valore istituzionale (Long) | $ 4.464.867 USD ($1000) |
Proprietà istituzionale e azionisti
Colliers International Group Inc. (DE:FSV) ha 208 proprietari istituzionali e azionisti che hanno presentato i moduli 13D/G o 13F alla Securities Exchange Commission (SEC). Queste istituzioni detengono un totale di 34,744,441 azioni. I maggiori azionisti includono Royal Bank Of Canada, Durable Capital Partners LP, 1832 Asset Management L.P., Vanguard Group Inc, FIL Ltd, Beutel, Goodman & Co Ltd., Price T Rowe Associates Inc /md/, Neuberger Berman Group LLC, Bank Of Montreal /can/, and T. Rowe Price Investment Management, Inc. .
(Colliers International Group Inc. (DB:FSV) la struttura proprietaria istituzionale mostra le attuali posizioni nella società da parte di istituzioni e fondi, nonché le ultime variazioni nella dimensione della posizione. I principali azionisti possono essere singoli investitori, fondi comuni, hedge fund o istituzioni. L'allegato 13D indica che l'investitore detiene (o ha detenuto) più del 5% della società e intende (o intendeva) perseguire attivamente un cambiamento nella strategia aziendale. L'allegato 13G indica un investimento passivo superiore al 5%.
The share price as of April 24, 2026 is 91,50 / share. Previously, on April 28, 2025, the share price was 98,00 / share. This represents a decline of 6,63% over that period.
Indice del sentiment dei fondi
L'indice del sentiment dei fondi (anche noto come "indice di accumulo di proprietà") individua i titoli più acquistati dai fondi. È il risultato di un sofisticato modello quantitativo multi-fattore che identifica le società con i più alti livelli di accumulo istituzionale. Il modello utilizza una combinazione dell'aumento totale dei proprietari dichiarati, delle variazioni nelle allocazioni di portafoglio di tali proprietari e di altre metriche. Il punteggio varia da 0 a 100: i numeri più alti indicano un livello di accumulo superiore ad altre società, mentre 50 rappresenta la media.
Frequenza di aggiornamento: giornaliera
Consulta Ownership Explorer per visualizzare l'elenco delle aziende con il ranking più alto.
AI+ Ask Fintel’s AI assistant about Colliers International Group Inc..
Select a question to share a public post with an AI-crafted answer.
Thinking of good questions…
Depositi 13F e NPORT
Le informazioni relative ai depositi 13F sono gratuite. Per accedere alle informazioni relative ai depositi NP è necessario un'abbonamento premium. Le righe verdi indicano le nuove posizioni. Le righe rosse indicano le posizioni chiuse. Fai clic sull'icona del link per visualizzare la cronologia completa delle transazioni.
Esegui l'upgrade
per sbloccare i dati premium ed esportarli in Excel ![]() .
.
| Data di deposito | Fonte | Investitore | Tipo | Prezzo medio (Stima) |
Azioni | Δ Azioni (%) |
Valore dichiarato ($ 1000) |
Δ Valore (%) |
Allocazione del portafoglio (%) |
|
|---|---|---|---|---|---|---|---|---|---|---|
| 2026-04-20 | 13F | Jfs Wealth Advisors, Llc | 4 | -20,00 | 0 | |||||
| 2026-02-18 | 13F | GWM Advisors LLC | 2.122 | 312 | ||||||
| 2026-04-07 | 13F | Signaturefd, Llc | 28 | 0,00 | 3 | -50,00 | ||||
| 2025-10-31 | 13F | Whittier Trust Co | 0 | -100,00 | 0 | -100,00 | ||||
| 2026-02-17 | 13F | Bank Of America Corp /de/ | 52.184 | -39,10 | 7.672 | -42,69 | ||||
| 2026-02-13 | 13F | Charles Schwab Investment Management Inc | 110.763 | 1,11 | 16.302 | -4,87 | ||||
| 2026-02-11 | 13F | Deutsche Bank Ag\ | 46.280 | 2,83 | 6.804 | -3,23 | ||||
| 2026-02-12 | 13F | Bank Of Nova Scotia Trust Co | 14.439 | 20,50 | 2.123 | 13,42 | ||||
| 2026-02-10 | 13F | Connor, Clark & Lunn Investment Management Ltd. | 105.192 | 2,03 | 15.462 | -4,09 | ||||
| 2026-02-11 | 13F | Erste Asset Management GmbH | 11.400 | 1.703 | ||||||
| 2026-02-10 | 13F | Td Asset Management Inc | 247.607 | -0,30 | 36.438 | -6,19 | ||||
| 2026-04-17 | 13F | Cidel Asset Management Inc | 127.860 | 189,43 | 13.627 | 109,60 | ||||
| 2026-02-17 | 13F | Point72 Asset Management, L.P. | 7.835 | 1.152 | ||||||
| 2026-02-12 | 13F | Leith Wheeler Investment Counsel Ltd. | 2.500 | 368 | ||||||
| 2026-02-17 | 13F | Susquehanna International Group, Llp | 0 | -100,00 | 0 | |||||
| 2026-02-12 | 13F | Northwest & Ethical Investments L.P. | 30.066 | 17,50 | 4.446 | 10,71 | ||||
| 2026-02-11 | 13F | Clearbridge Investments, LLC | 300.798 | -1,28 | 44.220 | -7,10 | ||||
| 2026-02-13 | 13F | Caitong International Asset Management Co., Ltd | 0 | -100,00 | 0 | |||||
| 2026-02-09 | 13F | Hantz Financial Services, Inc. | 14 | -46,15 | 0 | |||||
| 2026-01-16 | 13F | Trust Co Of Vermont | 144 | 0,00 | 21 | -4,55 | ||||
| 2026-02-04 | 13F | Versor Investments LP | 2.415 | 6,25 | 355 | -0,28 | ||||
| 2026-04-16 | 13F | Toth Financial Advisory Corp | 45 | 0,00 | 5 | -33,33 | ||||
| 2026-02-17 | 13F | Citadel Advisors Llc | 23.307 | -75,40 | 3.426 | -76,85 | ||||
| 2026-04-21 | 13F | Dougherty Wealth Advisers LLC | 20 | 0,00 | 2 | 0,00 | ||||
| 2026-02-17 | 13F | Citadel Advisors Llc | Call | 2.100 | 309 | |||||
| 2026-02-17 | 13F | Jump Financial, LLC | 5.706 | 43,84 | 839 | 35,38 | ||||
| 2026-02-18 | 13F | Vident Advisory, LLC | 1.907 | -26,77 | 280 | -31,03 | ||||
| 2026-02-17 | 13F | Price T Rowe Associates Inc /md/ | 1.308.985 | 16,74 | 192 | 9,71 | ||||
| 2026-01-29 | 13F | Montrusco Bolton Investments Inc. | 129.177 | -4,86 | 19.012 | -10,49 | ||||
| 2026-02-17 | 13F | Jones Financial Companies Lllp | 34 | 5 | ||||||
| 2026-04-22 | 13F | Pictet Asset Management Holding SA | 8.518 | 9,32 | 908 | -20,86 | ||||
| 2026-02-17 | 13F | Greenland Capital Management LP | 47.114 | 6.926 | ||||||
| 2026-02-09 | 13F | Huntington National Bank | 1 | 0,00 | 0 | |||||
| 2026-02-12 | 13F | Federation des caisses Desjardins du Quebec | 51.783 | -3,35 | 7.521 | -9,35 | ||||
| 2026-02-11 | 13F | Franklin Resources Inc | 439.779 | 24,31 | 64.641 | 16,86 | ||||
| 2026-02-02 | 13F | Fenimore Asset Management Inc | 222.258 | -10,10 | 32.674 | -15,39 | ||||
| 2026-02-09 | 13F | Smithfield Trust Co | 746 | 0,00 | 0 | |||||
| 2026-02-09 | 13F | Royce & Associates Lp | 383.228 | 0,62 | 56.338 | -5,31 | ||||
| 2026-02-17 | 13F | Voloridge Investment Management, Llc | 2.610 | -72,08 | 384 | -73,77 | ||||
| 2026-01-27 | 13F | Zurcher Kantonalbank (Zurich Cantonalbank) | 12.586 | 5,84 | 1.852 | -0,43 | ||||
| 2026-01-30 | 13F | Lincluden Management Ltd | 40.891 | 0,00 | 8 | 33,33 | ||||
| 2026-02-17 | 13F | Investment Management Corp of Ontario | 5.435 | 229,19 | 799 | 210,51 | ||||
| 2026-02-09 | 13F | Legal & General Group Plc | 40.087 | -8,65 | 5.900 | -14,06 | ||||
| 2026-02-12 | 13F | Sit Investment Associates Inc | 0 | -100,00 | 0 | |||||
| 2026-04-17 | 13F | Bell Investment Advisors, Inc | 5 | -44,44 | 1 | -100,00 | ||||
| 2026-02-17 | 13F | Trexquant Investment LP | 1.984 | 292 | ||||||
| 2026-02-17 | 13F | Susquehanna International Group, Llp | Call | 4.500 | 114,29 | 662 | 101,52 | |||
| 2026-02-13 | 13F | National Bank Of Canada /fi/ | 124.153 | 8,62 | 18.004 | 1,98 | ||||
| 2026-04-15 | 13F | Addenda Capital Inc. | 166.288 | -1,98 | 24.732 | -27,81 | ||||
| 2026-02-13 | 13F | Marshall Wace, Llp | 0 | -100,00 | 0 | |||||
| 2026-02-03 | 13F | Premier Fund Managers Ltd | 3.501 | 0,00 | 1 | |||||
| 2026-02-17 | 13F | Brevan Howard Capital Management LP | 0 | -100,00 | 0 | |||||
| 2026-02-11 | 13F | TCTC Holdings, LLC | 217 | 0,00 | 32 | -6,06 | ||||
| 2026-02-17 | 13F | Raymond James Financial Inc | 13.622 | 8,32 | 2.003 | 1,93 | ||||
| 2026-02-13 | 13F | Turtle Creek Asset Management Inc. | 813.241 | -0,35 | 119.555 | -6,22 | ||||
| 2026-02-12 | 13F | Principal Securities, Inc. | 0 | -100,00 | 0 | |||||
| 2026-02-13 | 13F | Walleye Capital LLC | 0 | -100,00 | 0 | |||||
| 2026-02-17 | 13F | D. E. Shaw & Co., Inc. | 35.352 | -52,52 | 5.197 | -55,33 | ||||
| 2025-11-14 | 13F | Susquehanna International Group, Llp | Put | 0 | -100,00 | 0 | -100,00 | |||
| 2026-01-29 | 13F | UBS Group AG | 38.202 | 48,28 | 5.616 | 39,56 | ||||
| 2025-11-03 | 13F | Stonegate Investment Group, LLC | 1.900 | 4,17 | 297 | 24,37 | ||||
| 2026-02-02 | 13F | Intact Investment Management Inc. | 80.950 | 7,67 | 11.898 | 1,17 | ||||
| 2026-04-13 | 13F | Compass Ion Advisors, LLC | 2.631 | 0,00 | 281 | -27,20 | ||||
| 2026-02-13 | 13F | Rhumbline Advisers | 1.159 | -9,74 | 170 | -15,00 | ||||
| 2025-11-06 | 13F | MQS Management LLC | 0 | -100,00 | 0 | -100,00 | ||||
| 2025-11-14 | 13F | ExodusPoint Capital Management, LP | 6.144 | 960 | ||||||
| 2026-01-27 | 13F | TD Waterhouse Canada Inc. | 30.027 | -36,08 | 4.363 | -39,59 | ||||
| 2026-02-12 | 13F | Bank Of Montreal /can/ | 1.076.806 | 68,99 | 158.274 | 58,86 | ||||
| 2026-02-17 | 13F | Two Sigma Investments, Lp | 1.874 | -88,34 | 275 | -89,04 | ||||
| 2026-04-16 | 13F | Security National Bank | 553 | 0,00 | 59 | -27,16 | ||||
| 2026-02-12 | 13F | Hrt Financial Lp | 0 | -100,00 | 0 | |||||
| 2026-02-13 | 13F | Mml Investors Services, Llc | 3.095 | 9,83 | 455 | 3,18 | ||||
| 2026-02-12 | 13F | Ci Investments Inc. | 76.532 | 1,52 | 11.251 | 102.172,73 | ||||
| 2026-04-22 | 13F | Fort Washington Investment Advisors Inc /oh/ | 184.045 | -6,64 | 19.673 | -32,12 | ||||
| 2026-02-13 | 13F | SRS Capital Advisors, Inc. | 218 | 136,96 | 32 | 128,57 | ||||
| 2026-02-17 | 13F | T. Rowe Price Investment Management, Inc. | 861.599 | -7,86 | 127 | -13,70 | ||||
| 2025-11-14 | 13F | Sagard Holdings Management Inc. | 555 | -0,89 | 87 | 17,81 | ||||
| 2026-02-17 | 13F | Durable Capital Partners LP | 3.369.760 | -8,90 | 495.388 | -14,27 | ||||
| 2026-02-19 | 13F | Invesco Ltd. | 245.824 | 2,06 | 36.139 | -3,95 | ||||
| 2026-04-15 | 13F | Exchange Traded Concepts, Llc | 329 | 35 | ||||||
| 2026-02-17 | 13F | Jain Global LLC | 0 | -100,00 | 0 | |||||
| 2026-02-13 | 13F | Wells Fargo & Company/mn | 8.947 | 56,61 | 1.316 | 47,26 | ||||
| 2026-02-17 | 13F | Public Employees Retirement System Of Ohio | 38.454 | 22,01 | 5.656 | 14,82 | ||||
| 2026-02-06 | 13F | HighTower Advisors, LLC | 2.258 | 2,13 | 332 | -4,06 | ||||
| 2026-04-07 | 13F | Central Pacific Bank - Trust Division | 1.222 | -10,28 | 131 | -35,00 | ||||
| 2026-02-17 | 13F | Blair William & Co/il | 33.575 | 0,06 | 4.936 | -5,84 | ||||
| 2026-02-02 | 13F | Kornitzer Capital Management Inc /ks | 4.884 | 0,00 | 718 | -5,91 | ||||
| 2026-02-13 | 13F | American Century Companies Inc | 414.227 | 15,78 | 60.896 | 8,96 | ||||
| 2026-02-17 | 13F | Capstone Investment Advisors, Llc | 0 | -100,00 | 0 | -100,00 | ||||
| 2026-02-13 | 13F | Verition Fund Management LLC | 0 | -100,00 | 0 | |||||
| 2026-02-13 | 13F | Sei Investments Co | 21.135 | 9,85 | 3.107 | 3,39 | ||||
| 2026-02-17 | 13F | Laird Norton Trust Company, Llc | 2.618 | 385 | ||||||
| 2026-02-04 | 13F | First Eagle Investment Management, LLC | 6.234 | 82,92 | 916 | 72,18 | ||||
| 2026-02-10 | 13F | Core Wealth Advisors, Llc | 158 | 23 | ||||||
| 2025-11-13 | 13F | UBS Group AG | Put | 0 | -100,00 | 0 | -100,00 | |||
| 2026-02-13 | 13F | Victory Capital Management Inc | 284.150 | -26,30 | 41.773 | -30,64 | ||||
| 2026-02-11 | 13F | Jpmorgan Chase & Co | 491.724 | 42,87 | 72.288 | 34,46 | ||||
| 2026-02-13 | 13F | Aviso Financial Inc. | 0 | -100,00 | 0 | |||||
| 2026-02-10 | 13F | Nomura Asset Management Co Ltd | 0 | 0 | ||||||
| 2026-02-18 | 13F | Mackenzie Financial Corp | 421.598 | -5,68 | 62.905 | -9,99 | ||||
| 2026-02-11 | 13F | Picton Mahoney Asset Management | 375.697 | 7,58 | 55.299 | 102.303,70 | ||||
| 2026-02-17 | 13F | Numerai GP LLC | 3.209 | -28,34 | 472 | -32,62 | ||||
| 2026-02-13 | 13F | Dixon Mitchell Investment Counsel Inc. | 74.011 | 0,00 | 10.904 | -5,82 | ||||
| 2026-02-17 | 13F | Wellington Management Group Llp | 25.693 | -4,38 | 3.781 | -10,04 | ||||
| 2026-02-17 | 13F | Agf Management Ltd | 76.502 | 0,00 | 11.244 | -6,02 | ||||
| 2026-01-05 | 13F | Argent Capital Management Llc | 42.862 | -2,36 | 6.301 | -8,11 | ||||
| 2026-04-17 | 13F | Murphy & Mullick Capital Management Corp | 1.326 | 0,00 | 142 | -27,32 | ||||
| 2026-02-13 | 13F | Neuberger Berman Group LLC | 1.150.425 | 4,72 | 169.124 | -1,45 | ||||
| 2026-02-17 | 13F | Royal Bank Of Canada | 3.841.380 | -5,64 | 564.720 | -11,20 | ||||
| 2026-02-11 | 13F | Capital International Investors | 185.633 | 0,00 | 27.285 | -6,02 | ||||
| 2026-02-17 | 13F | Silvercrest Asset Management Group Llc | 45.484 | -4,66 | 6.687 | -10,28 | ||||
| 2026-02-17 | 13F | Optiver Holding B.V. | 1 | 0 | ||||||
| 2026-02-17 | 13F | Fmr Llc | 705.342 | 8,16 | 103.674 | 1,66 | ||||
| 2026-02-04 | 13F | Brummer Multi-Strategy AB | 0 | -100,00 | 0 | |||||
| 2026-02-13 | 13F | Alberta Investment Management Corp | 325.200 | 47.799 | ||||||
| 2026-04-21 | 13F | Aaron Wealth Advisors LLC | 0 | -100,00 | 0 | |||||
| 2026-02-10 | 13F | Bnp Paribas Arbitrage, Sa | 24.094 | 219,97 | 3.542 | 201,19 | ||||
| 2026-02-14 | 13F | Rockefeller Capital Management L.P. | 162 | 86,21 | 24 | 76,92 | ||||
| 2026-02-13 | 13F | Arrowstreet Capital, Limited Partnership | 0 | -100,00 | 0 | |||||
| 2026-02-12 | 13F | Jane Street Group, Llc | 7.440 | -79,34 | 1.094 | -80,59 | ||||
| 2026-02-06 | 13F | Covestor Ltd | 8 | 0,00 | 0 | |||||
| 2026-02-17 | 13F | FIL Ltd | 1.780.980 | 5,02 | 261.772 | -1,31 | ||||
| 2026-02-12 | 13F | Jane Street Group, Llc | Put | 10.000 | 1.470 | |||||
| 2026-04-07 | 13F | Farther Finance Advisors, LLC | 25 | 3 | ||||||
| 2026-02-03 | 13F | Sequoia Financial Advisors, LLC | 2.424 | 0,00 | 357 | -6,07 | ||||
| 2026-02-09 | 13F | King Luther Capital Management Corp | 39.749 | 7,60 | 5.844 | 1,27 | ||||
| 2026-02-17 | 13F | Ameriprise Financial Inc | 295.332 | -8,78 | 43.417 | -14,16 | ||||
| 2026-02-12 | 13F | Moneta Group Investment Advisors Llc | 1.975 | 8,28 | 290 | 2,11 | ||||
| 2026-01-26 | 13F | Cwm, Llc | 13 | 0 | ||||||
| 2026-02-17 | 13F | Schonfeld Strategic Advisors LLC | 0 | -100,00 | 0 | |||||
| 2025-11-12 | 13F | Group One Trading, L.p. | Put | 0 | -100,00 | 0 | ||||
| 2026-02-11 | 13F | Empowered Funds, LLC | 22.469 | 3,07 | 3.303 | -3,00 | ||||
| 2026-02-10 | 13F | Envestnet Asset Management Inc | 8.463 | 4,40 | 1.244 | -1,74 | ||||
| 2026-02-13 | 13F | Kestra Advisory Services, LLC | 219 | 32 | ||||||
| 2025-11-21 | 13F | Nebula Research & Development LLC | 0 | -100,00 | 0 | |||||
| 2026-02-12 | 13F | Campbell & CO Investment Adviser LLC | 3.874 | 56,40 | 570 | 47,41 | ||||
| 2026-02-13 | 13F | Police & Firemen's Retirement System of New Jersey | 15.286 | 0,00 | 2.250 | -5,94 | ||||
| 2026-02-12 | 13F | Pembroke Management, LTD | 3.530 | -7,30 | 519 | -12,79 | ||||
| 2026-02-13 | 13F | Thornburg Investment Management Inc | 7.439 | 345,98 | 1.094 | 320,38 | ||||
| 2026-02-06 | 13F | Pnc Financial Services Group, Inc. | 0 | -100,00 | 0 | |||||
| 2026-04-17 | 13F | Kirr Marbach & Co Llc /in/ | 138.731 | 1,75 | 14.829 | -26,06 | ||||
| 2026-02-13 | 13F | Dynamic Technology Lab Private Ltd | 0 | -100,00 | 0 | |||||
| 2026-01-29 | 13F | Vanguard Group Inc | 1.996.018 | 1,19 | 293.379 | -4,90 | ||||
| 2026-02-13 | 13F | Chevy Chase Trust Holdings, Inc. | 5.900 | 0,00 | 867 | -5,86 | ||||
| 2026-02-13 | 13F | Epoch Investment Partners, Inc. | 16.873 | 27,64 | 2.480 | 20,16 | ||||
| 2026-04-22 | 13F | Smallwood Wealth Investment Management, LLC | 3 | 0,00 | 0 | |||||
| 2026-01-21 | 13F | Clayton Financial Group LLC | 0 | -100,00 | 0 | |||||
| 2026-01-09 | 13F | SG Americas Securities, LLC | 0 | -100,00 | 0 | |||||
| 2026-02-10 | 13F | Hillsdale Investment Management Inc. | 300 | 0,00 | 44 | -4,35 | ||||
| 2026-02-13 | 13F | Public Sector Pension Investment Board | 2.546 | 374 | ||||||
| 2026-02-17 | 13F | Alliancebernstein L.p. | 6.136 | 0,00 | 902 | -5,85 | ||||
| 2026-02-17 | 13F | Janus Henderson Group Plc | 649.373 | 37,12 | 95.449 | 29,03 | ||||
| 2025-11-14 | 13F | Susquehanna Advisors Group, Inc. | 0 | -100,00 | 0 | |||||
| 2026-02-17 | 13F | Prelude Capital Management, Llc | 8.069 | 1.186 | ||||||
| 2026-02-17 | 13F | Tower Research Capital LLC (TRC) | 903 | 133 | ||||||
| 2026-02-06 | 13F | EverSource Wealth Advisors, LLC | 215 | -30,87 | 32 | -35,42 | ||||
| 2026-02-12 | 13F | Loomis Sayles & Co L P | 393.875 | 6,28 | 57.904 | 0,02 | ||||
| 2026-02-17 | 13F | Auxier Asset Management | 7.160 | 0,00 | 1.053 | -5,90 | ||||
| 2026-02-10 | 13F | Norges Bank | 577.640 | 84.906 | ||||||
| 2026-02-12 | 13F | Scotia Capital Inc. | 10.246 | -0,11 | 1.487 | -6,36 | ||||
| 2026-02-17 | 13F | Amundi | 2.182 | 321 | ||||||
| 2026-02-12 | 13F | Renaissance Technologies Llc | 376.700 | -18,69 | 55.379 | -23,48 | ||||
| 2026-02-09 | 13F | Hartland & Co., LLC | 0 | -100,00 | 0 | |||||
| 2026-02-17 | 13F | Toronto Dominion Bank | 31.625 | 85,53 | 4.649 | 73,43 | ||||
| 2025-11-14 | 13F | Squarepoint Ops LLC | 0 | -100,00 | 0 | -100,00 | ||||
| 2026-02-10 | 13F | Goldman Sachs Group Inc | 27.833 | -71,29 | 4.092 | -72,99 | ||||
| 2026-04-21 | 13F | GHP Investment Advisors, Inc. | 407 | 0,00 | 44 | -27,12 | ||||
| 2026-02-17 | 13F | Millennium Management Llc | 8.494 | -58,27 | 1.249 | -60,74 | ||||
| 2026-01-27 | 13F | Evergreen Capital Management Llc | 1.760 | 0,00 | 259 | -5,47 | ||||
| 2026-02-17 | 13F | Spruce House Investment Management Llc | 0 | -100,00 | 0 | |||||
| 2026-02-06 | 13F | BloombergSen Inc. | 585.856 | -7,19 | 86.127 | -12,66 | ||||
| 2026-04-17 | 13F | Brown, Lisle/cummings, Inc. | 18 | 2 | ||||||
| 2026-02-12 | 13F | Dimensional Fund Advisors Lp | 361.854 | 9,16 | 53.203 | 2,74 | ||||
| 2026-01-21 | 13F | Newbridge Financial Services Group, Inc. | 11 | 0,00 | 2 | 0,00 | ||||
| 2026-02-13 | 13F | Beutel, Goodman & Co Ltd. | 1.601.611 | -7,55 | 236 | -13,28 | ||||
| 2026-02-11 | 13F | LPL Financial LLC | 2.331 | 7,17 | 343 | 0,88 | ||||
| 2026-02-13 | 13F | Peak6 Llc | Call | 0 | -100,00 | 0 | ||||
| 2026-02-13 | 13F | BRITISH COLUMBIA INVESTMENT MANAGEMENT Corp | 523.414 | 144,32 | 76.934 | 129,66 | ||||
| 2026-04-22 | 13F | Motco | 1.195 | -25,27 | 128 | -45,96 | ||||
| 2026-02-17 | 13F | Harris Associates L P | 72.600 | -9,48 | 10.671 | -14,90 | ||||
| 2026-02-17 | 13F | Advisor Group Holdings, Inc. | 11 | 0,00 | 2 | 0,00 | ||||
| 2026-02-17 | 13F | Russell Investments Group, Ltd. | 8.905 | -27,71 | 1.311 | -32,02 | ||||
| 2026-02-18 | 13F | State of Tennessee, Treasury Department | 436 | -77,64 | 60 | -80,66 | ||||
| 2026-02-10 | 13F | CIBC World Markets Inc. | 192.938 | -6,06 | 28.362 | -11,69 | ||||
| 2026-02-13 | 13F | Mariner, LLC | 0 | -100,00 | 0 | |||||
| 2026-02-10 | 13F | Quantbot Technologies LP | 0 | -100,00 | 0 | |||||
| 2026-02-09 | 13F | Waratah Capital Advisors Ltd. | 20.108 | 0,00 | 2.956 | -5,89 | ||||
| 2026-04-22 | 13F | Canoe Financial LP | 13.527 | -64,75 | 1.446 | -74,37 | ||||
| 2026-02-05 | 13F | Thrivent Financial For Lutherans | 62.084 | -49,38 | 9 | -52,63 | ||||
| 2026-02-13 | 13F | Manufacturers Life Insurance Company, The | 0 | -100,00 | 0 | |||||
| 2026-02-13 | 13F | Morgan Stanley | 111.141 | 8,01 | 16.339 | 1,64 | ||||
| 2026-04-13 | 13F | True Wealth Design, LLC | 0 | -100,00 | 0 | |||||
| 2026-02-17 | 13F | Artisan Partners Limited Partnership | 478.867 | -7,74 | 70.394 | -13,20 | ||||
| 2026-04-07 | 13F | Pathway Financial Advisors LLC | 0 | -100,00 | 0 | |||||
| 2026-02-13 | 13F | Cornerstone Financial Management LLC | 7 | 1 | ||||||
| 2026-02-18 | 13F | Guardian Capital Lp | 1.793 | -71,96 | 264 | -73,70 | ||||
| 2026-04-20 | 13F | Ronald Blue Trust, Inc. | 430 | 0,00 | 46 | -28,57 | ||||
| 2026-01-30 | 13F | Us Bancorp \de\ | 673 | -0,59 | 99 | -6,67 | ||||
| 2026-02-12 | 13F | Colony Capital, Inc. | 22.335 | 3.283 | ||||||
| 2026-04-24 | 13F | Keybank National Association/oh | 0 | -100,00 | 0 | |||||
| 2026-02-10 | 13F | CIBC Asset Management Inc | 139.857 | -1,20 | 20.569 | -6,98 | ||||
| 2026-02-13 | 13F | Great West Life Assurance Co /can/ | 4.582 | -63,30 | 1 | -100,00 | ||||
| 2026-02-10 | 13F | Commonwealth Of Pennsylvania Public School Empls Retrmt Sys | 10.151 | 0,00 | 1.492 | -5,87 | ||||
| 2026-02-17 | 13F | Aquatic Capital Management LLC | 1.937 | -85,60 | 285 | -86,48 | ||||
| 2026-03-06 | 13F | Hsbc Holdings Plc | 0 | -100,00 | 0 | |||||
| 2026-02-12 | 13F | BlackRock, Inc. | 10.015 | -1,99 | 1.472 | -7,77 | ||||
| 2026-01-14 | 13F | Cooper Investors Pty Ltd | 30.217 | 0,38 | 4.442 | -5,53 | ||||
| 2025-11-14 | 13F | XTX Topco Ltd | 0 | -100,00 | 0 | -100,00 | ||||
| 2026-02-13 | 13F | Barclays Plc | 6.871 | 11,11 | 1.010 | 4,55 | ||||
| 2026-04-22 | 13F | Stone House Investment Management, LLC | 8 | 1 | ||||||
| 2026-02-11 | 13F | Tacita Capital Inc | 18 | 0,00 | 3 | 0,00 | ||||
| 2025-11-12 | 13F | Burgundy Asset Management Ltd. | 424.796 | -0,40 | 70.094 | 25,84 | ||||
| 2025-11-14 | 13F | Gluskin Sheff & Assoc Inc | 0 | -100,00 | 0 | |||||
| 2026-02-09 | 13F | Geode Capital Management, Llc | 86.531 | 8,68 | 12.815 | 2,81 | ||||
| 2026-02-04 | 13F | Clark Wealth Partners | 158 | 0,00 | 23 | 0,00 | ||||
| 2026-02-13 | 13F | Citigroup Inc | 59.513 | 8,71 | 8.759 | 2,28 | ||||
| 2026-02-17 | 13F | Anson Funds Management LP | 25.000 | 3.675 | ||||||
| 2026-01-27 | 13F | Vista Finance, Llc | 2.505 | -4,68 | 368 | -10,24 | ||||
| 2026-02-17 | 13F | Quantinno Capital Management LP | 3.553 | 44,02 | 523 | 35,58 | ||||
| 2026-02-13 | 13F | Quarry LP | 8 | -84,31 | 1 | -85,71 | ||||
| 2026-02-17 | 13F | Lazard Asset Management Llc | 38.559 | 205,22 | 5.668 | 187,23 | ||||
| 2026-02-12 | 13F | Steward Partners Investment Advisory, Llc | 19.852 | -0,17 | 2.918 | -6,05 | ||||
| 2026-04-24 | 13F | Triasima Portfolio Management inc. | 0 | -100,00 | 0 | |||||
| 2026-02-17 | 13F | Tudor Investment Corp Et Al | 1.703 | -96,32 | 250 | -96,54 | ||||
| 2025-11-14 | 13F | Ubs Asset Management Americas Inc | 0 | -100,00 | 0 | |||||
| 2026-02-17 | 13F | Fairfax Financial Holdings Ltd/ Can | 22.000 | 0,00 | 3.191 | -6,15 | ||||
| 2026-02-13 | 13F | CDAM (UK) Ltd | 421.695 | 0,79 | 61.993 | -5,15 | ||||
| 2026-02-17 | 13F | Engineers Gate Manager LP | 1.674 | 28,57 | 246 | 21,18 | ||||
| 2026-02-13 | 13F | Jb Capital Partners Lp | 30.104 | 0,00 | 4.426 | -5,89 | ||||
| 2026-02-17 | 13F | Two Sigma Advisers, Lp | 0 | -100,00 | 0 | |||||
| 2026-02-11 | 13F | SOUTH STATE Corp | 118 | 0,00 | 17 | -5,56 | ||||
| 2026-02-09 | 13F | Vulcan Value Partners, LLC | 184.403 | -0,89 | 27 | -99,91 | ||||
| 2026-02-11 | 13F | Vestcor Inc | 15.000 | 2 | ||||||
| 2026-02-13 | 13F | LRT Capital Management, LLC | 0 | -100,00 | 0 | |||||
| 2026-02-13 | 13F | 1832 Asset Management L.P. | 2.402.439 | 578,19 | 353.183 | 538,25 | ||||
| 2026-04-22 | 13F | Louisbourg Investments Inc. | 75.882 | 46,57 | 8.097 | 6,25 | ||||
| 2025-11-14 | 13F | Wolverine Trading, Llc | 3.713 | 584 | ||||||
| 2025-11-14 | 13F | Wetherby Asset Management Inc | 2.618 | 0,00 | 409 | 19,65 | ||||
| 2025-10-31 | 13F | Whittier Trust Co Of Nevada Inc | 0 | -100,00 | 0 | |||||
| 2026-02-10 | 13F | Acadian Asset Management Llc | 195.428 | 16,99 | 29 | 7,69 | ||||
| 2026-02-13 | 13F | Ceredex Value Advisors LLC | 70.325 | 12,39 | 10.338 | 5,77 | ||||
| 2026-01-30 | 13F | State of New Jersey Common Pension Fund D | 14.670 | 6,18 | 2.157 | -0,09 | ||||
| 2026-03-20 | 13F/A | HughesLittle Investment Management Ltd. | 4.400 | -68,57 | 648 | -70,44 | ||||
| 2026-01-29 | 13F | Cornerstone Investment Partners, LLC | 3.334 | 2,08 | 490 | -3,92 | ||||
| 2026-02-12 | 13F | Nuveen, LLC | 31.454 | 0,00 | 4.629 | -5,91 | ||||
| 2026-02-12 | 13F | New York State Common Retirement Fund | 42.285 | -13,80 | 6.216 | -18,88 | ||||
| 2026-02-12 | 13F | Rossby Financial, LCC | 11 | 22,22 | 2 | 0,00 | ||||
| 2026-02-11 | 13F | Simplex Trading, Llc | 0 | -100,00 | 0 | |||||
| 2026-01-22 | 13F | Massachusetts Financial Services Co /ma/ | 115.350 | 3,66 | 16.958 | -2,45 | ||||
| 2026-02-13 | 13F | JustInvest LLC | 2.705 | -6,47 | 398 | -11,97 | ||||
| 2025-11-07 | 13F | Shell Asset Management Co | 644 | -72,54 | 0 | |||||
| 2026-02-12 | 13F | Swiss National Bank | 83.400 | 1,83 | 12.283 | -4,14 | ||||
| 2026-02-12 | 13F | CIBC Private Wealth Group, LLC | 677 | 0,00 | 100 | -5,71 | ||||
| 2026-02-09 | 13F | Waratah Capital Advisors Ltd. | Call | 0 | -100,00 | 0 | -100,00 | |||
| 2026-02-11 | 13F | Modus Advisors, LLC | 16 | 2 | ||||||
| 2026-04-08 | 13F | Thompson Investment Management, Inc. | 15.175 | 9,17 | 1.622 | -20,61 | ||||
| 2026-02-04 | 13F | Swiss Life Asset Management Ltd | 1.880 | 0,00 | 276 | -6,12 | ||||
| 2026-02-11 | 13F | Fiera Capital Corp | 88.208 | 0,82 | 12.969 | -5,18 |