Statistiche di base
| Proprietari istituzionali | 91 total, 88 long only, 0 short only, 3 long/short - change of -6,93% MRQ |
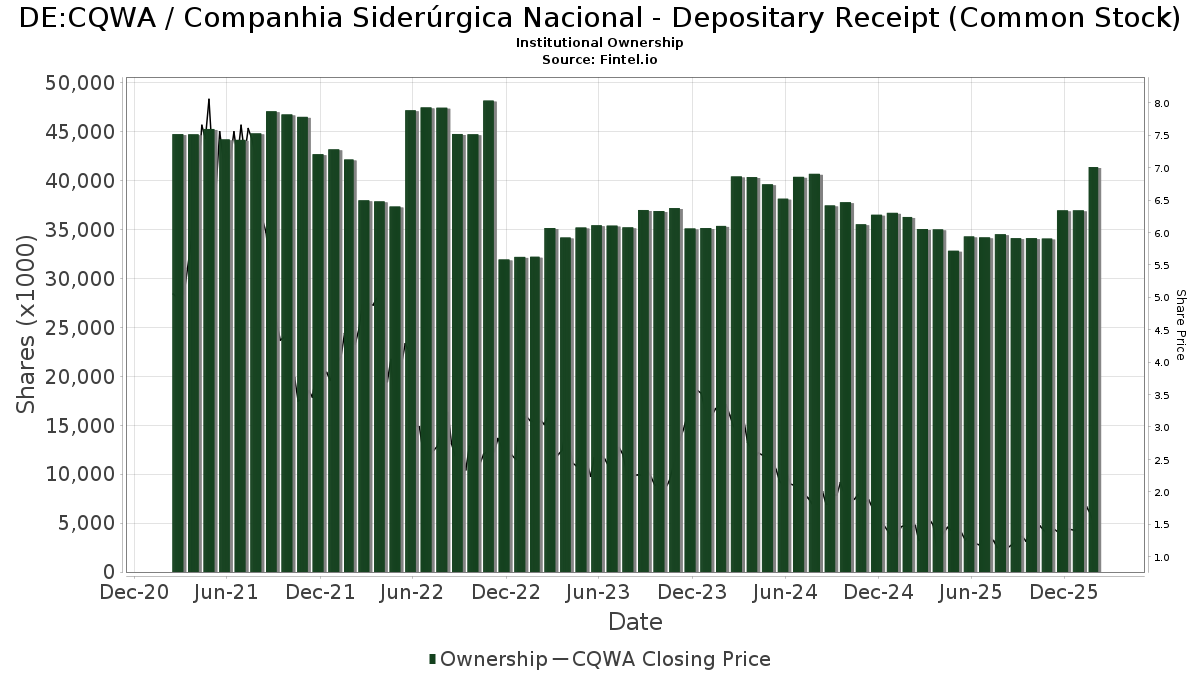
| Prezzo dell'azione | 1,42 |
| Allocazione media del portafoglio | 0.0076 % - change of -84,32% MRQ |
| Azioni istituzionali (Long) | 39.293.375 (ex 13D/G) - change of 1,43MM shares 3,78% MRQ |
| Valore istituzionale (Long) | $ 61.125 USD ($1000) |
Proprietà istituzionale e azionisti
Companhia Siderúrgica Nacional - Depositary Receipt (Common Stock) (DE:CQWA) ha 91 proprietari istituzionali e azionisti che hanno presentato i moduli 13D/G o 13F alla Securities Exchange Commission (SEC). Queste istituzioni detengono un totale di 39,293,375 azioni. I maggiori azionisti includono Vanguard Group Inc, Dimensional Fund Advisors Lp, Renaissance Technologies Llc, Millennium Management Llc, DFCEX - Emerging Markets Core Equity Portfolio - Institutional Class, American Century Companies Inc, Jane Street Group, Llc, VEIEX - Vanguard Emerging Markets Stock Index Fund Investor Shares, Citadel Advisors Llc, and Two Sigma Investments, Lp .
(Companhia Siderúrgica Nacional - Depositary Receipt (Common Stock) (DB:CQWA) la struttura proprietaria istituzionale mostra le attuali posizioni nella società da parte di istituzioni e fondi, nonché le ultime variazioni nella dimensione della posizione. I principali azionisti possono essere singoli investitori, fondi comuni, hedge fund o istituzioni. L'allegato 13D indica che l'investitore detiene (o ha detenuto) più del 5% della società e intende (o intendeva) perseguire attivamente un cambiamento nella strategia aziendale. L'allegato 13G indica un investimento passivo superiore al 5%.
The share price as of February 27, 2026 is 1,42 / share. Previously, on March 3, 2025, the share price was 1,32 / share. This represents an increase of 7,58% over that period.
Indice del sentiment dei fondi
L'indice del sentiment dei fondi (anche noto come "indice di accumulo di proprietà") individua i titoli più acquistati dai fondi. È il risultato di un sofisticato modello quantitativo multi-fattore che identifica le società con i più alti livelli di accumulo istituzionale. Il modello utilizza una combinazione dell'aumento totale dei proprietari dichiarati, delle variazioni nelle allocazioni di portafoglio di tali proprietari e di altre metriche. Il punteggio varia da 0 a 100: i numeri più alti indicano un livello di accumulo superiore ad altre società, mentre 50 rappresenta la media.
Frequenza di aggiornamento: giornaliera
Consulta Ownership Explorer per visualizzare l'elenco delle aziende con il ranking più alto.
AI+ Ask Fintel’s AI assistant about Companhia Siderúrgica Nacional - Depositary Receipt (Common Stock).
Select a question to share a public post with an AI-crafted answer.
Thinking of good questions…
Depositi 13F e NPORT
Le informazioni relative ai depositi 13F sono gratuite. Per accedere alle informazioni relative ai depositi NP è necessario un'abbonamento premium. Le righe verdi indicano le nuove posizioni. Le righe rosse indicano le posizioni chiuse. Fai clic sull'icona del link per visualizzare la cronologia completa delle transazioni.
Esegui l'upgrade
per sbloccare i dati premium ed esportarli in Excel ![]() .
.
| Data di deposito | Fonte | Investitore | Tipo | Prezzo medio (Stima) |
Azioni | Δ Azioni (%) |
Valore dichiarato ($ 1000) |
Δ Valore (%) |
Allocazione del portafoglio (%) |
|
|---|---|---|---|---|---|---|---|---|---|---|
| 2026-02-11 | 13F | Simplex Trading, Llc | 0 | -100,00 | 0 | |||||
| 2026-02-06 | 13F | Banque Cantonale Vaudoise | 800.000 | 1.280 | ||||||
| 2026-02-11 | 13F | Simplex Trading, Llc | Put | 0 | -100,00 | 0 | ||||
| 2025-11-06 | 13F | CAPROCK Group, Inc. | 0 | -100,00 | 0 | |||||
| 2026-01-26 | 13F | Mirae Asset Global Investments Co., Ltd. | 21.091 | 0,00 | 34 | 6,45 | ||||
| 2025-09-15 | 13F/A | Migdal Insurance & Financial Holdings Ltd. | 0 | -100,00 | 0 | |||||
| 2026-02-05 | 13F | Allworth Financial LP | 200 | 0,00 | 0 | |||||
| 2026-02-06 | 13F | Pnc Financial Services Group, Inc. | 4.002 | -55,70 | 6 | -53,85 | ||||
| 2025-11-14 | 13F | Wetherby Asset Management Inc | 0 | -100,00 | 0 | |||||
| 2026-02-11 | 13F | LPL Financial LLC | 21.368 | 34 | ||||||
| 2026-02-17 | 13F | Citadel Advisors Llc | Call | 33.000 | -2,37 | 53 | 4,00 | |||
| 2025-09-25 | NP | VGTSX - Vanguard Total International Stock Index Fund Investor Shares | 1.588.434 | 0,00 | 2.303 | -13,68 | ||||
| 2026-02-17 | 13F | Point72 Asset Management, L.P. | 164.746 | 264 | ||||||
| 2025-11-14 | 13F | Raymond James Financial Inc | 0 | -100,00 | 0 | |||||
| 2026-01-29 | 13F | UBS Group AG | 1.271.933 | -20,18 | 2.035 | -14,85 | ||||
| 2025-11-14 | 13F | Manufacturers Life Insurance Company, The | 0 | -100,00 | 0 | |||||
| 2026-02-13 | 13F | Ubs Asset Management Americas Inc | 1.946 | 3 | ||||||
| 2026-02-17 | 13F | Advisor Group Holdings, Inc. | 0 | -100,00 | 0 | |||||
| 2026-02-13 | 13F | Mariner, LLC | 14.506 | -5,26 | 23 | 4,55 | ||||
| 2026-02-13 | 13F | Inspire Advisors, LLC | 92.981 | -3,56 | 149 | 2,78 | ||||
| 2025-11-12 | 13F | Simplex Trading, Llc | Call | 0 | -100,00 | 0 | ||||
| 2026-02-06 | 13F | Plan A Wealth LLC | 36.975 | 10,63 | 59 | 18,00 | ||||
| 2026-01-26 | 13F | Cwm, Llc | 600 | 0,00 | 0 | |||||
| 2026-02-02 | 13F | Qrg Capital Management, Inc. | 0 | -100,00 | 0 | |||||
| 2026-02-17 | 13F | CWM Advisors, LLC | 53.683 | 9,03 | 86 | 16,44 | ||||
| 2026-02-13 | 13F | Marshall Wace, Llp | 580.998 | 930 | ||||||
| 2026-02-17 | 13F | Quadrature Capital Ltd | 286.586 | 179,74 | 459 | 199,35 | ||||
| 2025-09-25 | NP | DFA INVESTMENT DIMENSIONS GROUP INC - Emerging Markets Social Core Equity Portfolio Shares | 94.125 | -30,15 | 136 | -39,82 | ||||
| 2026-02-17 | 13F | Citadel Advisors Llc | 2.009.008 | -31,66 | 3.214 | -27,10 | ||||
| 2026-02-17 | 13F | Northern Trust Corp | 571.426 | 0,85 | 914 | 7,66 | ||||
| 2026-02-13 | 13F | Morgan Stanley | 1.639.146 | 754,93 | 2.623 | 813,59 | ||||
| 2026-02-13 | 13F | Caitong International Asset Management Co., Ltd | 12.564 | 227,96 | 20 | 300,00 | ||||
| 2026-02-17 | 13F | Scientech Research LLC | 0 | -100,00 | 0 | |||||
| 2026-02-12 | 13F | Insigneo Advisory Services, Llc | 22.260 | 1,18 | 36 | 6,06 | ||||
| 2026-02-11 | 13F | Group One Trading, L.p. | 0 | -100,00 | 0 | -100,00 | ||||
| 2026-02-10 | 13F | Bnp Paribas Arbitrage, Sa | 480.979 | -34,07 | 770 | -29,71 | ||||
| 2026-02-11 | 13F | Group One Trading, L.p. | Put | 52.000 | -88,96 | 83 | -88,24 | |||
| 2026-02-13 | 13F | Wells Fargo & Company/mn | 16.501 | 64,99 | 26 | 73,33 | ||||
| 2026-02-13 | 13F | Headlands Technologies LLC | 41.618 | 67 | ||||||
| 2026-02-11 | 13F | Group One Trading, L.p. | Call | 33.800 | -30,74 | 54 | -26,03 | |||
| 2026-02-13 | 13F/A | Virtus ETF Advisers LLC | 0 | -100,00 | 0 | |||||
| 2026-01-09 | 13F | SG Americas Securities, LLC | 99.565 | 346,36 | 0 | |||||
| 2026-02-13 | 13F | National Bank Of Canada /fi/ | 1.959 | 0,00 | 3 | 50,00 | ||||
| 2026-02-11 | 13F | Jpmorgan Chase & Co | 780.445 | 107.696,27 | 1.249 | 124.700,00 | ||||
| 2026-02-17 | 13F | Millennium Management Llc | 3.162.952 | -17,21 | 5.061 | -11,69 | ||||
| 2026-02-17 | 13F | D. E. Shaw & Co., Inc. | 149.566 | -35,76 | 239 | -31,52 | ||||
| 2026-02-17 | 13F | Stokes Family Office, LLC | 80.000 | 128 | ||||||
| 2026-02-12 | 13F | Renaissance Technologies Llc | 3.537.900 | 95,82 | 5.661 | 108,86 | ||||
| 2026-02-12 | 13F | BlackRock, Inc. | 364.053 | -85,28 | 582 | -84,30 | ||||
| 2026-02-17 | 13F | Susquehanna International Group, Llp | 147.307 | -32,56 | 236 | -28,13 | ||||
| 2026-02-13 | 13F | Squarepoint Ops LLC | 0 | -100,00 | 0 | -100,00 | ||||
| 2025-11-14 | 13F | Flow Traders U.s. Llc | 0 | -100,00 | 0 | |||||
| 2026-02-03 | 13F | SBI Securities Co., Ltd. | 6.940 | -39,96 | 11 | -35,29 | ||||
| 2026-02-17 | 13F | Jones Financial Companies Lllp | 1.687 | -5,86 | 3 | 0,00 | ||||
| 2026-01-15 | 13F | Lodestone Wealth Management LLC | 2.095 | 3 | ||||||
| 2026-02-18 | 13F | Vident Advisory, LLC | 17.747 | -36,49 | 28 | -31,71 | ||||
| 2026-02-19 | 13F | Invesco Ltd. | 176.581 | -18,59 | 283 | -13,23 | ||||
| 2026-02-10 | 13F | Goldman Sachs Group Inc | 1.516.407 | 706,63 | 2.426 | 763,35 | ||||
| 2026-02-13 | 13F | Van Eck Associates Corp | 459.455 | -82,29 | 1 | -100,00 | ||||
| 2025-11-13 | 13F | EntryPoint Capital, LLC | 0 | -100,00 | 0 | |||||
| 2026-02-17 | 13F | Qube Research & Technologies Ltd | 35.610 | 57 | ||||||
| 2026-02-13 | 13F | SPX Equities Gestao de Recursos Ltda | 3.107 | 5 | ||||||
| 2026-02-12 | 13F | Triumph Capital Management | 2.000 | 0,00 | 3 | 0,00 | ||||
| 2026-02-17 | 13F | Aquatic Capital Management LLC | 42.643 | 68 | ||||||
| 2025-09-25 | NP | VT - Vanguard Total World Stock Index Fund ETF Shares | 72.877 | 0,00 | 106 | -13,93 | ||||
| 2026-02-17 | 13F | XTX Topco Ltd | 743.512 | 306,83 | 1.190 | 333,94 | ||||
| 2025-11-12 | 13F | Steward Partners Investment Advisory, Llc | 0 | -100,00 | 0 | |||||
| 2026-02-12 | 13F | Dimensional Fund Advisors Lp | 3.587.062 | -0,62 | 5.745 | 6,06 | ||||
| 2026-02-04 | 13F | Argos Wealth Advisors, LLC | 10.762 | 17 | ||||||
| 2026-01-28 | 13F | Kapitalo Investimentos Ltda | 56.779 | 0,00 | 91 | 5,88 | ||||
| 2026-02-09 | 13F | Huntington National Bank | 1 | 0,00 | 0 | |||||
| 2026-02-10 | 13F | CIBC World Markets Inc. | 114.500 | 183 | ||||||
| 2026-02-12 | 13F | Barometer Capital Management Inc. | 0 | -100,00 | 0 | |||||
| 2026-02-17 | 13F | Brevan Howard Capital Management LP | 0 | -100,00 | 0 | |||||
| 2026-01-20 | 13F | Signaturefd, Llc | 1.865 | 0,00 | 3 | 0,00 | ||||
| 2025-11-13 | 13F | Hsbc Holdings Plc | 164.824 | 90,00 | 247 | 108,47 | ||||
| 2025-09-25 | NP | DFA INVESTMENT DIMENSIONS GROUP INC - World ex U.S. Core Equity Portfolio Institutional Class Shares | 0 | -100,00 | 0 | -100,00 | ||||
| 2026-01-23 | 13F | Farther Finance Advisors, LLC | 568 | -63,45 | 1 | -100,00 | ||||
| 2026-02-17 | 13F/A | RBF Capital, LLC | 0 | -100,00 | 0 | |||||
| 2026-02-13 | 13F | Citigroup Inc | 12.481 | -29,85 | 20 | -26,92 | ||||
| 2025-09-25 | NP | DFCEX - Emerging Markets Core Equity Portfolio - Institutional Class This fund is a listed as child fund of Dimensional Fund Advisors Lp and if that institution has disclosed ownership in this security, then these positions will not be double counted when calculating total shares and total value | 2.722.363 | 0,00 | 3.947 | -13,69 | ||||
| 2026-02-13 | 13F | VPR Management LLC | 55.740 | 0,00 | 89 | 7,23 | ||||
| 2026-02-13 | 13F | Mml Investors Services, Llc | 17.729 | 32,51 | 28 | 40,00 | ||||
| 2026-02-17 | 13F | Two Sigma Securities, Llc | 0 | -100,00 | 0 | |||||
| 2026-02-11 | 13F | Parallel Advisors, LLC | 3.010 | -30,16 | 5 | -33,33 | ||||
| 2026-02-17 | 13F | Two Sigma Investments, Lp | 1.935.866 | 449,82 | 3.097 | 486,55 | ||||
| 2026-02-17 | 13F | Susquehanna International Group, Llp | Call | 0 | -100,00 | 0 | ||||
| 2025-09-25 | NP | VEU - Vanguard FTSE All-World ex-US Index Fund ETF Shares | 509.830 | 0,00 | 739 | -13,67 | ||||
| 2025-11-20 | 13F | First Affirmative Financial Network | 34.464 | -10,22 | 52 | -3,77 | ||||
| 2026-02-12 | 13F | Federation des caisses Desjardins du Quebec | 0 | -100,00 | 0 | |||||
| 2026-01-30 | 13F | Us Bancorp \de\ | 5.310 | 0,00 | 8 | 14,29 | ||||
| 2026-02-17 | 13F | Optiver Holding B.V. | Put | 73.300 | 61,81 | 117 | 74,63 | |||
| 2026-02-17 | 13F | Citadel Advisors Llc | Put | 0 | -100,00 | 0 | ||||
| 2026-02-17 | 13F | Optiver Holding B.V. | Call | 1.000 | 2 | |||||
| 2026-01-23 | 13F | Assetmark, Inc | 2.223 | -12,65 | 4 | 0,00 | ||||
| 2026-02-13 | 13F | Barclays Plc | 4.817 | -97,90 | 8 | -97,97 | ||||
| 2026-02-06 | 13F | EverSource Wealth Advisors, LLC | 948 | 178,82 | 2 | |||||
| 2026-02-13 | 13F | American Century Companies Inc | 2.546.337 | 15,64 | 4.074 | 23,38 | ||||
| 2025-11-14 | 13F | Tower Research Capital LLC (TRC) | 0 | -100,00 | 0 | |||||
| 2026-01-29 | 13F | Vanguard Group Inc | 4.804.030 | 0,00 | 7.686 | 6,66 | ||||
| 2026-02-17 | 13F | Fmr Llc | 7.901 | -38,50 | 13 | -36,84 | ||||
| 2026-02-19 | 13F | CI Private Wealth, LLC | 11.350 | -19,95 | 18 | -14,29 | ||||
| 2026-02-13 | 13F | Aigen Investment Management, Lp | 0 | -100,00 | 0 | |||||
| 2026-02-12 | 13F | Jane Street Group, Llc | 2.539.989 | 365,82 | 4.064 | 396,82 | ||||
| 2026-02-12 | 13F | Jane Street Group, Llc | Put | 18.700 | 30 | |||||
| 2026-02-12 | 13F | Jane Street Group, Llc | Call | 25.500 | 41 | |||||
| 2025-11-14 | 13F | Graham Capital Management, L.P. | 0 | -100,00 | 0 | |||||
| 2025-10-27 | 13F | Kiker Wealth Management, LLC | 0 | -100,00 | 0 | |||||
| 2026-02-18 | 13F | Garton & Associates Financial Advisors LLC | 3.169 | 5 | ||||||
| 2026-01-30 | 13F | R Squared Ltd | 32.755 | 13,78 | 52 | 20,93 | ||||
| 2025-09-25 | NP | Dimensional Emerging Markets Value Fund - Dimensional Emerging Markets Value Fund This fund is a listed as child fund of Dimensional Fund Advisors Lp and if that institution has disclosed ownership in this security, then these positions will not be double counted when calculating total shares and total value | 343.097 | -4,84 | 497 | -17,85 | ||||
| 2026-02-13 | 13F | State Street Corp | 1.649.847 | 7,06 | 2.768 | 13,49 | ||||
| 2026-02-17 | 13F | Royal Bank Of Canada | 39 | 0,00 | 0 | |||||
| 2026-02-12 | 13F | Advisors Asset Management, Inc. | 116.350 | -8,33 | 186 | -2,11 | ||||
| 2025-11-06 | 13F | Johnson Investment Counsel Inc | 0 | -100,00 | 0 | |||||
| 2026-02-17 | 13F | Guggenheim Capital Llc | 59.804 | -7,36 | 96 | -1,04 | ||||
| 2026-02-17 | 13F | Voleon Capital Management Lp | 33.648 | 54 | ||||||
| 2025-09-25 | NP | VEIEX - Vanguard Emerging Markets Stock Index Fund Investor Shares | 2.211.796 | 0,00 | 3.207 | -13,67 | ||||
| 2026-02-17 | 13F | Bank Of America Corp /de/ | 743.469 | 11,87 | 1.190 | 19,38 | ||||
| 2025-09-25 | NP | DFAX - Dimensional World ex U.S. Core Equity 2 ETF | 165.744 | 0,00 | 240 | -13,67 | ||||
| 2026-01-05 | 13F | GAMMA Investing LLC | 3.723 | 4,46 | 6 | 0,00 | ||||
| 2025-11-06 | 13F | Ameritas Advisory Services, LLC | 0 | -100,00 | 0 | |||||
| 2026-02-13 | 13F | Rhumbline Advisers | 795 | -86,05 | 1 | -87,50 | ||||
| 2026-02-12 | 13F | Hrt Financial Lp | 564.262 | 175,35 | 1 | |||||
| 2026-02-13 | 13F | JustInvest LLC | 29.550 | 14,23 | 47 | 23,68 | ||||
| 2025-11-10 | 13F | MAI Capital Management | 0 | -100,00 | 0 | |||||
| 2026-02-17 | 13F | Two Sigma Advisers, Lp | 493.300 | 789 | ||||||
| 2026-01-14 | 13F | Jfs Wealth Advisors, Llc | 1.716 | 0,00 | 3 | 0,00 |
Other Listings
| US:SID | 1,68 USD |