Statistiche di base
| Azioni istituzionali (Long) | 23.680.153 - 33,42% (ex 13D/G) - change of -3,44MM shares -12,68% MRQ |
| Valore istituzionale (Long) | $ 273.418 USD ($1000) |
Proprietà istituzionale e azionisti
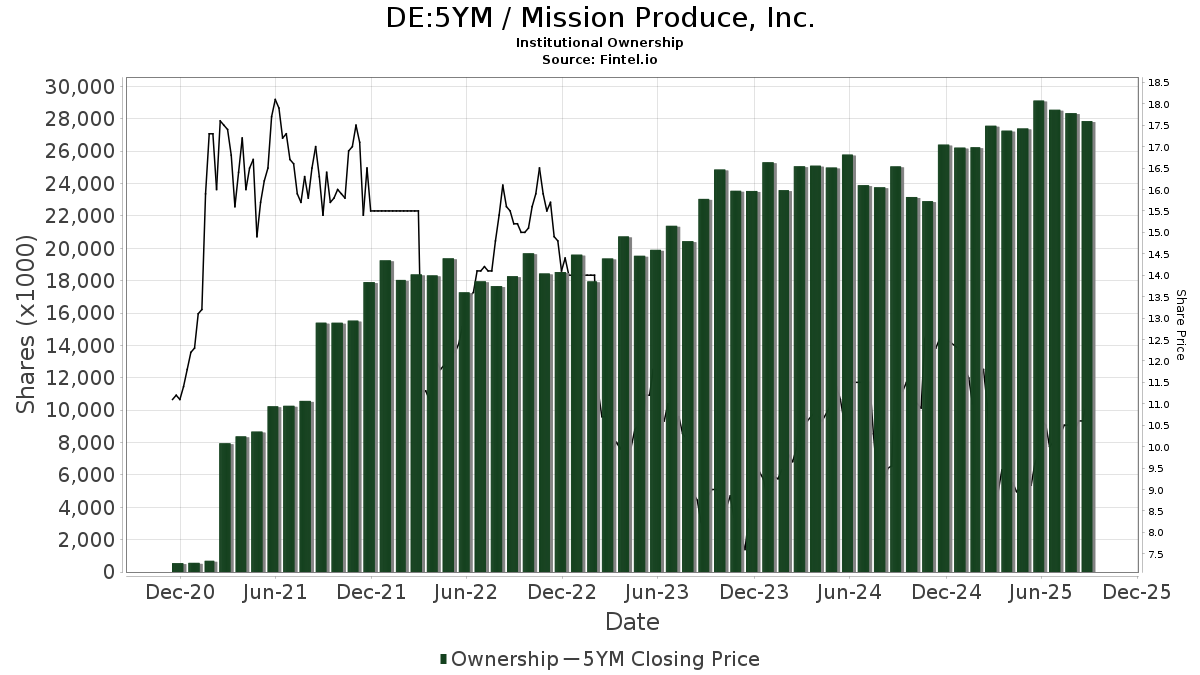
Mission Produce, Inc. (DE:5YM) ha 155 proprietari istituzionali e azionisti che hanno presentato i moduli 13D/G o 13F alla Securities Exchange Commission (SEC). Queste istituzioni detengono un totale di 23,680,153 azioni. I maggiori azionisti includono BlackRock, Inc., Vanguard Group Inc, Dimensional Fund Advisors Lp, American Century Companies Inc, State Street Corp, Geode Capital Management, Llc, Platform Wealth Management, LLC, Integrated Advisors Network LLC, Walnut Level Capital LLC, and Qube Research & Technologies Ltd .
(Mission Produce, Inc. (DB:5YM) la struttura proprietaria istituzionale mostra le attuali posizioni nella società da parte di istituzioni e fondi, nonché le ultime variazioni nella dimensione della posizione. I principali azionisti possono essere singoli investitori, fondi comuni, hedge fund o istituzioni. L'allegato 13D indica che l'investitore detiene (o ha detenuto) più del 5% della società e intende (o intendeva) perseguire attivamente un cambiamento nella strategia aziendale. L'allegato 13G indica un investimento passivo superiore al 5%.
The share price as of April 2, 2026 is 11,60 / share. Previously, on April 7, 2025, the share price was 8,75 / share. This represents an increase of 32,57% over that period.
Indice del sentiment dei fondi
L'indice del sentiment dei fondi (anche noto come "indice di accumulo di proprietà") individua i titoli più acquistati dai fondi. È il risultato di un sofisticato modello quantitativo multi-fattore che identifica le società con i più alti livelli di accumulo istituzionale. Il modello utilizza una combinazione dell'aumento totale dei proprietari dichiarati, delle variazioni nelle allocazioni di portafoglio di tali proprietari e di altre metriche. Il punteggio varia da 0 a 100: i numeri più alti indicano un livello di accumulo superiore ad altre società, mentre 50 rappresenta la media.
Frequenza di aggiornamento: giornaliera
Consulta Ownership Explorer per visualizzare l'elenco delle aziende con il ranking più alto.
AI+ Ask Fintel’s AI assistant about Mission Produce, Inc..
Select a question to share a public post with an AI-crafted answer.
Thinking of good questions…
Depositi 13F e NPORT
Le informazioni relative ai depositi 13F sono gratuite. Per accedere alle informazioni relative ai depositi NP è necessario un'abbonamento premium. Le righe verdi indicano le nuove posizioni. Le righe rosse indicano le posizioni chiuse. Fai clic sull'icona del link per visualizzare la cronologia completa delle transazioni.
Esegui l'upgrade
per sbloccare i dati premium ed esportarli in Excel ![]() .
.
| Data di deposito | Fonte | Investitore | Tipo | Prezzo medio (Stima) |
Azioni | Δ Azioni (%) |
Valore dichiarato ($ 1000) |
Δ Valore (%) |
Allocazione del portafoglio (%) |
|
|---|---|---|---|---|---|---|---|---|---|---|
| 2026-02-17 | 13F | Brevan Howard Capital Management LP | 0 | -100,00 | 0 | |||||
| 2026-02-12 | 13F | State Board Of Administration Of Florida Retirement System | 13.860 | 0,00 | 161 | -3,61 | ||||
| 2026-02-13 | 13F | Sterling Capital Management LLC | 2.460 | -16,44 | 29 | -20,00 | ||||
| 2026-03-06 | 13F | Hsbc Holdings Plc | 44.961 | 191,61 | 520 | 182,07 | ||||
| 2026-02-12 | 13F | New York State Common Retirement Fund | 9.509 | 0,00 | 110 | -3,51 | ||||
| 2026-02-23 | 13F | Virtu Financial LLC | 11.459 | 0 | ||||||
| 2026-01-05 | 13F | GAMMA Investing LLC | 4.589 | 87,08 | 53 | 82,76 | ||||
| 2026-01-23 | 13F | State of Alaska, Department of Revenue | 3.223 | 15,81 | 0 | |||||
| 2026-02-17 | 13F | Advisor Group Holdings, Inc. | 1.408 | -12,66 | 16 | -15,79 | ||||
| 2026-02-10 | 13F | Bnp Paribas Arbitrage, Sa | 123.715 | 941,64 | 1.435 | 910,56 | ||||
| 2026-02-13 | 13F | Quarry LP | 2.577 | 6,27 | 30 | 0,00 | ||||
| 2026-02-09 | 13F | Geode Capital Management, Llc | 1.048.598 | 0,36 | 12.166 | -3,15 | ||||
| 2026-01-14 | 13F | Spire Wealth Management | 400 | 0,00 | 5 | 0,00 | ||||
| 2026-02-12 | 13F | Campbell & CO Investment Adviser LLC | 35.795 | 47,11 | 415 | 42,12 | ||||
| 2026-02-13 | 13F | Ubs Asset Management Americas Inc | 137.101 | -1,62 | 1.590 | -5,07 | ||||
| 2026-01-28 | 13F | Teacher Retirement System Of Texas | 47.142 | -35,58 | 547 | -37,88 | ||||
| 2026-02-12 | 13F | JPL Wealth Management, LLC | 0 | -100,00 | 0 | |||||
| 2026-02-05 | 13F | Atria Investments Llc | 30.993 | 8,28 | 360 | 4,36 | ||||
| 2026-02-12 | 13F | Jane Street Group, Llc | Call | 41.400 | 480 | |||||
| 2026-02-12 | 13F | Jane Street Group, Llc | 213.147 | -9,71 | 2.473 | -12,87 | ||||
| 2025-10-15 | 13F | Harbor Capital Advisors, Inc. | 0 | -100,00 | 0 | |||||
| 2026-02-02 | 13F | Principal Financial Group Inc | 28.071 | 38,55 | 326 | 33,74 | ||||
| 2026-02-06 | 13F | IFP Advisors, Inc | 6 | 0,00 | 0 | |||||
| 2026-02-17 | 13F | MIRAE ASSET GLOBAL ETFS HOLDINGS Ltd. | 19.831 | 0,04 | 230 | -3,36 | ||||
| 2026-02-10 | 13F | Rothschild Investment Llc | 40 | 0,00 | 0 | |||||
| 2026-02-12 | 13F | Quadrant Capital Group Llc | 2.492 | 0,00 | 29 | -3,45 | ||||
| 2026-02-17 | 13F | Two Sigma Investments, Lp | 12.319 | 143 | ||||||
| 2026-01-30 | 13F | Turning Point Benefit Group, Inc. | 9 | 0,00 | 0 | |||||
| 2026-02-12 | 13F | Skopos Labs, Inc. | 0 | -100,00 | 0 | |||||
| 2026-02-10 | 13F | Bank of New York Mellon Corp | 167.404 | 2,71 | 1.942 | -0,92 | ||||
| 2026-02-11 | 13F | Nuance Investments, Llc | 491.807 | 10,70 | 5.705 | 6,82 | ||||
| 2026-02-17 | 13F | Zacks Investment Management | 18.592 | 216 | ||||||
| 2026-02-12 | 13F | MetLife Investment Management, LLC | 28.882 | 0,00 | 335 | -3,46 | ||||
| 2026-02-13 | 13F | Fourth Sail Capital LP | 62.525 | 725 | ||||||
| 2025-11-03 | 13F | Federated Hermes, Inc. | 0 | -100,00 | 0 | |||||
| 2026-02-11 | 13F | Parallel Advisors, LLC | 148 | 0,00 | 2 | 0,00 | ||||
| 2026-02-11 | 13F | LPL Financial LLC | 39.178 | -5,73 | 454 | -9,02 | ||||
| 2026-02-13 | 13F | Martingale Asset Management L P | 73.883 | -0,57 | 857 | -4,03 | ||||
| 2026-01-29 | 13F | Vanguard Group Inc | 2.871.240 | -0,36 | 33.306 | -3,84 | ||||
| 2026-02-10 | 13F | Connor, Clark & Lunn Investment Management Ltd. | 128.550 | -42,45 | 1.491 | -44,45 | ||||
| 2026-02-17 | 13F | Canada Pension Plan Investment Board | 12.600 | 146 | ||||||
| 2026-02-17 | 13F | Susquehanna Portfolio Strategies, LLC | 49.643 | -37,11 | 576 | -39,35 | ||||
| 2026-01-08 | 13F | True Wealth Design, LLC | 29 | 31,82 | 0 | |||||
| 2026-02-09 | 13F | Quest Partners LLC | 13.214 | 183,44 | 153 | 173,21 | ||||
| 2026-02-17 | 13F/A | RBF Capital, LLC | 74.410 | 0,00 | 863 | -3,47 | ||||
| 2026-02-13 | 13F | Parkside Financial Bank & Trust | 45 | 0,00 | 1 | |||||
| 2026-02-13 | 13F | Marshall Wace, Llp | 77.232 | 896 | ||||||
| 2026-01-23 | 13F | Farther Finance Advisors, LLC | 588 | 10,53 | 7 | 0,00 | ||||
| 2026-02-06 | 13F | Global Retirement Partners, LLC | 173 | 2 | ||||||
| 2026-02-13 | 13F | Prudential Financial Inc | 74.315 | -61,13 | 862 | -62,49 | ||||
| 2026-02-17 | 13F | Algert Global Llc | 42.493 | -61,95 | 0 | -100,00 | ||||
| 2026-02-13 | 13F | National Bank Of Canada /fi/ | 8 | 0 | ||||||
| 2026-02-17 | 13F | Prelude Capital Management, Llc | 18.666 | -10,59 | 217 | -13,60 | ||||
| 2025-10-09 | 13F | Voya Investment Management Llc | 0 | -100,00 | 0 | |||||
| 2026-02-12 | 13F | Swiss National Bank | 90.500 | 10,23 | 1.050 | 6,39 | ||||
| 2026-02-17 | 13F | Optiver Holding B.V. | 0 | -100,00 | 0 | |||||
| 2026-02-11 | 13F | Los Angeles Capital Management Llc | 123.099 | -13,92 | 1.409 | -18,03 | ||||
| 2026-01-08 | 13F | Sanders Morris Harris Llc | 0 | -100,00 | 0 | |||||
| 2026-02-17 | 13F | Trexquant Investment LP | 46.379 | -56,46 | 538 | -58,05 | ||||
| 2026-02-06 | 13F | Leonteq Securities AG | 2.704 | 0,00 | 31 | -3,12 | ||||
| 2026-02-17 | 13F | Raymond James Financial Inc | 12.884 | -15,16 | 149 | -18,13 | ||||
| 2026-02-13 | 13F | Dynamic Technology Lab Private Ltd | 0 | -100,00 | 0 | |||||
| 2026-02-19 | 13F | Invesco Ltd. | 81.206 | -9,13 | 942 | -12,38 | ||||
| 2026-01-29 | 13F | Comerica Bank | 30.724 | 0,37 | 356 | -3,00 | ||||
| 2026-02-13 | 13F | Rhumbline Advisers | 59.513 | -16,39 | 690 | -19,30 | ||||
| 2026-02-10 | 13F | Quantbot Technologies LP | 0 | -100,00 | 0 | |||||
| 2026-01-29 | 13F | UBS Group AG | 247.826 | 18,60 | 2.875 | 14,46 | ||||
| 2026-02-17 | 13F | XTX Topco Ltd | 19.259 | -9,68 | 223 | -12,89 | ||||
| 2026-02-12 | 13F | Commonwealth Equity Services, Llc | 404.256 | -0,94 | 4.689 | 117.125,00 | ||||
| 2026-02-17 | 13F | Point72 Asset Management, L.P. | 45.108 | 523 | ||||||
| 2026-02-17 | 13F | Magnetar Financial LLC | 43.969 | 263,20 | 510 | 251,72 | ||||
| 2026-02-11 | 13F | Group One Trading, L.p. | 1.800 | -30,77 | 21 | -35,48 | ||||
| 2026-02-12 | 13F | EntryPoint Capital, LLC | 22.737 | 264 | ||||||
| 2026-02-09 | 13F | Legal & General Group Plc | 42.294 | 23,19 | 491 | 18,93 | ||||
| 2026-01-26 | 13F | Whittier Trust Co | 0 | -100,00 | 0 | |||||
| 2026-02-17 | 13F | California State Teachers Retirement System | 43.187 | -27,77 | 501 | -30,36 | ||||
| 2026-02-10 | 13F | Goldman Sachs Group Inc | 510.340 | 26,88 | 5.920 | 22,45 | ||||
| 2025-11-14 | 13F | Polymer Capital Management (US) LLC | 0 | -100,00 | 0 | |||||
| 2026-02-17 | 13F | Jones Financial Companies Lllp | 100 | -20,00 | 1 | 0,00 | ||||
| 2026-01-20 | 13F | Signaturefd, Llc | 608 | 0,00 | 7 | 0,00 | ||||
| 2026-01-30 | 13F | Us Bancorp \de\ | 590 | 0,00 | 7 | -14,29 | ||||
| 2026-01-23 | 13F | Avion Wealth | 107 | 0,00 | 0 | |||||
| 2026-02-13 | 13F | Smartleaf Asset Management LLC | 399 | 167,79 | 5 | 300,00 | ||||
| 2026-02-17 | 13F | CWM Advisors, LLC | 40.562 | 7,15 | 471 | 3,30 | ||||
| 2025-11-14 | 13F | Walleye Capital LLC | 0 | -100,00 | 0 | |||||
| 2026-02-12 | 13F | Steward Partners Investment Advisory, Llc | 99 | 0,00 | 1 | 0,00 | ||||
| 2026-02-13 | 13F | Verition Fund Management LLC | 24.940 | 49,82 | 289 | 44,50 | ||||
| 2026-01-28 | 13F | Arizona State Retirement System | 12.754 | 1,80 | 148 | -2,00 | ||||
| 2026-02-17 | 13F | Balyasny Asset Management Llc | 18.067 | 210 | ||||||
| 2026-02-13 | 13F | American Century Companies Inc | 1.097.953 | 9,31 | 12.736 | 5,49 | ||||
| 2026-01-14 | 13F | Wedge Capital Management L L P/nc | 100.025 | 0,97 | 1.160 | -2,52 | ||||
| 2026-02-17 | 13F | Aqr Capital Management Llc | 43.646 | 5,13 | 506 | 1,40 | ||||
| 2026-02-13 | 13F | Charles Schwab Investment Management Inc | 351.196 | -0,11 | 4.074 | -3,62 | ||||
| 2026-02-13 | 13F | Virtus ETF Advisers LLC | 7.903 | 0,00 | 92 | -3,19 | ||||
| 2026-02-13 | 13F | Morgan Stanley | 270.491 | -8,10 | 3.138 | -11,31 | ||||
| 2026-02-13 | 13F | Mariner, LLC | 27.925 | 55,24 | 324 | 49,54 | ||||
| 2026-02-12 | 13F | Renaissance Technologies Llc | 104.800 | -67,85 | 1.216 | -68,99 | ||||
| 2026-02-18 | 13F | Mackenzie Financial Corp | 0 | -100,00 | 0 | |||||
| 2026-02-02 | 13F | Hussman Strategic Advisors, Inc. | 0 | -100,00 | 0 | |||||
| 2026-02-17 | 13F | Susquehanna Fundamental Investments, Llc | 12.244 | 0,00 | 142 | -3,40 | ||||
| 2026-02-17 | 13F | PharVision Advisers, LLC | 35.560 | 103,75 | 412 | 97,13 | ||||
| 2026-02-17 | 13F | Walnut Level Capital LLC | Call | 0 | -100,00 | 0 | ||||
| 2026-01-09 | 13F | SG Americas Securities, LLC | 26.549 | 14,31 | 0 | |||||
| 2026-01-26 | 13F | Cwm, Llc | 1.409 | -2,02 | 0 | |||||
| 2026-02-17 | 13F | Man Group plc | 0 | -100,00 | 0 | |||||
| 2026-02-17 | 13F | Quadrature Capital Ltd | 23.871 | 277 | ||||||
| 2026-02-17 | 13F | Citadel Advisors Llc | 75.011 | -59,94 | 870 | -61,33 | ||||
| 2026-02-12 | 13F | Davy Global Fund Management Ltd | 71.163 | -10,76 | 825 | -13,88 | ||||
| 2025-10-24 | 13F | New York State Teachers Retirement System | 0 | -100,00 | 0 | |||||
| 2026-02-17 | 13F | D. E. Shaw & Co., Inc. | 187.594 | -4,19 | 2.176 | -7,52 | ||||
| 2026-02-09 | 13F | Penn Capital Management Co Inc | 0 | -100,00 | 0 | |||||
| 2026-02-17 | 13F | Citadel Advisors Llc | Call | 31.400 | -20,10 | 364 | -22,88 | |||
| 2026-02-17 | 13F | Bank Of America Corp /de/ | 48.848 | 47,43 | 567 | 42,21 | ||||
| 2026-02-11 | 13F | Jpmorgan Chase & Co | 17.411 | -1,58 | 202 | -5,19 | ||||
| 2026-02-14 | 13F | Rockefeller Capital Management L.P. | 267 | 0,00 | 3 | 0,00 | ||||
| 2026-02-06 | 13F | Covestor Ltd | 111 | -11,90 | 0 | |||||
| 2026-02-10 | 13F | State of Wyoming | 0 | -100,00 | 0 | |||||
| 2026-02-12 | 13F | Cutler Investment Counsel Llc | 211.750 | -0,47 | 2.456 | -3,95 | ||||
| 2026-02-17 | 13F | Price T Rowe Associates Inc /md/ | 25.502 | 13,40 | 0 | |||||
| 2026-01-27 | 13F | Zurcher Kantonalbank (Zurich Cantonalbank) | 16.964 | 197 | ||||||
| 2026-02-17 | 13F | Susquehanna International Group, Llp | Call | 117.300 | 501,54 | 1.361 | 481,20 | |||
| 2026-02-10 | 13F | Intech Investment Management Llc | 18.077 | -13,57 | 210 | -16,73 | ||||
| 2026-02-13 | 13F | State Street Corp | 1.050.899 | -4,73 | 12.190 | -8,06 | ||||
| 2026-01-28 | 13F | Universal- Beteiligungs- und Servicegesellschaft mbH | 15.634 | 1,68 | 181 | -1,63 | ||||
| 2026-02-17 | 13F | Alliancebernstein L.p. | 43.190 | 0,01 | 501 | -3,47 | ||||
| 2026-02-06 | 13F | Pnc Financial Services Group, Inc. | 277 | 0,00 | 3 | 0,00 | ||||
| 2026-02-17 | 13F | Janus Henderson Group Plc | 18.210 | 0,00 | 211 | -3,21 | ||||
| 2026-02-11 | 13F | Fox Run Management, L.l.c. | 20.152 | 234 | ||||||
| 2026-02-13 | 13F | Wells Fargo & Company/mn | 63.538 | 31,25 | 737 | 26,85 | ||||
| 2026-01-29 | 13F | Cornerstone Investment Partners, LLC | 13.312 | 0,06 | 154 | -3,14 | ||||
| 2025-11-14 | 13F | Wolverine Trading, Llc | 12.105 | 144 | ||||||
| 2026-01-09 | 13F | Diversified Trust Co | 17.299 | 14,19 | 201 | 9,89 | ||||
| 2026-02-11 | 13F | Franklin Resources Inc | 28.254 | 0,00 | 328 | -3,54 | ||||
| 2026-02-17 | 13F | Ameriprise Financial Inc | 20.066 | 233 | ||||||
| 2026-02-17 | 13F | Oxford Asset Management Llp | 45.122 | 523 | ||||||
| 2026-02-17 | 13F | Quantinno Capital Management LP | 67.343 | 22,21 | 781 | 17,98 | ||||
| 2026-02-11 | 13F | Deutsche Bank Ag\ | 42.128 | 7,38 | 489 | 3,61 | ||||
| 2026-02-13 | 13F | Police & Firemen's Retirement System of New Jersey | 12.198 | 0,00 | 141 | -3,42 | ||||
| 2026-02-17 | 13F | Walnut Level Capital LLC | 790.381 | -26,52 | 9.168 | -29,08 | ||||
| 2025-11-14 | 13F | Aquatic Capital Management LLC | 0 | -100,00 | 0 | |||||
| 2026-02-05 | 13F | Amalgamated Bank | 1.341 | -19,07 | 0 | |||||
| 2026-02-13 | 13F | Panagora Asset Management Inc | 77.860 | 2,84 | 903 | -0,77 | ||||
| 2026-02-17 | 13F | Russell Investments Group, Ltd. | 4.957 | -9,30 | 58 | -12,31 | ||||
| 2026-02-17 | 13F | State Of Wisconsin Investment Board | 45.348 | -3,57 | 526 | -6,90 | ||||
| 2026-02-12 | 13F | Dimensional Fund Advisors Lp | 2.689.681 | 4,62 | 31.200 | 0,97 | ||||
| 2026-02-17 | 13F | Gallagher Fiduciary Advisors, LLC | 30.884 | 7,53 | 358 | 3,77 | ||||
| 2026-02-06 | 13F | EverSource Wealth Advisors, LLC | 1.026 | -7,90 | 12 | -15,38 | ||||
| 2025-10-17 | 13F | Ethic Inc. | 0 | -100,00 | 0 | -100,00 | ||||
| 2026-02-11 | 13F | Cerity Partners LLC | 76.975 | 893 | ||||||
| 2026-02-17 | 13F | Qube Research & Technologies Ltd | 534.758 | 56,24 | 6.203 | 50,78 | ||||
| 2026-01-29 | 13F | Inscription Capital, LLC | 10.404 | 1,19 | 121 | -2,44 | ||||
| 2026-02-13 | 13F | Barclays Plc | 80.858 | 20,52 | 938 | 8,95 | ||||
| 2026-02-17 | 13F | Public Employees Retirement System Of Ohio | 7.035 | 465,97 | 82 | 478,57 | ||||
| 2026-01-08 | 13F | Versant Capital Management, Inc | 1.645 | 8,08 | 19 | 5,56 | ||||
| 2026-02-17 | 13F | Royal Bank Of Canada | 1.403 | -49,06 | 16 | -51,52 | ||||
| 2026-02-12 | 13F | Nuveen, LLC | 83.930 | -4,90 | 974 | -8,21 | ||||
| 2026-02-11 | 13F | Ameritas Investment Partners, Inc. | 3.565 | 41 | ||||||
| 2026-02-17 | 13F | Fmr Llc | 3.818 | -16,16 | 44 | -18,52 | ||||
| 2026-01-15 | 13F | Nisa Investment Advisors, Llc | 744 | -36,25 | 9 | -42,86 | ||||
| 2026-02-17 | 13F | Susquehanna International Group, Llp | 0 | -100,00 | 0 | |||||
| 2026-02-10 | 13F | Platform Wealth Management, LLC | 1.045.703 | 12.130 | ||||||
| 2025-11-07 | 13F | BNP Paribas Asset Management Holding S.A. | 0 | -100,00 | 0 | |||||
| 2026-02-17 | 13F | Lazard Asset Management Llc | 165.861 | -26,53 | 1.924 | -29,12 | ||||
| 2026-02-13 | 13F | Citigroup Inc | 6.085 | -1,81 | 71 | -5,41 | ||||
| 2026-01-28 | 13F | Klp Kapitalforvaltning As | 9.800 | -20,97 | 114 | -24,16 | ||||
| 2026-02-12 | 13F | BlackRock, Inc. | 3.623.423 | 1,62 | 42.032 | -1,93 | ||||
| 2026-02-13 | 13F | Arrowstreet Capital, Limited Partnership | 436.993 | 19,09 | 5.069 | 14,94 | ||||
| 2026-02-13 | 13F | Jacobs Levy Equity Management, Inc | 108.259 | 107,00 | 1.256 | 99,84 | ||||
| 2026-02-17 | 13F | Integrated Advisors Network LLC | 816.040 | -2,97 | 9.466 | -6,36 | ||||
| 2026-02-17 | 13F | Aster Capital Management (DIFC) Ltd | 0 | -100,00 | 0 | |||||
| 2026-02-10 | 13F | Lido Advisors, LLC | 272.167 | 0,00 | 3.271 | 0,00 | ||||
| 2026-02-17 | 13F | Millennium Management Llc | 75.580 | -26,89 | 877 | -29,47 | ||||
| 2026-02-17 | 13F | Northern Trust Corp | 367.436 | -7,66 | 4.262 | -10,89 | ||||
| 2026-02-13 | 13F | SRS Capital Advisors, Inc. | 10 | -98,83 | 0 | -100,00 | ||||
| 2026-02-17 | 13F | Creative Planning | 25.714 | 72,28 | 298 | 66,48 | ||||
| 2026-01-26 | 13F | Whittier Trust Co Of Nevada Inc | 1.000 | 0,00 | 12 | -8,33 | ||||
| 2026-02-11 | 13F | Simplex Trading, Llc | 766 | -64,64 | 9 | |||||
| 2026-02-03 | 13F | Costello Asset Management, INC | 708 | 0,00 | 8 | 0,00 | ||||
| 2026-02-17 | 13F | Tower Research Capital LLC (TRC) | 3.061 | -19,40 | 36 | -22,22 | ||||
| 2026-02-13 | 13F | Manufacturers Life Insurance Company, The | 0 | -100,00 | 0 | |||||
| 2026-02-12 | 13F | Advisors Asset Management, Inc. | 63.087 | 3,76 | 732 | 0,14 | ||||
| 2026-02-17 | 13F | Citadel Advisors Llc | Put | 0 | -100,00 | 0 | ||||
| 2026-01-23 | 13F | Assetmark, Inc | 149 | 0,00 | 2 | 0,00 | ||||
| 2026-02-05 | 13F | Allworth Financial LP | 360 | 9,76 | 4 | 33,33 |
Other Listings
| US:AVO | 14,44 USD |