Statistiche di base
| Azioni istituzionali (Long) | 43.803.404 - 25,34% (ex 13D/G) - change of -2,86MM shares -6,13% MRQ |
| Valore istituzionale (Long) | $ 25.800 USD ($1000) |
Proprietà istituzionale e azionisti
BARK, Inc. (US:BARK) ha 114 proprietari istituzionali e azionisti che hanno presentato i moduli 13D/G o 13F alla Securities Exchange Commission (SEC). Queste istituzioni detengono un totale di 43,803,404 azioni. I maggiori azionisti includono Vanguard Group Inc, BlackRock, Inc., Shay Capital LLC, Prescott Group Capital Management, L.l.c., Geode Capital Management, Llc, State Street Corp, Nano Cap New Millennium Growth Fund L P, Arrowstreet Capital, Limited Partnership, Susquehanna International Group, Llp, and FSSNX - Fidelity Small Cap Index Fund .
(BARK, Inc. (NYSE:BARK) la struttura proprietaria istituzionale mostra le attuali posizioni nella società da parte di istituzioni e fondi, nonché le ultime variazioni nella dimensione della posizione. I principali azionisti possono essere singoli investitori, fondi comuni, hedge fund o istituzioni. L'allegato 13D indica che l'investitore detiene (o ha detenuto) più del 5% della società e intende (o intendeva) perseguire attivamente un cambiamento nella strategia aziendale. L'allegato 13G indica un investimento passivo superiore al 5%.
The share price as of March 20, 2026 is 0,66 / share. Previously, on March 24, 2025, the share price was 1,41 / share. This represents a decline of 53,45% over that period.

Indice del sentiment dei fondi
L'indice del sentiment dei fondi (anche noto come "indice di accumulo di proprietà") individua i titoli più acquistati dai fondi. È il risultato di un sofisticato modello quantitativo multi-fattore che identifica le società con i più alti livelli di accumulo istituzionale. Il modello utilizza una combinazione dell'aumento totale dei proprietari dichiarati, delle variazioni nelle allocazioni di portafoglio di tali proprietari e di altre metriche. Il punteggio varia da 0 a 100: i numeri più alti indicano un livello di accumulo superiore ad altre società, mentre 50 rappresenta la media.
Frequenza di aggiornamento: giornaliera
Consulta Ownership Explorer per visualizzare l'elenco delle aziende con il ranking più alto.
AI+ Ask Fintel’s AI assistant about BARK, Inc..
Select a question to share a public post with an AI-crafted answer.
Thinking of good questions…
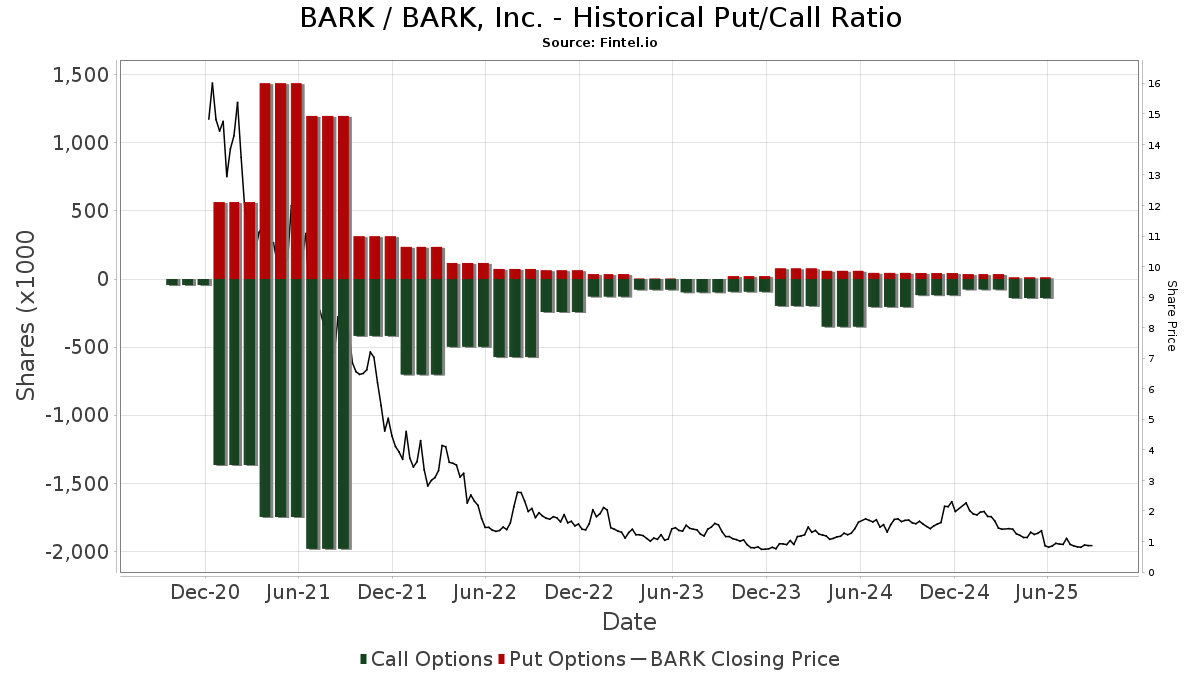
Rapporto put/call istituzionale
Oltre a segnalare le emissioni standard di titoli azionari e di debito, gli istituti con più di 100 milioni di asset in gestione devono anche dichiarare le loro partecipazioni in opzioni put e call. Poiché le opzioni put indicano generalmente un sentiment negativo e le opzioni call un sentiment positivo, possiamo avere un'idea del sentiment istituzionale complessivo attraverso il rapporto tra put e call. Il grafico a destra mostra il rapporto storico put/call per questo strumento.
L'utilizzo del rapporto put/call come indicatore del sentiment degli investitori consente di superare una delle principali lacune dell'utilizzo della proprietà istituzionale totale, ovvero il fatto che una quantità significativa di asset in gestione viene investita passivamente per seguire gli indici. Generalmente, i fondi a gestione passiva non acquistano opzioni, per cui il rapporto put/call riflette più fedelmente il sentiment dei fondi a gestione attiva.
Depositi 13D/G
Presentiamo i depositi 13D/G separatamente dai depositi 13F a causa del diverso trattamento da parte della SEC. I depositi 13D/G possono essere presentati da gruppi di investitori (con un unico leader), mentre i depositi 13F no. Ciò comporta situazioni in cui un investitore può depositare un documento 13D/G riportando un valore per il totale delle azioni (che rappresenta tutte le azioni possedute dal gruppo di investitori), e poi depositare un documento 13F riportando un valore diverso per il totale delle azioni (che rappresenta esclusivamente la propria proprietà). Ciò significa che la proprietà delle azioni nei depositi 13D/G e nei depositi 13F spesso non sono direttamente comparabili, pertanto le presentiamo separatamente.
Nota: a partire dal 16 maggio 2021, non mostriamo più i proprietari che non hanno depositato un documento 13D/G nellultimo anno. In precedenza, mostravamo lintero storico dei depositi 13D/G. In generale, le entità che sono tenute a depositare i documenti 13D/G devono farlo almeno una volta all'anno prima di presentare un deposito di chiusura. Tuttavia, a volte i fondi escono dalle posizioni senza presentare un deposito di chiusura (cioè, procedono a una liquidazione), per cui la visualizzazione dell'intero storico a volte generava confusione sull'attuale proprietà. Per evitare confusione, ora mostriamo solo i proprietari "attuali", ossia quelli che hanno effettuato un deposito nell'ultimo anno.
Upgrade to unlock premium data.
| Data di deposito | Modulo | Investitore | Azioni precedenti |
Ultime azioni |
Δ Azioni (Percentuale) |
Proprietà (Percentuale) |
Δ Proprietà (Percentuale) |
|
|---|---|---|---|---|---|---|---|---|
| 2026-03-03 | Great Dane Ventures, LLC | 59,622,191 | 22,411,455 | -62.41 | 13.00 | -62.64 | ||
| 2025-04-24 | BlackRock, Inc. | 8,679,409 | 8,531,785 | -1.70 | 4.90 | -2.00 |
Depositi 13F e NPORT
Le informazioni relative ai depositi 13F sono gratuite. Per accedere alle informazioni relative ai depositi NP è necessario un'abbonamento premium. Le righe verdi indicano le nuove posizioni. Le righe rosse indicano le posizioni chiuse. Fai clic sull'icona del link per visualizzare la cronologia completa delle transazioni.
Esegui l'upgrade
per sbloccare i dati premium ed esportarli in Excel ![]() .
.
| Data di deposito | Fonte | Investitore | Tipo | Prezzo medio (Stima) |
Azioni | Δ Azioni (%) |
Valore dichiarato ($ 1000) |
Δ Valore (%) |
Allocazione del portafoglio (%) |
|
|---|---|---|---|---|---|---|---|---|---|---|
| 2025-11-04 | 13F | State of Wyoming | 0 | -100,00 | 0 | -100,00 | ||||
| 2026-01-29 | 13F | UBS Group AG | 137.859 | 303,38 | 83 | 196,43 | ||||
| 2026-02-17 | 13F | MIRAE ASSET GLOBAL ETFS HOLDINGS Ltd. | 44.261 | 3,16 | 27 | -25,71 | ||||
| 2026-02-17 | 13F | Shay Capital LLC | 5.511.600 | 24,36 | 3.321 | -9,83 | ||||
| 2026-02-17 | 13F | Citadel Advisors Llc | Put | 69.300 | -0,86 | 42 | -29,31 | |||
| 2026-02-17 | 13F | Citadel Advisors Llc | Call | 102.100 | 49,05 | 62 | 8,93 | |||
| 2026-02-17 | 13F | Susquehanna International Group, Llp | Put | 0 | -100,00 | 0 | -100,00 | |||
| 2026-02-12 | 13F | Nuveen, LLC | 361.631 | 0,00 | 218 | -27,67 | ||||
| 2026-02-13 | 13F | Charles Schwab Investment Management Inc | 816.036 | -0,11 | 492 | -27,58 | ||||
| 2026-02-13 | 13F | Panagora Asset Management Inc | 96.720 | -6,01 | 58 | -31,76 | ||||
| 2026-03-06 | 13F | Hsbc Holdings Plc | 0 | -100,00 | 0 | -100,00 | ||||
| 2026-02-13 | 13F | Transamerica Financial Advisors, Inc. | 91 | 0 | ||||||
| 2025-11-12 | 13F | Neuberger Berman Group LLC | 0 | -100,00 | 0 | |||||
| 2026-02-17 | 13F | Millennium Management Llc | 20.778 | -81,61 | 13 | -87,10 | ||||
| 2026-02-17 | 13F | Cresset Asset Management, LLC | 223.300 | 0,00 | 135 | -27,57 | ||||
| 2026-02-05 | 13F | Gabelli Funds Llc | 150.000 | 0,00 | 90 | -27,42 | ||||
| 2025-11-14 | 13F | Wolverine Trading, Llc | Call | 18.600 | 15 | |||||
| 2025-11-07 | 13F | Pallas Capital Advisors LLC | 0 | -100,00 | 0 | -100,00 | ||||
| 2025-11-14 | 13F | Wolverine Trading, Llc | Put | 12.500 | 10 | |||||
| 2025-09-24 | NP | PPNMX - SmallCap Growth Fund I R-3 | 3.951 | 3 | ||||||
| 2026-02-13 | 13F | MAI Capital Management | 31.246 | 0,00 | 19 | -28,00 | ||||
| 2025-09-26 | NP | FLXSX - Fidelity Flex Small Cap Index Fund This fund is a listed as child fund of Fmr Llc and if that institution has disclosed ownership in this security, then these positions will not be double counted when calculating total shares and total value | 25.929 | 3,99 | 22 | -21,43 | ||||
| 2026-02-17 | 13F | Mercer Global Advisors Inc /adv | 0 | -100,00 | 0 | -100,00 | ||||
| 2026-02-03 | 13F | Pilgrim Partners Asia Pte Ltd | 0 | -100,00 | 0 | |||||
| 2026-02-09 | 13F | Tiff Advisory Services Inc | 704.570 | 0,00 | 423 | -27,86 | ||||
| 2026-02-12 | 13F | Jane Street Group, Llc | Call | 25.700 | 112,40 | 15 | 50,00 | |||
| 2026-02-12 | 13F | Jane Street Group, Llc | 114.512 | 85,22 | 69 | 33,33 | ||||
| 2025-11-14 | 13F | Marex Group plc | Call | 0 | -100,00 | 0 | -100,00 | |||
| 2026-01-12 | 13F | Byrne Asset Management LLC | 94.500 | 57 | ||||||
| 2026-02-19 | 13F | Invesco Ltd. | 129.015 | -42,82 | 78 | -58,82 | ||||
| 2026-02-13 | 13F | Wells Fargo & Company/mn | 106.808 | 74,89 | 64 | 28,00 | ||||
| 2025-11-12 | 13F | R Squared Ltd | 0 | -100,00 | 0 | |||||
| 2026-02-06 | 13F | Nano Cap New Millennium Growth Fund L P | 1.805.000 | 1.088 | ||||||
| 2025-11-14 | 13F | Wolverine Trading, Llc | 11.461 | 9 | ||||||
| 2025-09-26 | NP | UAPIX - Ultrasmall-cap Profund Investor Class | 1.182 | -10,86 | 1 | 0,00 | ||||
| 2026-02-12 | 13F | New York State Common Retirement Fund | 35.625 | 0,00 | 21 | -27,59 | ||||
| 2025-09-24 | NP | BLACKROCK FUNDS - iShares Russell Small/Mid-Cap Index Fund Investor A | 18.801 | 62,89 | 16 | 23,08 | ||||
| 2026-02-13 | 13F | Sterling Capital Management LLC | 2.378 | 12,33 | 1 | 0,00 | ||||
| 2026-02-10 | 13F | Rothschild Investment Llc | 2 | 0 | ||||||
| 2025-09-29 | NP | SUNAMERICA SERIES TRUST - SA Small Cap Index Portfolio Class 1 | 12.134 | -17,81 | 10 | -37,50 | ||||
| 2025-11-14 | 13F | Colony Group, LLC | 0 | -100,00 | 0 | -100,00 | ||||
| 2026-02-13 | 13F | Rhumbline Advisers | 118.342 | -22,89 | 71 | -44,09 | ||||
| 2026-02-17 | 13F | potrero capital research llc | 0 | -100,00 | 0 | -100,00 | ||||
| 2025-09-24 | NP | SWSSX - Schwab Small-Cap Index Fund This fund is a listed as child fund of Charles Schwab Investment Management Inc and if that institution has disclosed ownership in this security, then these positions will not be double counted when calculating total shares and total value | 266.856 | -18,95 | 230 | -38,44 | ||||
| 2025-09-26 | NP | USMIX - Extended Market Index Fund | 10.705 | -5,10 | 9 | -25,00 | ||||
| 2026-02-02 | 13F | Oppenheimer & Co Inc | 0 | -100,00 | 0 | |||||
| 2025-09-24 | NP | PJARX - SmallCap Value Fund II R-3 | 2.250 | -76,21 | 2 | -90,00 | ||||
| 2026-02-10 | 13F | Murphy & Mullick Capital Management Corp | 2.000 | 0,00 | 1 | 0,00 | ||||
| 2026-02-17 | 13F | California State Teachers Retirement System | 5.658 | -41,13 | 3 | -57,14 | ||||
| 2026-01-30 | 13F | Caldwell Securities, Inc | 0 | -100,00 | 0 | |||||
| 2025-09-26 | NP | TISBX - TIAA-CREF Small-Cap Blend Index Fund Institutional Class | 157.351 | 0,00 | 136 | -23,73 | ||||
| 2026-02-10 | 13F | Intech Investment Management Llc | 35.104 | -28,10 | 21 | -47,50 | ||||
| 2026-02-13 | 13F | Victory Capital Management Inc | 11.284 | -0,32 | 7 | -33,33 | ||||
| 2026-02-17 | 13F | Price T Rowe Associates Inc /md/ | 62.028 | 0,00 | 0 | |||||
| 2026-02-06 | 13F | Gsa Capital Partners Llp | 989.271 | -5,78 | 1 | |||||
| 2025-11-14 | 13F | Ameriprise Financial Inc | 0 | -100,00 | 0 | -100,00 | ||||
| 2026-02-13 | 13F | Morgan Stanley | 644.390 | 56,81 | 388 | 13,78 | ||||
| 2026-02-17 | 13F | Algert Global Llc | 0 | -100,00 | 0 | |||||
| 2026-02-11 | 13F | Simplex Trading, Llc | 22.439 | -59,31 | 14 | |||||
| 2026-02-17 | 13F | Aqr Capital Management Llc | 101.987 | -65,32 | 61 | -75,00 | ||||
| 2025-09-26 | NP | FZIPX - Fidelity ZERO Extended Market Index Fund This fund is a listed as child fund of Fmr Llc and if that institution has disclosed ownership in this security, then these positions will not be double counted when calculating total shares and total value | 37.867 | 0,00 | 33 | -23,81 | ||||
| 2025-09-29 | NP | PRFZ - Invesco FTSE RAFI US 1500 Small-Mid ETF This fund is a listed as child fund of Invesco Ltd. and if that institution has disclosed ownership in this security, then these positions will not be double counted when calculating total shares and total value | 197.712 | -33,91 | 170 | -49,70 | ||||
| 2026-02-17 | 13F | Jones Financial Companies Lllp | 400 | 0,00 | 0 | |||||
| 2026-02-12 | 13F | Commonwealth Equity Services, Llc | 821.500 | -3,85 | 495 | |||||
| 2026-02-17 | 13F | XTX Topco Ltd | 62.543 | 38 | ||||||
| 2026-01-08 | 13F | Wealth Enhancement Advisory Services, Llc | 0 | -100,00 | 0 | -100,00 | ||||
| 2026-02-13 | 13F | Arrowstreet Capital, Limited Partnership | 1.626.586 | -18,11 | 980 | -40,61 | ||||
| 2026-02-10 | 13F | Bank of New York Mellon Corp | 226.634 | -2,03 | 137 | -29,17 | ||||
| 2025-09-29 | NP | RSSL - Global X Russell 2000 ETF | 53.867 | -30,84 | 46 | -47,73 | ||||
| 2026-02-02 | 13F | Strs Ohio | 11.300 | 0,00 | 7 | -33,33 | ||||
| 2026-01-21 | 13F | Brooklyn FI, LLC | 169.284 | -15,13 | 102 | -38,79 | ||||
| 2026-02-03 | 13F | CGC Financial Services, LLC | 1.749 | 0,00 | 1 | 0,00 | ||||
| 2026-02-17 | 13F | D. E. Shaw & Co., Inc. | 120.597 | -24,57 | 73 | -45,45 | ||||
| 2026-02-09 | 13F | Hartland & Co., LLC | 0 | -100,00 | 0 | |||||
| 2026-01-26 | 13F | Cwm, Llc | 9.186 | -57,03 | 0 | |||||
| 2026-02-11 | 13F | Jpmorgan Chase & Co | 86.935 | -51,19 | 52 | -64,63 | ||||
| 2025-11-14 | 13F | Point72 (DIFC) Ltd | 5.222 | 4 | ||||||
| 2026-02-11 | 13F | Group One Trading, L.p. | 25.738 | -51,20 | 16 | -65,12 | ||||
| 2026-02-05 | 13F | Amalgamated Bank | 2.902 | -33,96 | 0 | |||||
| 2026-02-13 | 13F | Walleye Trading LLC | Call | 66.000 | -8,46 | 40 | -33,90 | |||
| 2026-02-03 | 13F | SBI Securities Co., Ltd. | 104 | 2.500,00 | 0 | |||||
| 2026-02-10 | 13F | Bnp Paribas Arbitrage, Sa | 20.415 | -59,52 | 12 | -70,73 | ||||
| 2026-02-12 | 13F | Federated Hermes, Inc. | 4.608 | -15,36 | 3 | -50,00 | ||||
| 2026-02-23 | 13F | Virtu Financial LLC | 14.557 | 0 | ||||||
| 2026-02-17 | 13F | Moore Capital Management, Lp | 0 | -100,00 | 0 | |||||
| 2026-02-17 | 13F | Two Sigma Securities, Llc | 16.203 | 10 | ||||||
| 2025-10-14 | 13F | Farther Finance Advisors, LLC | 0 | -100,00 | 0 | |||||
| 2026-01-12 | 13F | Evanson Asset Management, LLC | 10.000 | -56,52 | 6 | -68,42 | ||||
| 2026-02-11 | 13F | Cerity Partners LLC | 43.849 | -32,35 | 26 | -50,94 | ||||
| 2025-10-09 | 13F | Voya Investment Management Llc | 0 | -100,00 | 0 | -100,00 | ||||
| 2026-02-11 | 13F | Deutsche Bank Ag\ | 81.180 | 0,00 | 49 | -28,36 | ||||
| 2026-02-17 | 13F | Optiver Holding B.V. | 998 | 5,05 | 1 | |||||
| 2026-02-05 | 13F | Allworth Financial LP | 0 | -100,00 | 0 | |||||
| 2026-01-09 | 13F | SG Americas Securities, LLC | 36.025 | -27,15 | 0 | |||||
| 2026-02-13 | 13F | Citigroup Inc | 2.090 | -40,13 | 1 | -50,00 | ||||
| 2026-02-13 | 13F | Mariner, LLC | 11.733 | -25,36 | 7 | -46,15 | ||||
| 2026-02-09 | 13F | Legal & General Group Plc | 10.232 | 0,00 | 6 | -25,00 | ||||
| 2026-02-13 | 13F | Police & Firemen's Retirement System of New Jersey | 26.652 | 0,00 | 16 | -27,27 | ||||
| 2026-02-13 | 13F | SRS Capital Advisors, Inc. | 0 | -100,00 | 0 | |||||
| 2026-02-17 | 13F | Engineers Gate Manager LP | 33.784 | 8,34 | 20 | -20,00 | ||||
| 2026-02-06 | 13F | Prescott Group Capital Management, L.l.c. | 4.109.133 | 108,14 | 2.476 | 50,91 | ||||
| 2026-02-09 | 13F | Geode Capital Management, Llc | 2.511.952 | -6,60 | 1.514 | -32,27 | ||||
| 2026-02-17 | 13F | Fmr Llc | 158.683 | -2,26 | 96 | -29,10 | ||||
| 2026-02-13 | 13F | Pinnacle Wealth Planning Services, Inc. | 1.000 | 1 | ||||||
| 2026-02-17 | 13F | Northern Trust Corp | 709.928 | -4,30 | 428 | -30,68 | ||||
| 2026-02-13 | 13F | Walleye Trading LLC | Put | 0 | -100,00 | 0 | -100,00 | |||
| 2026-02-17 | 13F | Tower Research Capital LLC (TRC) | 17.386 | 12,90 | 10 | -16,67 | ||||
| 2026-02-12 | 13F | Renaissance Technologies Llc | 96.500 | 92,23 | 58 | 41,46 | ||||
| 2025-11-14 | 13F | Point72 Asia (Singapore) Pte. Ltd. | 14.607 | -33,47 | 12 | -36,84 | ||||
| 2026-02-17 | 13F | Advisor Group Holdings, Inc. | 2.975 | 0,00 | 2 | -50,00 | ||||
| 2026-02-17 | 13F | Lotus Technology Management, LP | 82.568 | 50 | ||||||
| 2026-02-17 | 13F | Bridgeway Capital Management Inc | 431.435 | -31,67 | 260 | -50,57 | ||||
| 2026-02-17 | 13F | Murchinson Ltd. | 490.043 | 0,00 | 295 | -27,52 | ||||
| 2025-09-26 | NP | FSSNX - Fidelity Small Cap Index Fund This fund is a listed as child fund of Fmr Llc and if that institution has disclosed ownership in this security, then these positions will not be double counted when calculating total shares and total value | 1.081.146 | -17,05 | 931 | -36,75 | ||||
| 2025-09-26 | 13F/A | CI Private Wealth, LLC | 0 | -100,00 | 0 | |||||
| 2025-11-14 | 13F | Verition Fund Management LLC | 0 | -100,00 | 0 | |||||
| 2026-02-13 | 13F | State Street Corp | 2.319.206 | -0,45 | 1.397 | -27,80 | ||||
| 2025-10-17 | 13F | Fortitude Family Office, LLC | 0 | -100,00 | 0 | |||||
| 2026-02-17 | 13F | Royal Bank Of Canada | 5.250 | -88,42 | 4 | -89,19 | ||||
| 2026-02-13 | 13F | Prudential Financial Inc | 0 | -100,00 | 0 | |||||
| 2026-02-17 | 13F | Citadel Advisors Llc | 0 | -100,00 | 0 | -100,00 | ||||
| 2026-02-13 | 13F | Toroso Investments, LLC | 22.500 | 14 | ||||||
| 2025-10-23 | 13F | Nisa Investment Advisors, Llc | 0 | -100,00 | 0 | |||||
| 2026-02-10 | 13F | Goldman Sachs Group Inc | 667.881 | 77,98 | 402 | 29,26 | ||||
| 2025-09-24 | NP | BLACKROCK FUNDS - iShares Total U.S. Stock Market Index Fund Investor A | 12.225 | 0,00 | 11 | -23,08 | ||||
| 2026-02-04 | 13F | Tsfg, Llc | 300 | 200,00 | 0 | |||||
| 2026-02-17 | 13F | Magnetar Financial LLC | 0 | -100,00 | 0 | |||||
| 2025-11-14 | 13F | Qube Research & Technologies Ltd | 0 | -100,00 | 0 | |||||
| 2025-09-26 | NP | SLPIX - Small-cap Profund Investor Class | 96 | -24,41 | 0 | |||||
| 2026-02-17 | 13F | Susquehanna International Group, Llp | 1.148.691 | 325,03 | 692 | 208,93 | ||||
| 2025-11-14 | 13F | Raymond James Financial Inc | 0 | -100,00 | 0 | |||||
| 2026-02-13 | 13F | Jacobs Levy Equity Management, Inc | 84.119 | -9,03 | 51 | -34,21 | ||||
| 2026-02-17 | 13F | Susquehanna International Group, Llp | Call | 30.900 | -80,63 | 19 | -86,36 | |||
| 2026-02-06 | 13F | IFP Advisors, Inc | 64 | -4,48 | 0 | |||||
| 2026-02-13 | 13F | Barclays Plc | 192.810 | -1,12 | 116 | -27,95 | ||||
| 2026-02-17 | 13F | Bank Of America Corp /de/ | 114.223 | 9,74 | 69 | -20,93 | ||||
| 2026-02-06 | 13F | EverSource Wealth Advisors, LLC | 239 | -85,69 | 0 | -100,00 | ||||
| 2026-02-06 | 13F | ProShare Advisors LLC | 16.877 | 6,86 | 10 | -23,08 | ||||
| 2026-02-12 | 13F | Cibc World Markets Corp | 0 | -100,00 | 0 | |||||
| 2025-11-14 | 13F | Graham Capital Management, L.P. | 0 | -100,00 | 0 | |||||
| 2026-02-09 | 13F | Huntington National Bank | 1 | 0,00 | 0 | |||||
| 2026-02-11 | 13F | Ameritas Investment Partners, Inc. | 9.359 | 6 | ||||||
| 2026-02-13 | 13F | Ieq Capital, Llc | 0 | -100,00 | 0 | -100,00 | ||||
| 2026-02-17 | 13F | Russell Investments Group, Ltd. | 8.840 | 0,00 | 5 | -28,57 | ||||
| 2026-02-12 | 13F | BlackRock, Inc. | 6.799.283 | 1,87 | 4.097 | -26,13 | ||||
| 2025-09-29 | NP | KCXIX - Knights of Columbus U.S. All Cap Index Fund I Shares | 569 | 9,63 | 0 | |||||
| 2025-11-14 | 13F | Brevan Howard Capital Management LP | 0 | -100,00 | 0 | |||||
| 2025-09-26 | NP | TIEIX - TIAA-CREF Equity Index Fund Institutional Class | 196.056 | 0,00 | 169 | -23,98 | ||||
| 2026-01-08 | 13F | True Wealth Design, LLC | 1 | -98,55 | 0 | |||||
| 2026-01-29 | 13F | Vanguard Group Inc | 6.853.038 | 0,57 | 4.132 | -27,02 | ||||
| 2026-02-17 | 13F | Alliancebernstein L.p. | 458.879 | 0,00 | 276 | -27,56 | ||||
| 2025-11-12 | 13F | Us Bancorp \de\ | 0 | -100,00 | 0 | |||||
| 2026-02-09 | 13F | Arnhold LLC | 164.270 | 0,00 | 99 | -27,94 | ||||
| 2026-02-12 | 13F | Hrt Financial Lp | 0 | -100,00 | 0 | |||||
| 2025-09-26 | NP | FZROX - Fidelity ZERO Total Market Index Fund This fund is a listed as child fund of Fmr Llc and if that institution has disclosed ownership in this security, then these positions will not be double counted when calculating total shares and total value | 55.352 | 0,00 | 48 | -24,19 | ||||
| 2026-01-21 | 13F | Newbridge Financial Services Group, Inc. | 300 | 0 | ||||||
| 2025-11-14 | 13F | Public Employees Retirement System Of Ohio | 0 | -100,00 | 0 | -100,00 | ||||
| 2026-02-10 | 13F | Savant Capital, LLC | 0 | -100,00 | 0 | |||||
| 2026-02-12 | 13F | Wealthspire Advisors, LLC | 0 | -100,00 | 0 |