Statistiche di base
| Proprietari istituzionali | 70 total, 69 long only, 1 short only, 0 long/short - change of 2,94% MRQ |
| Allocazione media del portafoglio | -0.0069 % - change of 478,84% MRQ |
| Azioni istituzionali (Long) | 7.482.762 (ex 13D/G) - change of -0,40MM shares -5,05% MRQ |
| Valore istituzionale (Long) | $ 34.921 USD ($1000) |
Proprietà istituzionale e azionisti
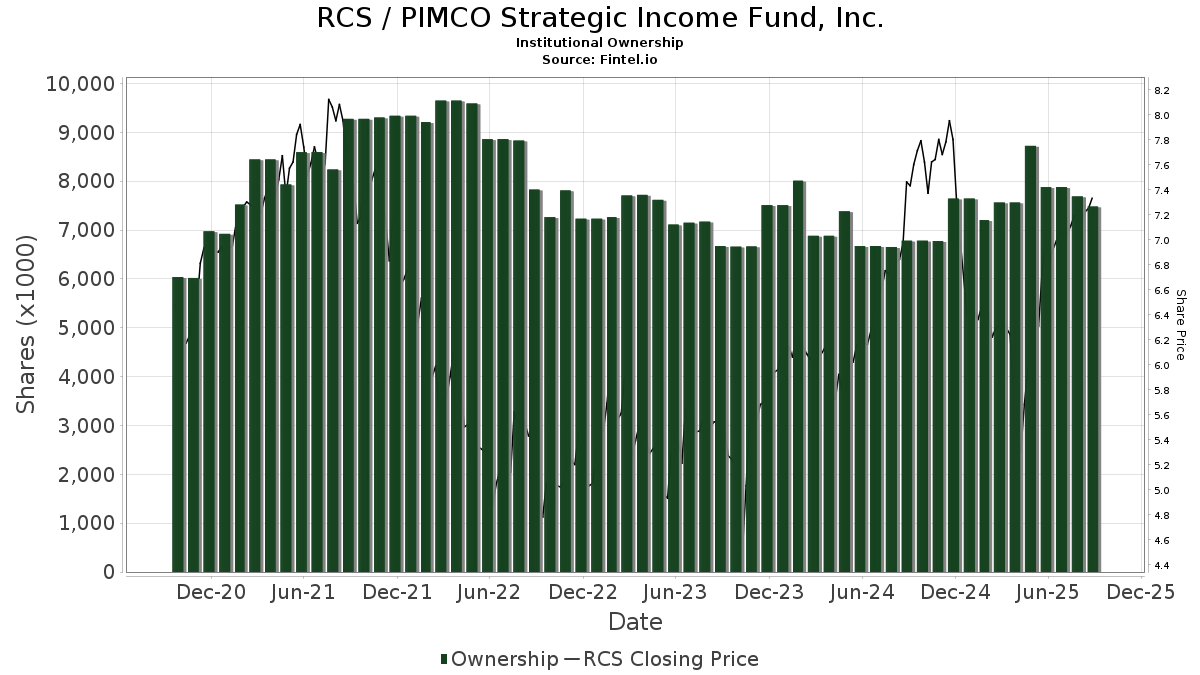
PIMCO Strategic Income Fund, Inc. (US:RCS) ha 70 proprietari istituzionali e azionisti che hanno presentato i moduli 13D/G o 13F alla Securities Exchange Commission (SEC). Queste istituzioni detengono un totale di 7,502,762 azioni. I maggiori azionisti includono Cambridge Investment Research Advisors, Inc., Advisor Group Holdings, Inc., Morgan Stanley, LPL Financial LLC, Benjamin Edwards Inc, Commonwealth Equity Services, Llc, UBS Group AG, Citadel Advisors Llc, Envestnet Asset Management Inc, and Milestone Asset Management, Llc .
(PIMCO Strategic Income Fund, Inc. (NYSE:RCS) la struttura proprietaria istituzionale mostra le attuali posizioni nella società da parte di istituzioni e fondi, nonché le ultime variazioni nella dimensione della posizione. I principali azionisti possono essere singoli investitori, fondi comuni, hedge fund o istituzioni. L'allegato 13D indica che l'investitore detiene (o ha detenuto) più del 5% della società e intende (o intendeva) perseguire attivamente un cambiamento nella strategia aziendale. L'allegato 13G indica un investimento passivo superiore al 5%.
The share price as of September 5, 2025 is 7,25 / share. Previously, on September 9, 2024, the share price was 7,13 / share. This represents an increase of 1,68% over that period.
Indice del sentiment dei fondi
L'indice del sentiment dei fondi (anche noto come "indice di accumulo di proprietà") individua i titoli più acquistati dai fondi. È il risultato di un sofisticato modello quantitativo multi-fattore che identifica le società con i più alti livelli di accumulo istituzionale. Il modello utilizza una combinazione dell'aumento totale dei proprietari dichiarati, delle variazioni nelle allocazioni di portafoglio di tali proprietari e di altre metriche. Il punteggio varia da 0 a 100: i numeri più alti indicano un livello di accumulo superiore ad altre società, mentre 50 rappresenta la media.
Frequenza di aggiornamento: giornaliera
Consulta Ownership Explorer per visualizzare l'elenco delle aziende con il ranking più alto.
Rapporto put/call istituzionale
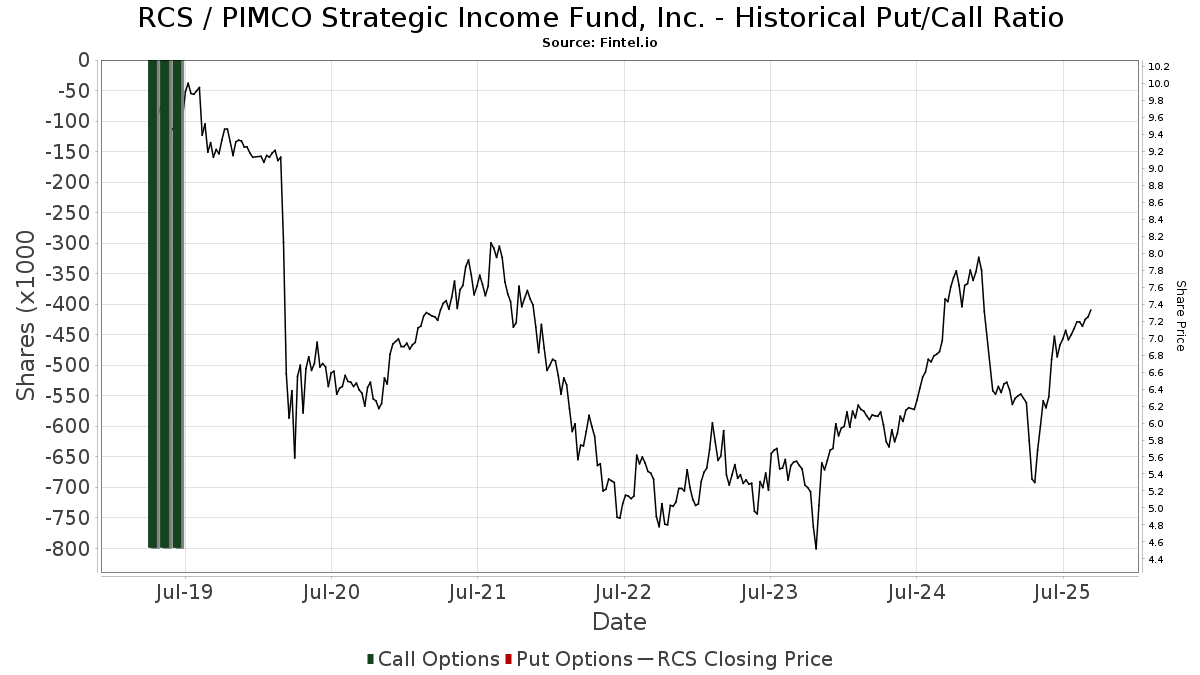
Oltre a segnalare le emissioni standard di titoli azionari e di debito, gli istituti con più di 100 milioni di asset in gestione devono anche dichiarare le loro partecipazioni in opzioni put e call. Poiché le opzioni put indicano generalmente un sentiment negativo e le opzioni call un sentiment positivo, possiamo avere un'idea del sentiment istituzionale complessivo attraverso il rapporto tra put e call. Il grafico a destra mostra il rapporto storico put/call per questo strumento.
L'utilizzo del rapporto put/call come indicatore del sentiment degli investitori consente di superare una delle principali lacune dell'utilizzo della proprietà istituzionale totale, ovvero il fatto che una quantità significativa di asset in gestione viene investita passivamente per seguire gli indici. Generalmente, i fondi a gestione passiva non acquistano opzioni, per cui il rapporto put/call riflette più fedelmente il sentiment dei fondi a gestione attiva.
Depositi 13F e NPORT
Le informazioni relative ai depositi 13F sono gratuite. Per accedere alle informazioni relative ai depositi NP è necessario un'abbonamento premium. Le righe verdi indicano le nuove posizioni. Le righe rosse indicano le posizioni chiuse. Fai clic sull'icona del link per visualizzare la cronologia completa delle transazioni.
Esegui l'upgrade
per sbloccare i dati premium ed esportarli in Excel ![]() .
.
| Data di deposito | Fonte | Investitore | Tipo | Prezzo medio (Stima) |
Azioni | Δ Azioni (%) |
Valore dichiarato ($ 1000) |
Δ Valore (%) |
Allocazione del portafoglio (%) |
|
|---|---|---|---|---|---|---|---|---|---|---|
| 2025-08-01 | 13F | Envestnet Asset Management Inc | 176.318 | 7,02 | 1.227 | 19,24 | ||||
| 2025-07-28 | 13F | Mutual Advisors, LLC | 65.916 | 1,01 | 464 | 27,12 | ||||
| 2025-08-04 | 13F | Kovack Advisors, Inc. | 24.506 | 0,94 | 171 | 12,58 | ||||
| 2025-08-12 | 13F | CIBC Private Wealth Group, LLC | 5.313 | 0,00 | 37 | 20,00 | ||||
| 2025-08-13 | 13F | Luminist Capital LLC | 650 | 5 | ||||||
| 2025-08-13 | 13F | Townsquare Capital Llc | 10.548 | 73 | ||||||
| 2025-08-07 | 13F | Allworth Financial LP | 1.437 | 7,48 | 10 | 42,86 | ||||
| 2025-07-18 | 13F | QTR Family Wealth, LLC | 12.276 | -25,42 | 85 | -16,67 | ||||
| 2025-05-14 | 13F | Stifel Financial Corp | 0 | -100,00 | 0 | |||||
| 2025-05-08 | 13F | Private Advisory Group LLC | 0 | -100,00 | 0 | |||||
| 2025-08-07 | 13F | Alpha Cubed Investments, LLC | 12.000 | 0,00 | 84 | 10,67 | ||||
| 2025-08-12 | 13F | Bravias Capital Group, LLC | 85.000 | 1,31 | 592 | 12,79 | ||||
| 2025-08-08 | 13F | Creative Planning | 15.470 | 8,54 | 108 | 20,22 | ||||
| 2025-08-13 | 13F | Continuum Advisory, LLC | 0 | -100,00 | 0 | |||||
| 2025-08-12 | 13F | Proequities, Inc. | 0 | 0 | ||||||
| 2025-07-22 | 13F | Keudell/Morrison Wealth Management | 10.000 | 0,00 | 70 | 11,29 | ||||
| 2025-08-13 | 13F | Keystone Financial Group | 53.930 | 0,00 | 375 | 11,28 | ||||
| 2025-07-14 | 13F | Armstrong Advisory Group, Inc | 15.231 | -9,80 | 106 | -17,19 | ||||
| 2025-08-08 | 13F | Cetera Investment Advisers | 72.983 | 2,35 | 508 | 13,93 | ||||
| 2025-07-11 | 13F | CX Institutional | 0 | -100,00 | 0 | |||||
| 2025-08-13 | 13F | First Trust Advisors Lp | 12.276 | 85 | ||||||
| 2025-08-13 | 13F | Northwestern Mutual Wealth Management Co | 2.657 | 165,70 | 18 | 200,00 | ||||
| 2025-07-31 | 13F | Buckingham Strategic Partners | 11.450 | 80 | ||||||
| 2025-08-14 | 13F | Benjamin Edwards Inc | 425.434 | 4,96 | 2.961 | 16,90 | ||||
| 2025-08-13 | 13F | Jones Financial Companies Lllp | 1.000 | 7 | ||||||
| 2025-08-14 | 13F | Susquehanna International Group, Llp | 24.701 | -42,18 | 172 | -35,96 | ||||
| 2025-07-21 | 13F | Ameriflex Group, Inc. | 905 | -5,24 | 6 | 20,00 | ||||
| 2025-08-14 | 13F | Modern Wealth Management, LLC | 31.163 | 1,96 | 217 | 13,09 | ||||
| 2025-05-14 | 13F | Kestra Advisory Services, LLC | 0 | -100,00 | 0 | -100,00 | ||||
| 2025-08-14 | 13F | Mercer Global Advisors Inc /adv | 150.546 | 0,14 | 1.048 | 11,50 | ||||
| 2025-04-11 | 13F | Vanguard Capital Wealth Advisors This fund is a listed as child fund of Vanguard Group Inc and if that institution has disclosed ownership in this security, then these positions will not be double counted when calculating total shares and total value | 0 | -100,00 | 0 | |||||
| 2025-07-15 | 13F | Main Street Group, LTD | 6.270 | 0,66 | 44 | 13,16 | ||||
| 2025-07-29 | 13F | Balboa Wealth Partners | 109.552 | -32,72 | 762 | -25,07 | ||||
| 2025-08-12 | 13F | Clearbridge Investments, LLC | 17.823 | 0,00 | 124 | 11,71 | ||||
| 2025-08-12 | 13F | J.w. Cole Advisors, Inc. | 62.928 | 1,28 | 438 | 12,63 | ||||
| 2025-04-25 | 13F | Smallwood Wealth Investment Management, LLC | 2.165 | 14 | ||||||
| 2025-05-29 | NP | ACEFX - Absolute Strategies Fund Institutional Shares | Short | -20.000 | -125 | |||||
| 2025-08-14 | 13F | UBS Group AG | 386.907 | 29,21 | 2.693 | 43,88 | ||||
| 2025-05-15 | 13F | Centric Wealth Management | 0 | -100,00 | 0 | -100,00 | ||||
| 2025-07-17 | 13F | Janney Montgomery Scott LLC | 125.010 | -11,75 | 1 | |||||
| 2025-08-11 | 13F | FSA Wealth Management LLC | 12.605 | -19,22 | 88 | -10,31 | ||||
| 2025-07-21 | 13F | Ameritas Advisory Services, LLC | 55.255 | 0,16 | 385 | -8,57 | ||||
| 2025-05-16 | 13F | Coppell Advisory Solutions LLC | 0 | -100,00 | 0 | |||||
| 2025-08-06 | 13F | Commonwealth Equity Services, Llc | 410.551 | 0,43 | 3 | 0,00 | ||||
| 2025-08-12 | 13F | LPL Financial LLC | 637.440 | -30,68 | 4.437 | -22,81 | ||||
| 2025-05-13 | 13F | Elequin Capital Lp | 0 | -100,00 | 0 | |||||
| 2025-08-05 | 13F | Scarborough Advisors, LLC | 5.369 | 37 | ||||||
| 2025-08-14 | 13F | Mml Investors Services, Llc | 10.059 | 0 | ||||||
| 2025-08-15 | 13F | Morgan Stanley | 672.248 | 1,24 | 4.679 | 12,72 | ||||
| 2025-05-01 | 13F | Cwm, Llc | 0 | -100,00 | 0 | |||||
| 2025-08-13 | 13F | Baker Avenue Asset Management, LP | 48.574 | -39,00 | 338 | -31,99 | ||||
| 2025-08-05 | 13F | Milestone Asset Management, Llc | 158.923 | -4,02 | 1.106 | 6,96 | ||||
| 2025-08-14 | 13F | CoreCap Advisors, LLC | 5.175 | 0,00 | 36 | 12,50 | ||||
| 2025-08-14 | 13F | Royal Bank Of Canada | 12.460 | 0,78 | 86 | 11,69 | ||||
| 2025-08-14 | 13F | Citadel Advisors Llc | 176.794 | 1,29 | 1.230 | 12,84 | ||||
| 2025-05-14 | 13F | Natixis | 0 | -100,00 | 0 | |||||
| 2025-07-16 | 13F | Owen LaRue, LLC | 81.828 | -41,16 | 570 | -34,52 | ||||
| 2025-08-05 | 13F | Flynn Zito Capital Management, Llc | 0 | -100,00 | 0 | |||||
| 2025-07-28 | 13F | Harbour Investments, Inc. | 6.388 | 0,73 | 44 | 12,82 | ||||
| 2025-08-11 | 13F | Principal Securities, Inc. | 2.616 | 21,62 | 18 | 12,50 | ||||
| 2025-07-31 | 13F | Cambridge Investment Research Advisors, Inc. | 1.917.133 | -3,14 | 13 | 8,33 | ||||
| 2025-08-14 | 13F | GWM Advisors LLC | 104.057 | -5,13 | 724 | 5,69 | ||||
| 2025-08-11 | 13F | HighTower Advisors, LLC | 17.591 | 58,08 | 122 | 76,81 | ||||
| 2025-07-11 | 13F | UMA Financial Services, Inc. | 0 | -100,00 | 0 | |||||
| 2025-08-14 | 13F | Raymond James Financial Inc | 45.428 | -4,02 | 316 | 7,12 | ||||
| 2025-08-14 | 13F | Bank Of America Corp /de/ | 39.407 | -11,28 | 274 | -1,08 | ||||
| 2025-08-14 | 13F | Mariner, LLC | 16.063 | 112 | ||||||
| 2025-08-12 | 13F | MAI Capital Management | 182 | 2,82 | 1 | 0,00 | ||||
| 2025-07-14 | 13F | S.A. Mason LLC | 775 | 0,00 | 5 | 25,00 | ||||
| 2025-08-13 | 13F | StoneX Group Inc. | 10.308 | 72 | ||||||
| 2025-08-05 | 13F | Carolinas Wealth Consulting Llc | 0 | -100,00 | 0 | |||||
| 2025-08-14 | 13F | Atomi Financial Group, Inc. | 32.979 | -1,20 | 230 | 10,10 | ||||
| 2025-07-24 | 13F | IFP Advisors, Inc | 60 | -99,68 | 0 | -100,00 | ||||
| 2025-04-21 | 13F | PSI Advisors, LLC | 0 | -100,00 | 0 | |||||
| 2025-08-11 | 13F | Private Advisor Group, LLC | 12.158 | 0,26 | 85 | 12,00 | ||||
| 2025-07-29 | 13F | Straight Path Wealth Management | 31.400 | 6,80 | 219 | 19,13 | ||||
| 2025-07-15 | 13F | Fifth Third Bancorp | 569 | 4 | ||||||
| 2025-09-04 | 13F/A | Advisor Group Holdings, Inc. | 962.911 | 2,80 | 6.702 | 14,47 | ||||
| 2025-07-30 | 13F | FNY Investment Advisers, LLC | 500 | 0,00 | 0 | |||||
| 2025-07-24 | 13F | Eastern Bank | 143 | 0,00 | 1 | |||||
| 2025-08-14 | 13F | Ieq Capital, Llc | 0 | -100,00 | 0 | |||||
| 2025-08-15 | 13F | Equitable Holdings, Inc. | 21.908 | 64,62 | 152 | 83,13 | ||||
| 2025-08-27 | 13F | Barnes Wealth Management Group, Inc | 20.875 | 23,70 | 145 | 38,10 | ||||
| 2025-07-08 | 13F | Morris Retirement Advisors, LLC | 12.050 | -18,70 | 84 | -9,78 | ||||
| 2025-07-10 | 13F | Exchange Traded Concepts, Llc | 682 | 5 | ||||||
| 2025-04-23 | 13F | Mascagni Wealth Management, Inc. | 0 | -100,00 | 0 | -100,00 | ||||
| 2025-08-14 | 13F | Wells Fargo & Company/mn | 1.638 | -22,41 | 11 | -15,38 | ||||
| 2025-08-14 | 13F | Comerica Bank | 5.295 | 0,00 | 37 | 9,09 | ||||
| 2025-05-13 | 13F | Bokf, Na | 0 | -100,00 | 0 |