PSQH - PSQ Holdings, Inc. Azioni - Prezzo delle azioni, proprietà istituzionale, azionisti (NYSE)

PSQ Holdings, Inc.
US ˙ NYSE ˙ US6936911071

Statistiche di base
Proprietari istituzionali 86 total, 80 long only, 1 short only, 5 long/short - change of -3,37% MRQ
Allocazione media del portafoglio 0.0088 % - change of 36,29% MRQ
Azioni in circolazione shares (source: Capital IQ)
Azioni istituzionali (Long) 10.929.334 - 25,60% (ex 13D/G) - change of 3,48MM shares 46,67% MRQ
Valore istituzionale (Long) $ 22.266 USD ($1000)
Proprietà istituzionale e azionisti

PSQ Holdings, Inc. (US:PSQH) ha 86 proprietari istituzionali e azionisti che hanno presentato i moduli 13D/G o 13F alla Securities Exchange Commission (SEC). Queste istituzioni detengono un totale di 10,929,334 azioni. I maggiori azionisti includono Alyeska Investment Group, L.P., Vanguard Group Inc, Sepio Capital, LP, Marshall Wace, Llp, VTSMX - Vanguard Total Stock Market Index Fund Investor Shares, Belpointe Asset Management LLC, Harvest Investment Services, LLC, UBS Group AG, VEXMX - Vanguard Extended Market Index Fund Investor Shares, and Spire Wealth Management .

(PSQ Holdings, Inc. (NYSE:PSQH) la struttura proprietaria istituzionale mostra le attuali posizioni nella società da parte di istituzioni e fondi, nonché le ultime variazioni nella dimensione della posizione. I principali azionisti possono essere singoli investitori, fondi comuni, hedge fund o istituzioni. L'allegato 13D indica che l'investitore detiene (o ha detenuto) più del 5% della società e intende (o intendeva) perseguire attivamente un cambiamento nella strategia aziendale. L'allegato 13G indica un investimento passivo superiore al 5%.

The share price as of September 5, 2025 is 1,61 / share. Previously, on September 6, 2024, the share price was 2,60 / share. This represents a decline of 38,08% over that period.

PSQH / PSQ Holdings, Inc. Institutional Ownership
Indice del sentiment dei fondi

L'indice del sentiment dei fondi (anche noto come "indice di accumulo di proprietà") individua i titoli più acquistati dai fondi. È il risultato di un sofisticato modello quantitativo multi-fattore che identifica le società con i più alti livelli di accumulo istituzionale. Il modello utilizza una combinazione dell'aumento totale dei proprietari dichiarati, delle variazioni nelle allocazioni di portafoglio di tali proprietari e di altre metriche. Il punteggio varia da 0 a 100: i numeri più alti indicano un livello di accumulo superiore ad altre società, mentre 50 rappresenta la media.

Frequenza di aggiornamento: giornaliera

Consulta Ownership Explorer per visualizzare l'elenco delle aziende con il ranking più alto.

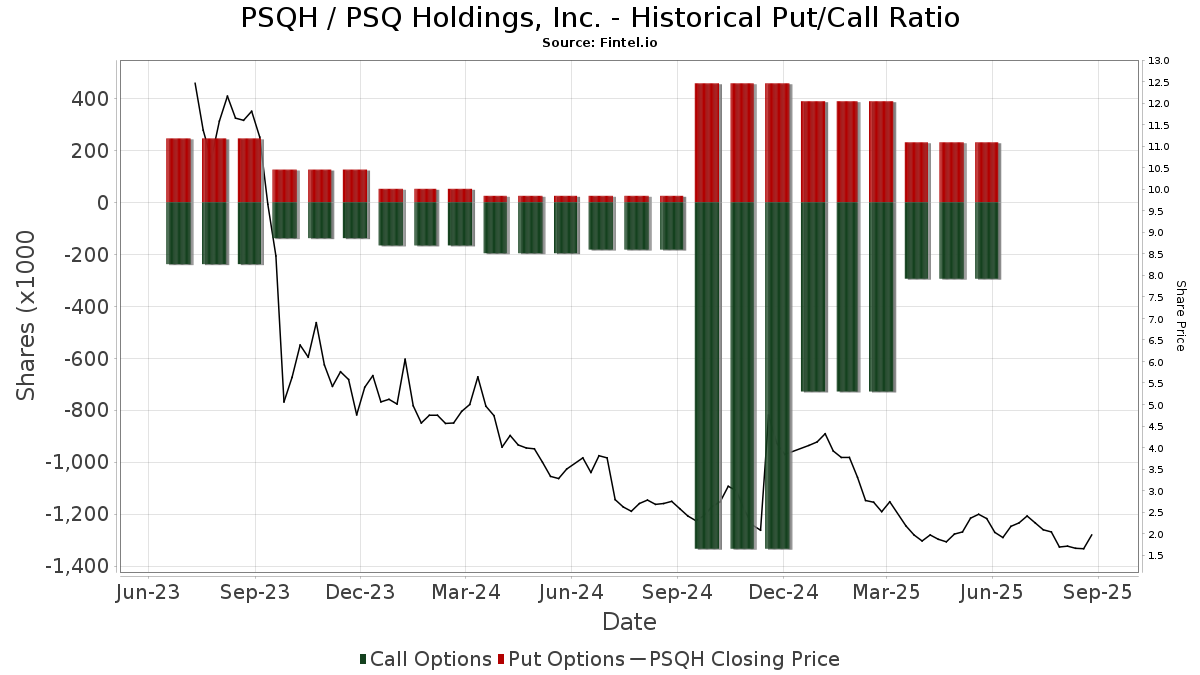
Rapporto put/call istituzionale

Oltre a segnalare le emissioni standard di titoli azionari e di debito, gli istituti con più di 100 milioni di asset in gestione devono anche dichiarare le loro partecipazioni in opzioni put e call. Poiché le opzioni put indicano generalmente un sentiment negativo e le opzioni call un sentiment positivo, possiamo avere un'idea del sentiment istituzionale complessivo attraverso il rapporto tra put e call. Il grafico a destra mostra il rapporto storico put/call per questo strumento.

L'utilizzo del rapporto put/call come indicatore del sentiment degli investitori consente di superare una delle principali lacune dell'utilizzo della proprietà istituzionale totale, ovvero il fatto che una quantità significativa di asset in gestione viene investita passivamente per seguire gli indici. Generalmente, i fondi a gestione passiva non acquistano opzioni, per cui il rapporto put/call riflette più fedelmente il sentiment dei fondi a gestione attiva.

PSQH / PSQ Holdings, Inc. Historical Put/Call Ratio
Depositi 13D/G

Presentiamo i depositi 13D/G separatamente dai depositi 13F a causa del diverso trattamento da parte della SEC. I depositi 13D/G possono essere presentati da gruppi di investitori (con un unico leader), mentre i depositi 13F no. Ciò comporta situazioni in cui un investitore può depositare un documento 13D/G riportando un valore per il totale delle azioni (che rappresenta tutte le azioni possedute dal gruppo di investitori), e poi depositare un documento 13F riportando un valore diverso per il totale delle azioni (che rappresenta esclusivamente la propria proprietà). Ciò significa che la proprietà delle azioni nei depositi 13D/G e nei depositi 13F spesso non sono direttamente comparabili, pertanto le presentiamo separatamente.

Nota: a partire dal 16 maggio 2021, non mostriamo più i proprietari che non hanno depositato un documento 13D/G nellultimo anno. In precedenza, mostravamo lintero storico dei depositi 13D/G. In generale, le entità che sono tenute a depositare i documenti 13D/G devono farlo almeno una volta all'anno prima di presentare un deposito di chiusura. Tuttavia, a volte i fondi escono dalle posizioni senza presentare un deposito di chiusura (cioè, procedono a una liquidazione), per cui la visualizzazione dell'intero storico a volte generava confusione sull'attuale proprietà. Per evitare confusione, ora mostriamo solo i proprietari "attuali", ossia quelli che hanno effettuato un deposito nell'ultimo anno.

Upgrade to unlock premium data.

Data di deposito Modulo Investitore Azioni
precedenti
Ultime
azioni
Δ Azioni
(Percentuale)
Proprietà
(Percentuale)
Δ Proprietà
(Percentuale)
2025-08-14 13G Alyeska Investment Group, L.P. 2,354,239 5.56
2025-02-24 13G/A AXXCESS WEALTH MANAGEMENT, LLC 1,273,415 0 -100.00 0.00 -100.00
2025-02-07 13G/A CVI Investments, Inc. 3,010,000 1,285,410 -57.30 3.30 -56.58
2024-10-31 13G Seifert Stephen 1,648,146 5.20
Depositi 13F e NPORT

Le informazioni relative ai depositi 13F sono gratuite. Per accedere alle informazioni relative ai depositi NP è necessario un'abbonamento premium. Le righe verdi indicano le nuove posizioni. Le righe rosse indicano le posizioni chiuse. Fai clic sull'icona del link per visualizzare la cronologia completa delle transazioni.

Esegui l'upgrade per sbloccare i dati premium ed esportarli in Excel .

Data di deposito Fonte Investitore Tipo Prezzo medio
(Stima)
Azioni Δ Azioni
(%)
Valore
dichiarato
($ 1000)
Δ Valore
(%)
Allocazione del portafoglio
(%)
2025-08-08 13F Pnc Financial Services Group, Inc. 4.468 0,00 9 -10,00
2025-08-04 13F Spire Wealth Management 380.101 -4,20 779 -14,21
2025-07-15 13F Fortitude Family Office, LLC 590 1
2025-08-12 13F BlackRock, Inc. 324.167 25,01 665 11,97
2025-07-31 13F Caitong International Asset Management Co., Ltd 6.823 380,83 14 333,33
2025-08-14 13F Two Sigma Securities, Llc 0 -100,00 0 -100,00
2025-07-14 13F AdvisorNet Financial, Inc 233 0,00 0
2025-07-30 13F FNY Investment Advisers, LLC Put 0 -100,00 0
2025-05-21 13F/A Geneos Wealth Management Inc. 0 -100,00 0
2025-08-13 13F Marshall Wace, Llp 870.150 1.727,82 1.784 1.535,78
2025-08-14 13F Royal Bank Of Canada 8.754 503,72 18 500,00
2025-04-24 13F Wingate Wealth Advisors, Inc. 0 -100,00 0
2025-08-27 NP VEXMX - Vanguard Extended Market Index Fund Investor Shares This fund is a listed as child fund of Vanguard Group Inc and if that institution has disclosed ownership in this security, then these positions will not be double counted when calculating total shares and total value 441.935 0,00 906 -10,57
2025-08-11 13F Principal Securities, Inc. 500 0,00 1 -50,00
2025-08-14 13F Symmetry Peak Management Llc 12.220 25
2025-07-17 13F Beacon Capital Management, LLC 0 -100,00 0
2025-08-12 13F Financial Advocates Investment Management 10.270 -1,91 21 -8,70
2025-08-14 13F Harvest Investment Services, LLC 640.882 51,00 1.314 35,22
2025-08-14 13F Shay Capital LLC 28.516 46,12 58 31,82
2025-08-12 13F CIBC Private Wealth Group, LLC 178.241 0,00 365 16,61
2025-08-20 13F/A Coppell Advisory Solutions LLC 13.200 27
2025-05-12 13F Citigroup Inc 0 -100,00 0
2025-07-11 13F Farther Finance Advisors, LLC 100 0,00 0
2025-08-14 13F Jane Street Group, Llc Call 0 -100,00 0 -100,00
2025-07-22 13F Belpointe Asset Management LLC 698.315 -13,18 1.432 -22,27
2025-08-14 13F Engineers Gate Manager LP 0 -100,00 0
2025-08-14 13F Mariner, LLC 40.801 2,67 84 -8,79
2025-08-14 13F Qube Research & Technologies Ltd 0 -100,00 0
2025-07-25 13F Concurrent Investment Advisors, LLC 12.000 25
2025-07-31 13F Leavell Investment Management, Inc. 42.107 0,00 86 -10,42
2025-08-14 13F Group One Trading, L.p. 53.378 109
2025-07-22 13F Merit Financial Group, LLC 93.745 -0,21 192 -10,70
2025-08-14 13F Peak6 Llc 79.215 -0,59 162 -10,99
2025-08-14 13F Susquehanna International Group, Llp Call 170.900 -69,92 350 -73,10
2025-08-08 13F Cetera Investment Advisers 10.082 21
2025-07-16 13F Strategic Investment Solutions, Inc. /IL 10 0,00 0
2025-08-14 13F Toronto Dominion Bank 20.000 0,00 41 -8,89
2025-08-15 13F Tower Research Capital LLC (TRC) 4.590 -75,68 9 -79,07
2025-08-14 13F Citadel Advisors Llc Call 89.700 27,60 184 14,38
2025-08-14 13F Citadel Advisors Llc Put 50.900 14,90 104 2,97
2025-08-08 13F SG Americas Securities, LLC 0 -100,00 0
2025-08-14 13F Susquehanna International Group, Llp Put 145.600 -49,14 298 -54,50
2025-08-14 13F Susquehanna International Group, Llp 259.978 309,40 533 266,90
2025-08-08 13F Skaana Management L.P. Call 3.500 7
2025-05-01 13F Cwm, Llc 0 -100,00 0
2025-08-12 13F Proequities, Inc. 0 0
2025-08-18 13F N.E.W. Advisory Services LLC 850 21,43 2 0,00
2025-08-12 13F Coldstream Capital Management Inc 0 -100,00 0
2025-08-14 13F State Street Corp 155.210 14,71 318 2,91
2025-08-14 13F Bridgeway Capital Management Inc 22.000 0,00 45 -10,00
2025-08-12 13F Calton & Associates, Inc. 45.053 2,27 92 -8,00
2025-08-13 13F Quadrature Capital Ltd 11.066 23
2025-08-08 13F Skaana Management L.P. Put 100 0,00 0
2025-09-04 13F/A Advisor Group Holdings, Inc. 3.341 -25,02 7 -40,00
2025-08-18 13F Wolverine Trading, Llc Call 12.700 -58,09 26 -62,86
2025-08-18 13F Wolverine Trading, Llc Put 20.900 -11,44 43 -21,82
2025-08-12 13F Dynamic Technology Lab Private Ltd 0 -100,00 0
2025-08-18 13F Wolverine Trading, Llc 20.998 81,13 43 59,26
2025-08-05 13F GHP Investment Advisors, Inc. 100 0,00 0
2025-08-07 13F Winch Advisory Services, LLC 220 0,00 0
2025-03-26 NP SWTSX - Schwab Total Stock Market Index Fund This fund is a listed as child fund of Charles Schwab Investment Management Inc and if that institution has disclosed ownership in this security, then these positions will not be double counted when calculating total shares and total value 8.011 0,00 32 29,17
2025-08-08 13F SBI Securities Co., Ltd. 12.390 83,31 25 66,67
2025-08-13 13F OMERS ADMINISTRATION Corp 0 -100,00 0
2025-08-15 13F Morgan Stanley 1.129 -78,72 2 -83,33
2025-08-14 13F Two Sigma Investments, Lp 104.922 -20,66 215 -28,81
2025-08-13 13F EverSource Wealth Advisors, LLC 56 -44,00 0
2025-08-14 13F Raymond James Financial Inc 3.608 7
2025-08-14 13F Alyeska Investment Group, L.P. 2.354.239 24,45 4.826 11,40
2025-08-27 13F/A Squarepoint Ops LLC 0 -100,00 0 -100,00
2025-08-12 13F Park Square Financial Group, LLC 100 0,00 0
2025-08-11 13F Vanguard Group Inc 1.308.607 24,83 2.683 11,75
2025-08-26 NP EQ ADVISORS TRUST - 1290 VT Micro Cap Portfolio Class IB 6.276 776,54 13 1.100,00
2025-08-15 13F Prevail Innovative Wealth Advisors, Llc 115.810 0,00 237 -10,57
2025-08-27 NP VTSMX - Vanguard Total Stock Market Index Fund Investor Shares This fund is a listed as child fund of Vanguard Group Inc and if that institution has disclosed ownership in this security, then these positions will not be double counted when calculating total shares and total value 836.300 39,49 1.714 24,93
2025-07-24 NP FSMAX - Fidelity Extended Market Index Fund This fund is a listed as child fund of Fmr Llc and if that institution has disclosed ownership in this security, then these positions will not be double counted when calculating total shares and total value 164.384 34,88 353 8,95
2025-08-07 13F Allworth Financial LP 986 0,00 2 0,00
2025-05-15 13F 683 Capital Management, LLC 0 -100,00 0
2025-04-21 13F Nelson, Van Denburg & Campbell Wealth Management Group, LLC 0 -100,00 0
2025-08-12 13F XTX Topco Ltd 61.609 44,49 126 29,90
2025-08-13 13F Northern Trust Corp 75.146 -3,30 154 -12,99
2025-08-28 NP IWC - iShares Micro-Cap ETF This fund is a listed as child fund of BlackRock Inc. and if that institution has disclosed ownership in this security, then these positions will not be double counted when calculating total shares and total value 67.485 723,29 138 666,67
2025-05-15 13F Man Group plc 0 -100,00 0
2025-08-13 13F Vermillion & White Wealth Management Group, LLC 11 120,00 0
2025-05-15 13F Symmetry Peak Management Llc Call 0 -100,00 0 -100,00
2025-08-01 13F Belvedere Trading LLC 6.241 40,12 13 20,00
2025-08-01 13F Belvedere Trading LLC Call 17.400 -41,02 36 -47,76
2025-08-01 13F Belvedere Trading LLC Put 1.200 -92,05 2 -94,12
2025-08-14 13F Bank Of America Corp /de/ 18.045 0,46 37 -12,20
2025-05-14 13F Heights Capital Management, Inc 0 -100,00 0
2025-08-12 13F Dimensional Fund Advisors Lp 23.586 48
2025-05-16 13F/A Goldman Sachs Group Inc 0 -100,00 0 -100,00
2025-05-15 13F Millennium Management Llc 0 -100,00 0 -100,00
2025-07-24 NP FSKAX - Fidelity Total Market Index Fund This fund is a listed as child fund of Fmr Llc and if that institution has disclosed ownership in this security, then these positions will not be double counted when calculating total shares and total value 38.733 0,00 83 -19,42
2025-08-14 13F Meteora Capital, LLC 145.000 297
2025-08-14 13F Wells Fargo & Company/mn 4.851 4.702,97 10
2025-05-29 NP JAFEX - Total Stock Market Index Trust NAV 524 15,42 1 -50,00
2025-07-30 13F Bogart Wealth, LLC 17 0,00 0
2025-08-05 13F Simplex Trading, Llc 72.745 361,29 0
2025-08-14 13F Jane Street Group, Llc Put 12.900 -36,45 26 -43,48
2025-07-31 13F Sage Mountain Advisors LLC 72.925 0,76 149 -9,70
2025-08-08 13F Capital Investment Counsel, Inc 11.430 0,00 23 -11,54
2025-08-08 13F Geode Capital Management, Llc 333.355 13,02 683 1,19
2025-08-12 13F LPL Financial LLC 35.795 3,80 73 -6,41
2025-07-24 13F IFP Advisors, Inc 0 -100,00 0
2025-04-23 13F Fourth Dimension Wealth, LLC 0 -100,00 0
2025-08-27 NP VITNX - Vanguard Institutional Total Stock Market Index Fund Institutional Shares This fund is a listed as child fund of Vanguard Group Inc and if that institution has disclosed ownership in this security, then these positions will not be double counted when calculating total shares and total value 23.585 48
2025-08-14 13F Jane Street Group, Llc 0 -100,00 0 -100,00
2025-08-14 13F UBS Group AG 480.471 395,72 985 345,25
2025-04-01 13F Modus Advisors, LLC 0 -100,00 0 -100,00
2025-07-16 13F Signaturefd, Llc 0 -100,00 0
2025-08-08 13F Hartland & Co., LLC 2.105 0,00 4 0,00
2025-08-13 13F Sepio Capital, LP 1.203.704 2.468
2025-08-15 13F CI Private Wealth, LLC 52.000 107
2025-04-11 13F Gleason Group, Inc. 0 -100,00 0
2025-08-12 13F Steward Partners Investment Advisory, Llc 238 11,74 0
2025-08-13 13F Jones Financial Companies Lllp 1.425 0,00 3 -33,33
2025-04-11 13F Oxinas Partners Wealth Management LLC 0 -100,00 0 -100,00
2025-08-14 13F Cubist Systematic Strategies, LLC 0 -100,00 0
2025-08-12 13F PSI Advisors, LLC 0 -100,00 0
2025-08-12 13F SRS Capital Advisors, Inc. 1.150 2
2025-08-14 13F Citadel Advisors Llc 0 -100,00 0 -100,00
2025-05-14 13F Peak6 Llc Call 0 -100,00 0 -100,00
2025-07-25 13F JustInvest LLC 10.200 21
2025-08-26 NP BRSIX - Ultra-Small Company Market Fund Class N 22.000 0,00 45 -10,00
2025-07-24 NP FCFMX - Fidelity Series Total Market Index Fund This fund is a listed as child fund of Fmr Llc and if that institution has disclosed ownership in this security, then these positions will not be double counted when calculating total shares and total value 55.751 93,64 120 56,58
2025-08-07 13F Hughes Financial Services, LLC 0 -100,00 0
2025-04-23 13F Mascagni Wealth Management, Inc. 0 -100,00 0
Fintel data has been cited in the following publications:
Daily Mail Fox Business Business Insider Wall Street Journal The Washington Post Bloomberg Financial Times Globe and Mail
NASDAQ.com Reuters The Guardian Associated Press FactCheck.org Snopes Politifact
Federal Register The Intercept Forbes Fortune Magazine TheStreet Time Magazine Canadian Broadcasting Corporation International Business Times
Cambridge University Press Investopedia MarketWatch NY Daily News Entrepreneur Newsweek Barron's El Economista