Statistiche di base
| Proprietari istituzionali | 173 total, 173 long only, 0 short only, 0 long/short - change of 8,12% MRQ |
| Allocazione media del portafoglio | 0.6711 % - change of -1,52% MRQ |
| Azioni istituzionali (Long) | 59.990.784 (ex 13D/G) - change of 16,26MM shares 37,19% MRQ |
| Valore istituzionale (Long) | $ 1.996.220 USD ($1000) |
Proprietà istituzionale e azionisti
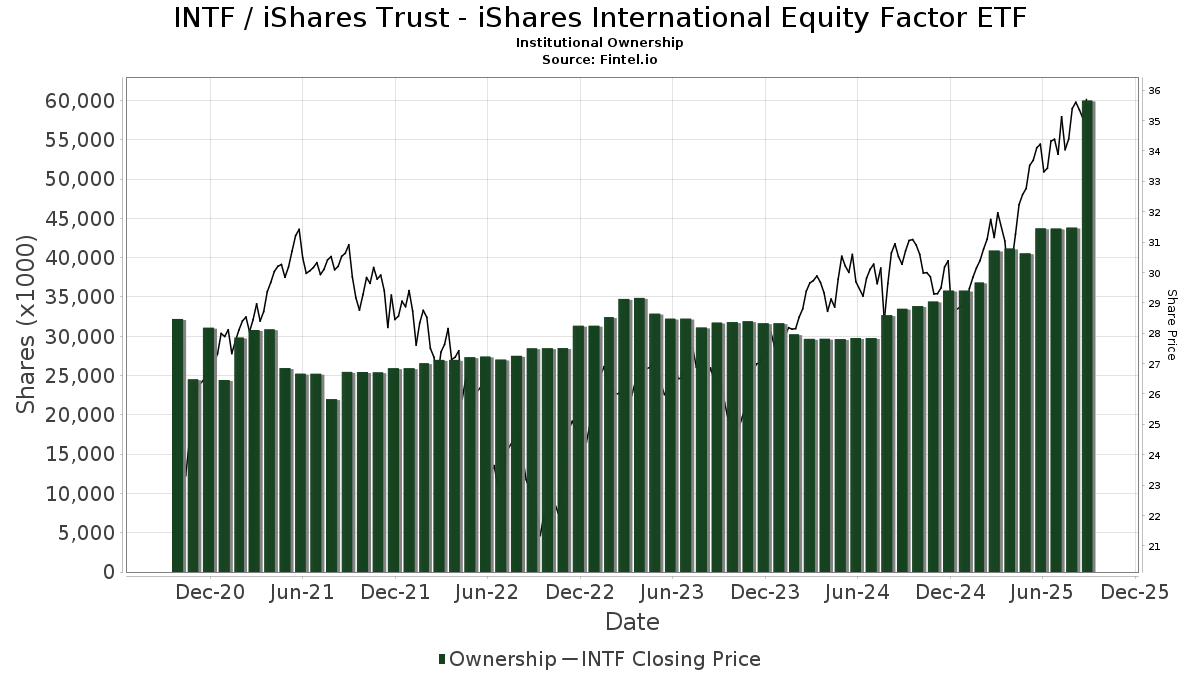
iShares Trust - iShares International Equity Factor ETF (US:INTF) ha 173 proprietari istituzionali e azionisti che hanno presentato i moduli 13D/G o 13F alla Securities Exchange Commission (SEC). Queste istituzioni detengono un totale di 59,990,784 azioni. I maggiori azionisti includono Northwestern Mutual Wealth Management Co, Strategic Financial Services, Inc,, Halbert Hargrove Global Advisors, Llc, Tolleson Wealth Management, Inc., Invesco Ltd., Clearwater Capital Advisors, LLC, Atomi Financial Group, Inc., Jpmorgan Chase & Co, Integrated Wealth Concepts LLC, and Kestra Investment Management, LLC .
(iShares Trust - iShares International Equity Factor ETF (ARCA:INTF) la struttura proprietaria istituzionale mostra le attuali posizioni nella società da parte di istituzioni e fondi, nonché le ultime variazioni nella dimensione della posizione. I principali azionisti possono essere singoli investitori, fondi comuni, hedge fund o istituzioni. L'allegato 13D indica che l'investitore detiene (o ha detenuto) più del 5% della società e intende (o intendeva) perseguire attivamente un cambiamento nella strategia aziendale. L'allegato 13G indica un investimento passivo superiore al 5%.
The share price as of September 5, 2025 is 35,41 / share. Previously, on September 6, 2024, the share price was 30,00 / share. This represents an increase of 18,03% over that period.
Indice del sentiment dei fondi
L'indice del sentiment dei fondi (anche noto come "indice di accumulo di proprietà") individua i titoli più acquistati dai fondi. È il risultato di un sofisticato modello quantitativo multi-fattore che identifica le società con i più alti livelli di accumulo istituzionale. Il modello utilizza una combinazione dell'aumento totale dei proprietari dichiarati, delle variazioni nelle allocazioni di portafoglio di tali proprietari e di altre metriche. Il punteggio varia da 0 a 100: i numeri più alti indicano un livello di accumulo superiore ad altre società, mentre 50 rappresenta la media.
Frequenza di aggiornamento: giornaliera
Consulta Ownership Explorer per visualizzare l'elenco delle aziende con il ranking più alto.
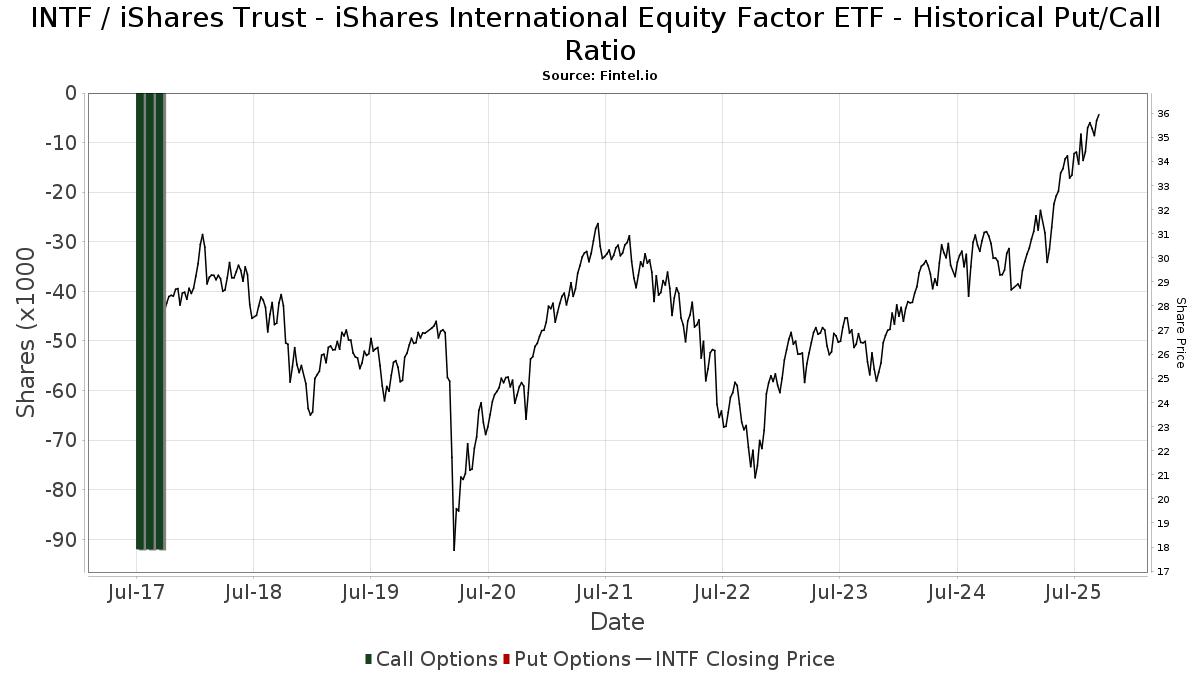
Rapporto put/call istituzionale
Oltre a segnalare le emissioni standard di titoli azionari e di debito, gli istituti con più di 100 milioni di asset in gestione devono anche dichiarare le loro partecipazioni in opzioni put e call. Poiché le opzioni put indicano generalmente un sentiment negativo e le opzioni call un sentiment positivo, possiamo avere un'idea del sentiment istituzionale complessivo attraverso il rapporto tra put e call. Il grafico a destra mostra il rapporto storico put/call per questo strumento.
L'utilizzo del rapporto put/call come indicatore del sentiment degli investitori consente di superare una delle principali lacune dell'utilizzo della proprietà istituzionale totale, ovvero il fatto che una quantità significativa di asset in gestione viene investita passivamente per seguire gli indici. Generalmente, i fondi a gestione passiva non acquistano opzioni, per cui il rapporto put/call riflette più fedelmente il sentiment dei fondi a gestione attiva.
Depositi 13F e NPORT
Le informazioni relative ai depositi 13F sono gratuite. Per accedere alle informazioni relative ai depositi NP è necessario un'abbonamento premium. Le righe verdi indicano le nuove posizioni. Le righe rosse indicano le posizioni chiuse. Fai clic sull'icona del link per visualizzare la cronologia completa delle transazioni.
Esegui l'upgrade
per sbloccare i dati premium ed esportarli in Excel ![]() .
.
| Data di deposito | Fonte | Investitore | Tipo | Prezzo medio (Stima) |
Azioni | Δ Azioni (%) |
Valore dichiarato ($ 1000) |
Δ Valore (%) |
Allocazione del portafoglio (%) |
|
|---|---|---|---|---|---|---|---|---|---|---|
| 2025-07-16 | 13F/A | CX Institutional | 7.469 | 1,69 | 0 | |||||
| 2025-08-13 | 13F | Beacon Pointe Advisors, LLC | 12.815 | 0,04 | 439 | 10,89 | ||||
| 2025-08-08 | 13F | Kingsview Wealth Management, LLC | 70.527 | -0,62 | 2.414 | 10,33 | ||||
| 2025-07-18 | 13F | SigFig Wealth Management, LLC | 123.649 | 3,95 | 4.225 | 14,22 | ||||
| 2025-05-07 | 13F | Horan Capital Advisors, LLC. | 6.642 | 205 | ||||||
| 2025-07-21 | 13F | HighMark Wealth Management LLC | 151 | 5 | ||||||
| 2025-04-21 | 13F | Nelson, Van Denburg & Campbell Wealth Management Group, LLC | 0 | -100,00 | 0 | -100,00 | ||||
| 2025-08-07 | 13F | Brio Consultants, LLC | 241.659 | 11,93 | 8.272 | 24,23 | ||||
| 2025-07-24 | 13F | Capital Advisors, Ltd. LLC | 13.268 | 0,23 | 0 | |||||
| 2025-08-14 | 13F | Operose Advisors LLC | 800 | 0,00 | 27 | 12,50 | ||||
| 2025-07-31 | 13F | AlTi Global, Inc. | 84.127 | -36,23 | 2.880 | -29,23 | ||||
| 2025-07-16 | 13F | New Insight Wealth Advisors | 19.982 | 41,93 | 684 | 57,37 | ||||
| 2025-08-14 | 13F | Mariner, LLC | 81.369 | 2,58 | 2.785 | 13,86 | ||||
| 2025-08-06 | 13F | North Capital, Inc. | 108 | 1,89 | 4 | 0,00 | ||||
| 2025-06-26 | NP | FINT - Frontier Asset Total International Equity ETF | 229.075 | -10,71 | 7.383 | -3,75 | ||||
| 2025-07-08 | 13F | RMR Wealth Builders | 9.874 | 338 | ||||||
| 2025-07-17 | 13F | LexAurum Advisors, LLC | 21.763 | -2,50 | 745 | 8,14 | ||||
| 2025-08-19 | 13F | Advisory Services Network, LLC | 6.000 | 203 | ||||||
| 2025-07-14 | 13F | U.S. Capital Wealth Advisors, LLC | 21.320 | 30,40 | 730 | 44,64 | ||||
| 2025-08-11 | 13F | Westover Capital Advisors, LLC | 0 | -100,00 | 0 | |||||
| 2025-08-13 | 13F | Cerity Partners LLC | 71.293 | -1,70 | 2.440 | 9,12 | ||||
| 2025-08-11 | 13F | Strategic Wealth Partners, Ltd. | 976 | 33 | ||||||
| 2025-08-12 | 13F | Blueprint Investment Partners LLC | 0 | -100,00 | 0 | |||||
| 2025-08-12 | 13F | Ascent Wealth Partners, LLC | 16.085 | 0,00 | 551 | 10,89 | ||||
| 2025-08-14 | 13F | Aqr Capital Management Llc | 36.543 | 19,66 | 1.251 | 32,84 | ||||
| 2025-08-01 | 13F | Strategic Financial Services, Inc, | 8.575.507 | -0,95 | 293.540 | 9,94 | ||||
| 2025-08-06 | 13F | AE Wealth Management LLC | 25 | 0,00 | 1 | |||||
| 2025-07-10 | 13F | Exchange Traded Concepts, Llc | 236.515 | -1,27 | 8.096 | 9,58 | ||||
| 2025-08-14 | 13F | Royal Bank Of Canada | 13.033 | 74,85 | 446 | 93,07 | ||||
| 2025-08-28 | 13F/A | Tolleson Wealth Management, Inc. | 2.851.077 | 4,34 | 97.592 | 15,81 | ||||
| 2025-05-14 | 13F | Van Hulzen Asset Management, LLC | 0 | -100,00 | 0 | -100,00 | ||||
| 2025-08-13 | 13F | Russell Investments Group, Ltd. | 831 | 28 | ||||||
| 2025-08-14 | 13F | Jane Street Group, Llc | 381.780 | 26,84 | 13.068 | 40,79 | ||||
| 2025-08-14 | 13F | Mml Investors Services, Llc | 12.246 | 1,44 | 0 | |||||
| 2025-08-07 | 13F | Vise Technologies, Inc. | 26.213 | 897 | ||||||
| 2025-08-07 | 13F | Weil Company, Inc. | 412.946 | 16,61 | 14.135 | 29,43 | ||||
| 2025-07-15 | 13F | EWG Elevate Inc. | 59.564 | 363,93 | 2.039 | 415,95 | ||||
| 2025-05-14 | 13F | CIBC Private Wealth Group, LLC | 0 | -100,00 | 0 | |||||
| 2025-07-08 | 13F | Baker Ellis Asset Management LLC | 27.800 | -9,74 | 952 | 0,21 | ||||
| 2025-08-13 | 13F | Summit Financial, LLC | 18.691 | -23,82 | 640 | -15,48 | ||||
| 2025-04-11 | 13F | Princeton Global Asset Management LLC | 0 | -100,00 | 0 | |||||
| 2025-08-14 | 13F | Susquehanna International Group, Llp | 76.066 | 63,18 | 2.604 | 81,14 | ||||
| 2025-08-14 | 13F | CIBC World Markets Inc. | 12.196 | 417 | ||||||
| 2025-08-07 | 13F | Allworth Financial LP | 2.020 | -6,09 | 69 | 1,47 | ||||
| 2025-08-14 | 13F | Atomi Financial Group, Inc. | 1.771.706 | 2,44 | 60.645 | 13,70 | ||||
| 2025-07-17 | 13F | HB Wealth Management, LLC | 14.015 | 63,54 | 480 | 81,44 | ||||
| 2025-08-14 | 13F | UBS Group AG | 441.395 | 1,91 | 15.109 | 13,11 | ||||
| 2025-08-14 | 13F | Diversify Advisory Services, LLC | 59.350 | 30,35 | 2.087 | 42,10 | ||||
| 2025-08-05 | 13F | Landmark Wealth Management, Inc. | 31.371 | 0,00 | 1.074 | 10,96 | ||||
| 2025-07-31 | 13F | Buckingham Strategic Partners | 6.051 | -7,79 | 207 | 2,48 | ||||
| 2025-08-06 | 13F | Commonwealth Equity Services, Llc | 91.289 | -8,20 | 3 | 0,00 | ||||
| 2025-07-10 | 13F | Orgel Wealth Management, LLC | 8.733 | 0,48 | 299 | 11,19 | ||||
| 2025-07-29 | 13F | Fundamentun, Llc | 61.760 | -3,27 | 2.114 | 7,42 | ||||
| 2025-08-15 | 13F | CI Private Wealth, LLC | 879.447 | -2,15 | 30.103 | 8,61 | ||||
| 2025-07-28 | 13F | ForthRight Wealth Management, LLC | 9.872 | 0,00 | 338 | 10,86 | ||||
| 2025-08-11 | 13F | Wealthspire Advisors, LLC | 13.158 | 0,91 | 450 | 11,94 | ||||
| 2025-08-14 | 13F | Qube Research & Technologies Ltd | 0 | -100,00 | 0 | |||||
| 2025-08-14 | 13F | Ameriprise Financial Inc | 1.059.484 | 61,24 | 36.264 | 78,96 | ||||
| 2025-08-14 | 13F/A | Rockefeller Capital Management L.P. | 65.252 | -1,58 | 2.234 | 9,25 | ||||
| 2025-08-12 | 13F | MAI Capital Management | 325 | 0,00 | 11 | 10,00 | ||||
| 2025-08-06 | 13F | HORAN Wealth, LLC | 6.642 | 227 | ||||||
| 2025-08-13 | 13F | Northwestern Mutual Wealth Management Co | 15.878.455 | 54.816,15 | 543.519 | 60.901,01 | ||||
| 2025-08-14 | 13F | Citadel Advisors Llc | 42.097 | 136,09 | 1.441 | 162,30 | ||||
| 2025-08-14 | 13F | Raymond James Financial Inc | 948.892 | -1,46 | 32.481 | 9,37 | ||||
| 2025-08-06 | 13F | DDFG, Inc | 226.977 | 1,97 | 7.769 | 13,18 | ||||
| 2025-07-31 | 13F | Cambridge Investment Research Advisors, Inc. | 88.910 | 31,82 | 3 | 50,00 | ||||
| 2025-08-13 | 13F | Flow Traders U.s. Llc | 0 | -100,00 | 0 | |||||
| 2025-08-14 | 13F | Colony Group, LLC | 123.915 | 65,82 | 4.242 | 84,07 | ||||
| 2025-08-14 | 13F | Mercer Global Advisors Inc /adv | 0 | -100,00 | 0 | |||||
| 2025-07-17 | 13F | Janney Montgomery Scott LLC | 18.765 | 0,00 | 1 | |||||
| 2025-07-24 | 13F | Us Bancorp \de\ | 3.977 | 0,00 | 136 | 11,48 | ||||
| 2025-08-04 | 13F | Atria Investments Llc | 101.440 | -8,11 | 3.472 | 2,00 | ||||
| 2025-07-17 | 13F | Halbert Hargrove Global Advisors, Llc | 3.195.954 | 0,44 | 109.397 | 11,47 | ||||
| 2025-08-05 | 13F | Meridian Management Co | 267.156 | -5,70 | 9.030 | 3,34 | ||||
| 2025-08-11 | 13F | HighTower Advisors, LLC | 273.723 | 5,08 | 9.370 | 16,63 | ||||
| 2025-04-16 | 13F | Smithbridge Asset Management Inc/de | 0 | -100,00 | 0 | -100,00 | ||||
| 2025-08-06 | 13F | Quadrant Private Wealth Management, LLC | 0 | -100,00 | 0 | |||||
| 2025-08-14 | 13F | Wells Fargo & Company/mn | 561.257 | -36,09 | 19.212 | -29,07 | ||||
| 2025-09-04 | 13F/A | Advisor Group Holdings, Inc. | 123.437 | 974,95 | 4.209 | 1.088,70 | ||||
| 2025-07-25 | 13F | Cwm, Llc | 851.829 | -6,62 | 29 | 3,57 | ||||
| 2025-07-25 | 13F | Hemington Wealth Management | 871 | 0,00 | 0 | |||||
| 2025-08-11 | 13F | Aptus Capital Advisors, LLC | 11.092 | 0,03 | 380 | 11,14 | ||||
| 2025-07-21 | 13F | Ameriflex Group, Inc. | 194 | 0,00 | 7 | 20,00 | ||||
| 2025-08-15 | 13F | Captrust Financial Advisors | 94.543 | 0,00 | 3.236 | 11,01 | ||||
| 2025-07-11 | 13F | Rockwood Wealth Management, LLC | 10.000 | 0,00 | 342 | 11,04 | ||||
| 2025-08-13 | 13F | Northern Trust Corp | 8.320 | 0,00 | 285 | 10,94 | ||||
| 2025-07-28 | 13F | Harbour Investments, Inc. | 30 | 1 | ||||||
| 2025-07-07 | 13F | Versant Capital Management, Inc | 4.452 | 0,00 | 152 | 10,95 | ||||
| 2025-07-24 | 13F | Blair William & Co/il | 125 | 0,00 | 4 | 33,33 | ||||
| 2025-08-18 | 13F/A | Kestra Investment Management, LLC | 1.237.354 | -45,98 | 42.355 | -40,04 | ||||
| 2025-04-23 | 13F | Mascagni Wealth Management, Inc. | 0 | -100,00 | 0 | -100,00 | ||||
| 2025-08-06 | 13F | Horan Securities, Inc. | 6.642 | 0,00 | 227 | 11,27 | ||||
| 2025-07-29 | 13F | Foster & Motley Inc | 410.664 | -11,87 | 14 | 0,00 | ||||
| 2025-07-25 | 13F | JustInvest LLC | 9.495 | -0,01 | 325 | 11,30 | ||||
| 2025-08-06 | 13F | Stokes Family Office, LLC | 807.176 | 41,47 | 27.630 | 57,03 | ||||
| 2025-08-12 | 13F | J.w. Cole Advisors, Inc. | 15.620 | 10,69 | 535 | 22,76 | ||||
| 2025-04-23 | 13F | Legacy Advisors, LLC | 0 | -100,00 | 0 | |||||
| 2025-08-01 | 13F | Envestnet Asset Management Inc | 1.055.237 | 8,29 | 36.121 | 20,20 | ||||
| 2025-05-12 | 13F | Independent Advisor Alliance | 0 | -100,00 | 0 | |||||
| 2025-08-12 | 13F | O'shaughnessy Asset Management, Llc | 7.005 | -14,27 | 240 | -4,78 | ||||
| 2025-08-14 | 13F | Obsido Oy | 259.933 | 1,66 | 8.898 | 12,83 | ||||
| 2025-08-14 | 13F | Ancora Advisors, LLC | 563 | 19 | ||||||
| 2025-07-10 | 13F | Sovran Advisors, LLC | 6.072 | 208 | ||||||
| 2025-08-15 | 13F | Morgan Stanley | 655.614 | -4,16 | 22.442 | 6,37 | ||||
| 2025-08-01 | 13F | First Command Advisory Services, Inc. | 760.428 | 3,89 | 26.029 | 15,03 | ||||
| 2025-08-14 | 13F | Smartleaf Asset Management LLC | 448 | -94,52 | 15 | -94,09 | ||||
| 2025-07-29 | 13F | Signature Estate & Investment Advisors Llc | 56.319 | -36,37 | 1.928 | -29,39 | ||||
| 2025-05-09 | 13F | Wade Financial Advisory, Inc | 318.745 | 9,44 | 9.830 | 17,53 | ||||
| 2025-08-06 | 13F | Savant Capital, LLC | 28.975 | -12,81 | 992 | -3,22 | ||||
| 2025-07-11 | 13F | Farther Finance Advisors, LLC | 203.335 | 8,57 | 6.960 | 20,25 | ||||
| 2025-08-13 | 13F | Avestar Capital, LLC | 145.907 | 28,85 | 4.994 | 43,01 | ||||
| 2025-07-10 | 13F | Wedmont Private Capital | 30.272 | 0,02 | 1.041 | 15,04 | ||||
| 2025-07-14 | 13F | Park Avenue Securities Llc | 9.570 | -0,57 | 0 | |||||
| 2025-07-14 | 13F | Seascape Capital Management | 13.851 | 2,37 | 0 | |||||
| 2025-07-21 | 13F | Pflug Koory, LLC | 500 | 0,00 | 17 | 13,33 | ||||
| 2025-08-12 | 13F | Clearwater Capital Advisors, LLC | 1.843.707 | -0,53 | 63.110 | 10,41 | ||||
| 2025-08-11 | 13F | Wescott Financial Advisory Group, LLC | 10.665 | -5,45 | 365 | 5,19 | ||||
| 2025-07-22 | 13F | Merit Financial Group, LLC | 15.104 | 1,68 | 517 | 12,88 | ||||
| 2025-08-27 | 13F | Stonebridge Wealth Management, LLC | 65.845 | 2.254 | ||||||
| 2025-08-14 | 13F | Financial Engines Advisors L.L.C. | 6.141 | 210 | ||||||
| 2025-08-08 | 13F | Cetera Investment Advisers | 11.238 | -21,93 | 385 | -13,32 | ||||
| 2025-08-12 | 13F | LPL Financial LLC | 250.523 | 179,48 | 8.575 | 210,24 | ||||
| 2025-07-10 | 13F | Sterling Financial Group, Inc. | 623.742 | 39,57 | 21.351 | 54,91 | ||||
| 2025-07-28 | 13F | Sagespring Wealth Partners, Llc | 148.756 | 19,17 | 5.092 | 32,27 | ||||
| 2025-08-12 | 13F | Proequities, Inc. | 0 | 0 | ||||||
| 2025-08-08 | 13F | Pnc Financial Services Group, Inc. | 1.466 | 0,00 | 50 | 11,11 | ||||
| 2025-08-11 | 13F | Citigroup Inc | 4.095 | 45,11 | 140 | 60,92 | ||||
| 2025-07-23 | 13F | Heck Capital Advisors, LLC | 59.956 | -42,41 | 2.052 | -36,07 | ||||
| 2025-08-08 | 13F | Avantax Advisory Services, Inc. | 19.799 | 0,09 | 678 | 10,98 | ||||
| 2025-08-14 | 13F | Wiley Bros.-aintree Capital, Llc | 10.817 | 0,00 | 370 | 10,12 | ||||
| 2025-08-07 | 13F | CENTRAL TRUST Co | 1.046 | 0,00 | 36 | 9,38 | ||||
| 2025-07-24 | 13F | IFP Advisors, Inc | 1.267 | 0,48 | 43 | 13,16 | ||||
| 2025-07-09 | 13F | Thrive Wealth Management, LLC | 341.743 | -6,75 | 11.698 | 3,49 | ||||
| 2025-08-14 | 13F | Integrated Wealth Concepts LLC | 1.344.337 | 11,10 | 46.017 | 23,31 | ||||
| 2025-07-18 | 13F | Bartlett & Co. Wealth Management Llc | 460 | -87,80 | 16 | -87,07 | ||||
| 2025-08-14 | 13F | Fmr Llc | 5.453 | 6,57 | 187 | 18,47 | ||||
| 2025-08-12 | 13F | Inscription Capital, LLC | 0 | -100,00 | 0 | |||||
| 2025-08-14 | 13F | Sunbelt Securities, Inc. | 197 | 0,00 | 6 | -16,67 | ||||
| 2025-08-13 | 13F | Summit Wealth Group Llc / Co | 13.052 | 447 | ||||||
| 2025-08-18 | 13F/A | National Bank Of Canada /fi/ | 5.964 | 0,00 | 204 | 11,48 | ||||
| 2025-08-13 | 13F | Colonial Trust Advisors | 520 | 0,00 | 18 | 6,25 | ||||
| 2025-08-13 | 13F | SageView Advisory Group, LLC | 8.228 | -0,66 | 282 | 10,59 | ||||
| 2025-07-09 | 13F | Archer Investment Management, LLC | 32.517 | -22,12 | 1.113 | -13,52 | ||||
| 2025-08-13 | 13F | Mount Yale Investment Advisors, LLC | 34.102 | 1.167 | ||||||
| 2025-07-31 | 13F | Cabot Wealth Management Inc | 56.430 | 1,28 | 1.932 | 12,40 | ||||
| 2025-08-27 | 13F | Barnes Wealth Management Group, Inc | 7.560 | -2,70 | 259 | 7,95 | ||||
| 2025-04-29 | 13F | Callan Capital, LLC | 749.022 | -2,67 | 23.100 | 4,52 | ||||
| 2025-08-05 | 13F | Dynasty Wealth Management, Llc | 108.416 | -12,15 | 3.711 | -2,47 | ||||
| 2025-08-19 | 13F | Newbridge Financial Services Group, Inc. | 27.544 | 943 | ||||||
| 2025-08-13 | 13F | GeoWealth Management, LLC | 10.847 | -13,29 | 371 | -3,64 | ||||
| 2025-08-07 | 13F | Parkside Financial Bank & Trust | 3.450 | 0,00 | 118 | 11,32 | ||||
| 2025-08-08 | 13F | Horizon Family Wealth, Inc. | 129.770 | 0,16 | 4.442 | 11,19 | ||||
| 2025-08-12 | 13F | Jpmorgan Chase & Co | 1.485.415 | 0,00 | 50.846 | 10,99 | ||||
| 2025-08-15 | 13F | Kestra Advisory Services, LLC | 90.606 | 1.085,32 | 3.101 | 1.219,57 | ||||
| 2025-07-10 | 13F | Wealth Enhancement Advisory Services, Llc | 7.206 | -39,28 | 247 | -32,51 | ||||
| 2025-08-13 | 13F | Invesco Ltd. | 2.520.000 | 0,00 | 86.260 | 10,99 | ||||
| 2025-04-10 | 13F | Retirement Planning Group | 0 | -100,00 | 0 | |||||
| 2025-08-14 | 13F | Modern Wealth Management, LLC | 750.747 | -2,90 | 25.698 | 7,78 | ||||
| 2025-04-22 | 13F/A | NorthRock Partners, LLC | 0 | -100,00 | 0 | -100,00 | ||||
| 2025-07-24 | 13F | GFG Capital, LLC | 0 | 0 | ||||||
| 2025-07-25 | 13F | RHS Financial, LLC | 120.956 | 22,83 | 4.140 | 36,36 | ||||
| 2025-08-05 | 13F | Magnolia Capital Advisors Llc | 45.591 | 26,35 | 1.561 | 40,29 | ||||
| 2025-07-31 | 13F | Sage Mountain Advisors LLC | 42.634 | 1,96 | 1.459 | 13,19 | ||||
| 2025-08-08 | 13F | Gts Securities Llc | 21.199 | 726 | ||||||
| 2025-08-14 | 13F | EP Wealth Advisors, Inc. | 7.248 | 0,01 | 248 | 11,21 | ||||
| 2025-08-14 | 13F | GWM Advisors LLC | 18.448 | -18,00 | 631 | -8,95 | ||||
| 2025-07-29 | 13F | Private Trust Co Na | 827 | 28 | ||||||
| 2025-08-11 | 13F | CFS Investment Advisory Services, LLC | 30.824 | -10,31 | 1 | 0,00 | ||||
| 2025-08-08 | 13F | Creative Planning | 70.731 | -0,94 | 2.421 | 9,95 | ||||
| 2025-07-30 | 13F | Phillips Financial Management, Llc | 318.396 | -19,45 | 10.899 | -10,61 | ||||
| 2025-08-11 | 13F | Principal Securities, Inc. | 37.914 | 5.129,52 | 1.298 | 6.385,00 | ||||
| 2025-08-06 | 13F | Mark Sheptoff Financial Planning, Llc | 35 | 0,00 | 1 | 0,00 | ||||
| 2025-08-04 | 13F | Beirne Wealth Consulting Services, LLC | 108.240 | 2,37 | 3.706 | 13,62 | ||||
| 2025-08-14 | 13F | Bank Of America Corp /de/ | 337.171 | 1,67 | 11.541 | 12,85 | ||||
| 2025-07-25 | 13F | Concord Wealth Partners | 0 | -100,00 | 0 | |||||
| 2025-08-05 | 13F | Sigma Planning Corp | 26.603 | 911 | ||||||
| 2025-07-23 | 13F | Armbruster Capital Management, Inc. | 32.775 | 39,02 | 1.122 | 54,20 | ||||
| 2025-07-16 | 13F | Signature Resources Capital Management, LLC | 1.576 | 0,00 | 54 | 10,42 | ||||
| 2025-08-06 | 13F | Stone House Investment Management, LLC | 1.069 | 37 | ||||||
| 2025-08-15 | 13F | Equitable Holdings, Inc. | 113.540 | 37,21 | 3.886 | 52,27 | ||||
| 2025-07-23 | 13F | Citizens National Bank Trust Department | 135.288 | -1,23 | 4.631 | 9,61 | ||||
| 2025-08-13 | 13F | Jones Financial Companies Lllp | 123.974 | 23,30 | 4.236 | 35,51 | ||||
| 2025-07-24 | 13F | Edge Financial Advisors LLC | 33.340 | -17,02 | 1.141 | -7,91 | ||||
| 2025-08-14 | 13F | Snowden Capital Advisors LLC | 9.982 | 0,00 | 342 | 11,07 | ||||
| 2025-07-14 | 13F | GAMMA Investing LLC | 1.006 | 0,00 | 34 | 9,68 | ||||
| 2025-08-04 | 13F | Assetmark, Inc | 101 | -95,58 | 3 | -95,71 | ||||
| 2025-07-09 | 13F | Lincoln Capital Corp | 46.920 | -2,50 | 1.606 | 8,22 | ||||
| 2025-07-14 | 13F | Acropolis Investment Management, LLC | 301.413 | 4,14 | 10.317 | 15,60 | ||||
| 2025-08-14 | 13F | 10Elms LLP | 2.069 | 0,00 | 71 | 11,11 | ||||
| 2025-08-08 | 13F | Capital Investment Advisory Services, LLC | 8.160 | -60,28 | 279 | -55,92 | ||||
| 2025-08-12 | 13F | Global Retirement Partners, LLC | 220 | 0,00 | 8 | 16,67 | ||||
| 2025-08-11 | 13F | Private Advisor Group, LLC | 6.395 | 219 | ||||||
| 2025-08-14 | 13F/A | Skopos Labs, Inc. | 395 | 14 |