Statistiche di base
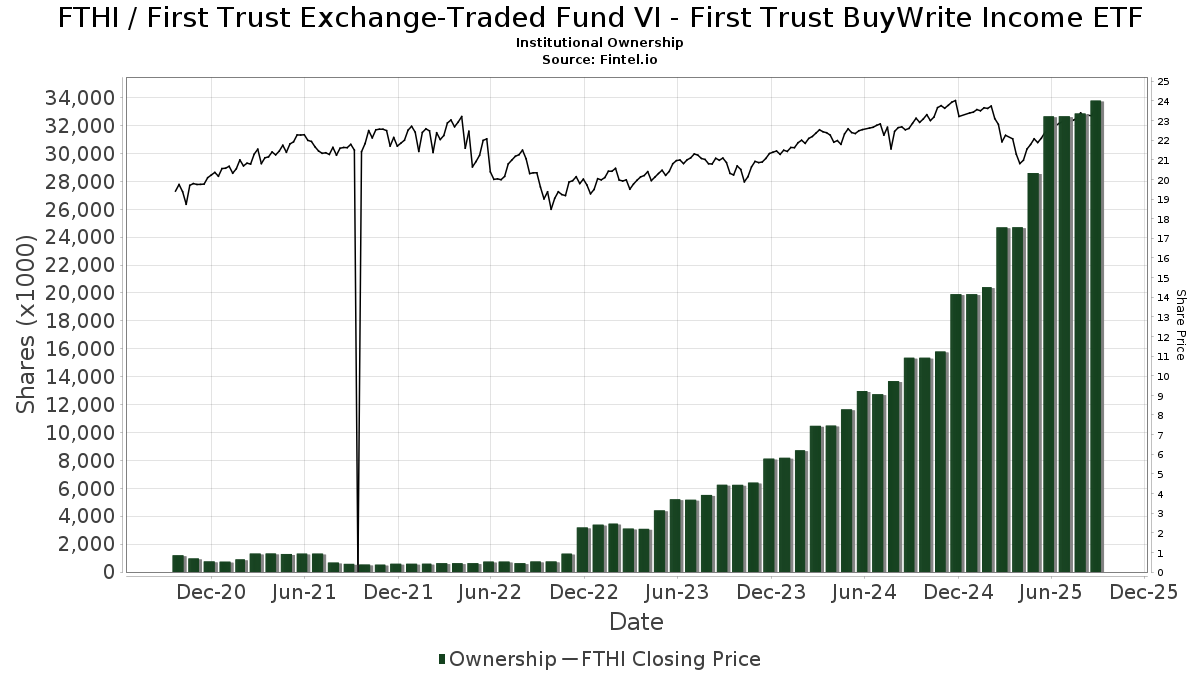
| Proprietari istituzionali | 173 total, 173 long only, 0 short only, 0 long/short - change of 4,85% MRQ |
| Allocazione media del portafoglio | 0.3908 % - change of 20,14% MRQ |
| Azioni istituzionali (Long) | 33.789.586 (ex 13D/G) - change of 1,13MM shares 3,46% MRQ |
| Valore istituzionale (Long) | $ 710.594 USD ($1000) |
Proprietà istituzionale e azionisti
First Trust Exchange-Traded Fund VI - First Trust BuyWrite Income ETF (US:FTHI) ha 173 proprietari istituzionali e azionisti che hanno presentato i moduli 13D/G o 13F alla Securities Exchange Commission (SEC). Queste istituzioni detengono un totale di 33,789,586 azioni. I maggiori azionisti includono LPL Financial LLC, Wells Fargo & Company/mn, Envestnet Asset Management Inc, Raymond James Financial Inc, D.a. Davidson & Co., Janney Montgomery Scott LLC, Royal Bank Of Canada, Cetera Investment Advisers, Stifel Financial Corp, and Cambridge Investment Research Advisors, Inc. .
(First Trust Exchange-Traded Fund VI - First Trust BuyWrite Income ETF (NasdaqGM:FTHI) la struttura proprietaria istituzionale mostra le attuali posizioni nella società da parte di istituzioni e fondi, nonché le ultime variazioni nella dimensione della posizione. I principali azionisti possono essere singoli investitori, fondi comuni, hedge fund o istituzioni. L'allegato 13D indica che l'investitore detiene (o ha detenuto) più del 5% della società e intende (o intendeva) perseguire attivamente un cambiamento nella strategia aziendale. L'allegato 13G indica un investimento passivo superiore al 5%.
The share price as of September 5, 2025 is 23,39 / share. Previously, on September 9, 2024, the share price was 22,42 / share. This represents an increase of 4,33% over that period.
Indice del sentiment dei fondi
L'indice del sentiment dei fondi (anche noto come "indice di accumulo di proprietà") individua i titoli più acquistati dai fondi. È il risultato di un sofisticato modello quantitativo multi-fattore che identifica le società con i più alti livelli di accumulo istituzionale. Il modello utilizza una combinazione dell'aumento totale dei proprietari dichiarati, delle variazioni nelle allocazioni di portafoglio di tali proprietari e di altre metriche. Il punteggio varia da 0 a 100: i numeri più alti indicano un livello di accumulo superiore ad altre società, mentre 50 rappresenta la media.
Frequenza di aggiornamento: giornaliera
Consulta Ownership Explorer per visualizzare l'elenco delle aziende con il ranking più alto.
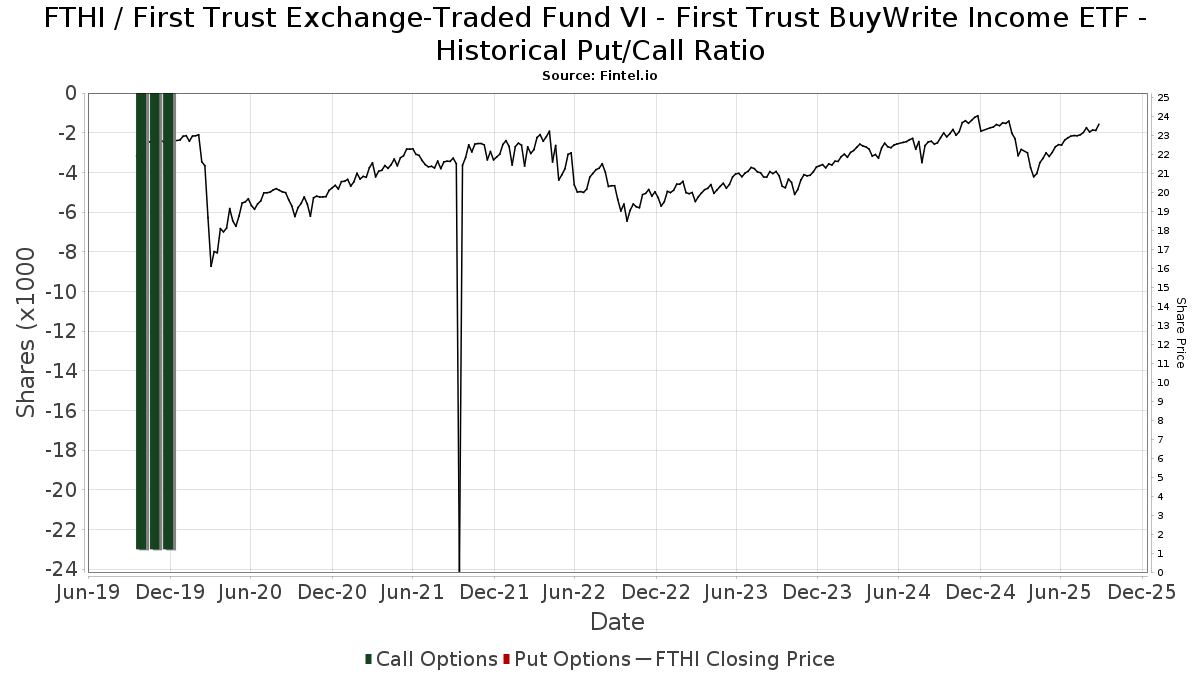
Rapporto put/call istituzionale
Oltre a segnalare le emissioni standard di titoli azionari e di debito, gli istituti con più di 100 milioni di asset in gestione devono anche dichiarare le loro partecipazioni in opzioni put e call. Poiché le opzioni put indicano generalmente un sentiment negativo e le opzioni call un sentiment positivo, possiamo avere un'idea del sentiment istituzionale complessivo attraverso il rapporto tra put e call. Il grafico a destra mostra il rapporto storico put/call per questo strumento.
L'utilizzo del rapporto put/call come indicatore del sentiment degli investitori consente di superare una delle principali lacune dell'utilizzo della proprietà istituzionale totale, ovvero il fatto che una quantità significativa di asset in gestione viene investita passivamente per seguire gli indici. Generalmente, i fondi a gestione passiva non acquistano opzioni, per cui il rapporto put/call riflette più fedelmente il sentiment dei fondi a gestione attiva.
Depositi 13D/G
Presentiamo i depositi 13D/G separatamente dai depositi 13F a causa del diverso trattamento da parte della SEC. I depositi 13D/G possono essere presentati da gruppi di investitori (con un unico leader), mentre i depositi 13F no. Ciò comporta situazioni in cui un investitore può depositare un documento 13D/G riportando un valore per il totale delle azioni (che rappresenta tutte le azioni possedute dal gruppo di investitori), e poi depositare un documento 13F riportando un valore diverso per il totale delle azioni (che rappresenta esclusivamente la propria proprietà). Ciò significa che la proprietà delle azioni nei depositi 13D/G e nei depositi 13F spesso non sono direttamente comparabili, pertanto le presentiamo separatamente.
Nota: a partire dal 16 maggio 2021, non mostriamo più i proprietari che non hanno depositato un documento 13D/G nellultimo anno. In precedenza, mostravamo lintero storico dei depositi 13D/G. In generale, le entità che sono tenute a depositare i documenti 13D/G devono farlo almeno una volta all'anno prima di presentare un deposito di chiusura. Tuttavia, a volte i fondi escono dalle posizioni senza presentare un deposito di chiusura (cioè, procedono a una liquidazione), per cui la visualizzazione dell'intero storico a volte generava confusione sull'attuale proprietà. Per evitare confusione, ora mostriamo solo i proprietari "attuali", ossia quelli che hanno effettuato un deposito nell'ultimo anno.
Upgrade to unlock premium data.
| Data di deposito | Modulo | Investitore | Azioni precedenti |
Ultime azioni |
Δ Azioni (Percentuale) |
Proprietà (Percentuale) |
Δ Proprietà (Percentuale) |
|
|---|---|---|---|---|---|---|---|---|
| 2025-07-23 | FIRST TRUST PORTFOLIOS LP | 16,143,864 | 15,663,087 | -2.98 | 26.12 | -6.68 |
Depositi 13F e NPORT
Le informazioni relative ai depositi 13F sono gratuite. Per accedere alle informazioni relative ai depositi NP è necessario un'abbonamento premium. Le righe verdi indicano le nuove posizioni. Le righe rosse indicano le posizioni chiuse. Fai clic sull'icona del link per visualizzare la cronologia completa delle transazioni.
Esegui l'upgrade
per sbloccare i dati premium ed esportarli in Excel ![]() .
.
| Data di deposito | Fonte | Investitore | Tipo | Prezzo medio (Stima) |
Azioni | Δ Azioni (%) |
Valore dichiarato ($ 1000) |
Δ Valore (%) |
Allocazione del portafoglio (%) |
|
|---|---|---|---|---|---|---|---|---|---|---|
| 2025-08-11 | 13F | Perennial Investment Advisors, LLC | 113.774 | 2,39 | 2.600 | 7,04 | ||||
| 2025-08-14 | 13F | Treasure Coast Financial Planning | 24.802 | 13,15 | 567 | 18,16 | ||||
| 2025-07-07 | 13F | Thurston, Springer, Miller, Herd & Titak, Inc. | 2.900 | 7,41 | 66 | 11,86 | ||||
| 2025-05-15 | 13F/A | Orion Portfolio Solutions, LLC | 21.473 | 3.034,74 | 469 | 3.808,33 | ||||
| 2025-07-07 | 13F | Investors Research Corp | 398 | 0,00 | 9 | 12,50 | ||||
| 2025-08-12 | 13F | Integrated Advisors Network LLC | 20.480 | 468 | ||||||
| 2025-08-11 | 13F | Principal Securities, Inc. | 98.980 | 8,90 | 2.262 | 6,95 | ||||
| 2025-07-08 | 13F | Zrc Wealth Management, Llc | 187.621 | 0,75 | 4.287 | 5,33 | ||||
| 2025-08-05 | 13F | American Institute for Advanced Investment Management, LLP | 53.820 | -1,64 | 1.230 | 2,76 | ||||
| 2025-08-12 | 13F | Cornerstone Wealth Management, LLC | 34.468 | 47,14 | 788 | 53,71 | ||||
| 2025-07-16 | 13F | Perigon Wealth Management, LLC | 11.719 | -11,51 | 268 | -7,61 | ||||
| 2025-07-17 | 13F | Nelson, Van Denburg & Campbell Wealth Management Group, LLC | 67.364 | -7,24 | 1.539 | -3,02 | ||||
| 2025-08-04 | 13F | Assetmark, Inc | 0 | -100,00 | 0 | |||||
| 2025-08-29 | 13F | Centaurus Financial, Inc. | 14.004 | 146,46 | 0 | |||||
| 2025-08-12 | 13F | LPL Financial LLC | 6.790.859 | 3,53 | 155.171 | 8,22 | ||||
| 2025-08-18 | 13F | Geneos Wealth Management Inc. | 51.309 | 76,29 | 1.172 | 84,28 | ||||
| 2025-07-28 | 13F | RFG Advisory, LLC | 19.333 | -53,14 | 442 | -51,05 | ||||
| 2025-04-24 | 13F | Kraft, Davis & Associates, LLC | 0 | -100,00 | 0 | |||||
| 2025-08-04 | 13F | Merkkuri Wealth Advisors LLC | 98.843 | 6,95 | 2.259 | 11,78 | ||||
| 2025-08-15 | 13F | Fsb Premier Wealth Management, Inc. | 27.097 | 1,30 | 619 | 5,99 | ||||
| 2025-08-11 | 13F | Nations Financial Group Inc, /ia/ /adv | 36.915 | 8,88 | 844 | 13,77 | ||||
| 2025-08-05 | 13F | Dunhill Financial, LLC | 54.545 | -86,92 | 1.246 | -86,34 | ||||
| 2025-08-13 | 13F | Scotia Capital Inc. | 0 | -100,00 | 0 | |||||
| 2025-07-23 | 13F | RiverTree Advisors, LLC | 201.047 | 181,99 | 4.594 | 194,80 | ||||
| 2025-07-25 | NP | LALT - First Trust Multi-Strategy Alternative ETF | 0 | -100,00 | 0 | -100,00 | ||||
| 2025-08-06 | 13F | Commonwealth Equity Services, Llc | 641.994 | 10,47 | 15 | 16,67 | ||||
| 2025-08-01 | 13F | Pasadena Private Wealth, LLC | 19.850 | 0,00 | 454 | 4,62 | ||||
| 2025-07-28 | 13F | Davidson Trust Co | 88.484 | 4,82 | 2.022 | 9,54 | ||||
| 2025-08-14 | 13F | GWM Advisors LLC | 45.886 | 1,85 | 1.049 | 6,50 | ||||
| 2025-08-13 | 13F | VestGen Advisors, LLC | 14.723 | 0,59 | 336 | 5,33 | ||||
| 2025-07-16 | 13F | Novem Group | 11.216 | 256 | ||||||
| 2025-08-13 | 13F | Northwestern Mutual Wealth Management Co | 88.302 | 2,10 | 2.018 | 6,72 | ||||
| 2025-08-14 | 13F | Financial Advisory Service, Inc. | 11 | 0 | ||||||
| 2025-07-25 | 13F | Cwm, Llc | 310.505 | 22,92 | 7 | 40,00 | ||||
| 2025-08-14 | 13F | Old Mission Capital Llc | 133.235 | 1.216,42 | 3.044 | 1.277,38 | ||||
| 2025-07-15 | 13F | BKA Wealth Consulting, Inc. | 0 | -100,00 | 0 | |||||
| 2025-05-28 | 13F | Intrua Financial, LLC | 0 | -100,00 | 0 | |||||
| 2025-08-01 | 13F | Envestnet Asset Management Inc | 2.978.349 | -1,63 | 68.055 | 2,82 | ||||
| 2025-08-14 | 13F | Comerica Bank | 2.071 | 0,00 | 47 | 4,44 | ||||
| 2025-08-14 | 13F | Integrated Wealth Concepts LLC | 141.190 | 5,71 | 3.226 | 10,52 | ||||
| 2025-08-06 | 13F | Tradewinds, LLC. | 98.843 | 2.259 | ||||||
| 2025-08-08 | 13F | Compass Financial Services Inc | 563 | 2,36 | 13 | 0,00 | ||||
| 2025-07-21 | 13F | Ameritas Advisory Services, LLC | 233.868 | -14,01 | 5.344 | -14,44 | ||||
| 2025-07-25 | 13F | We Are One Seven, LLC | 0 | -100,00 | 0 | |||||
| 2025-08-14 | 13F | Advisor OS, LLC | 358.456 | 9,12 | 8.191 | 14,07 | ||||
| 2025-08-07 | 13F | Kestra Private Wealth Services, Llc | 61.766 | 35,52 | 1.411 | 41,67 | ||||
| 2025-08-12 | 13F | Global Retirement Partners, LLC | 3.279 | 0,00 | 75 | -2,63 | ||||
| 2025-08-08 | 13F | Capital Investment Advisory Services, LLC | 104.531 | 10,99 | 2.389 | 16,03 | ||||
| 2025-07-30 | 13F | Brookstone Capital Management | 42.281 | 4,07 | 966 | 8,78 | ||||
| 2025-08-14 | 13F | Arete Wealth Advisors, LLC | 0 | -100,00 | 0 | |||||
| 2025-08-08 | 13F | Foundations Investment Advisors, LLC | 12.914 | 1,97 | 295 | 6,88 | ||||
| 2025-07-14 | 13F | Main Line Retirement Advisors, LLC | 41.800 | 955 | ||||||
| 2025-07-29 | 13F | Balboa Wealth Partners | 51.443 | 1.175 | ||||||
| 2025-07-17 | 13F | Janney Montgomery Scott LLC | 786.087 | 13,44 | 18 | 13,33 | ||||
| 2025-08-14 | 13F | CoreCap Advisors, LLC | 4.549 | -10,51 | 104 | -7,21 | ||||
| 2025-08-14 | 13F | Stifel Financial Corp | 691.621 | 7,90 | 15.804 | 12,79 | ||||
| 2025-08-14 | 13F | Sequent Planning LLC | 58.004 | 2,47 | 1.325 | 7,11 | ||||
| 2025-08-18 | 13F | Arq Wealth Advisors, Llc | 117.263 | 0,00 | 2.563 | 0,00 | ||||
| 2025-08-04 | 13F | Atria Investments Llc | 0 | -100,00 | 0 | |||||
| 2025-07-31 | 13F | Anchor Capital Management Group Inc | 67.000 | 0,00 | 1.531 | 4,51 | ||||
| 2025-07-15 | 13F | LVZ Advisors, Inc. | 61.940 | 3,60 | 1.415 | 8,35 | ||||
| 2025-08-12 | 13F | Steward Partners Investment Advisory, Llc | 20.047 | 17,30 | 458 | 22,79 | ||||
| 2025-07-01 | 13F | Private Client Services, Llc | 15.483 | 49,19 | 354 | 56,19 | ||||
| 2025-08-15 | 13F | Morgan Stanley | 16.419 | -0,98 | 375 | 3,59 | ||||
| 2025-08-14 | 13F | Benjamin Edwards Inc | 37.723 | 13,54 | 862 | 18,60 | ||||
| 2025-07-31 | 13F | Oppenheimer & Co Inc | 25.556 | 62,41 | 584 | 69,97 | ||||
| 2025-07-09 | 13F | Channel Wealth Llc | 15.129 | 8,61 | 346 | 13,49 | ||||
| 2025-08-13 | 13F | Smith, Moore & Co. | 14.924 | -0,67 | 341 | 3,96 | ||||
| 2025-08-05 | 13F | Lord & Richards Wealth Management, LLC | 0 | -100,00 | 0 | |||||
| 2025-08-11 | 13F | Regal Investment Advisors LLC | 43.477 | 993 | ||||||
| 2025-08-01 | 13F | Ferguson Shapiro LLC | 9.178 | 210 | ||||||
| 2025-08-14 | 13F | UBS Group AG | 361 | 8 | ||||||
| 2025-05-16 | 13F/A | Kestra Investment Management, LLC | 0 | -100,00 | 0 | |||||
| 2025-07-24 | 13F | Cyndeo Wealth Partners, LLC | 16.497 | -23,76 | 377 | -20,34 | ||||
| 2025-07-30 | 13F | Insight Advisors, LLC/ PA | 19.716 | 0,87 | 451 | 5,39 | ||||
| 2025-07-30 | 13F | TFB Advisors LLC | 35.773 | -6,86 | 817 | -2,62 | ||||
| 2025-06-26 | NP | ATCAX - Anchor Risk Managed Credit Strategies Fund Advisor Class Shares | 67.000 | 0,00 | 1.486 | -4,07 | ||||
| 2025-08-04 | 13F | Integrity Alliance, Llc. | 0 | -100,00 | 0 | |||||
| 2025-07-30 | 13F | D.a. Davidson & Co. | 2.486.389 | 3,34 | 56.814 | 8,02 | ||||
| 2025-08-18 | 13F | Tyler-Stone Wealth Management | 16.326 | 2,33 | 373 | 7,18 | ||||
| 2025-07-14 | 13F | AdvisorNet Financial, Inc | 3.508 | 84,63 | 80 | 95,12 | ||||
| 2025-07-25 | 13F | Envestnet Portfolio Solutions, Inc. | 39.370 | -62,51 | 900 | -60,83 | ||||
| 2025-08-15 | 13F | Kestra Advisory Services, LLC | 81.802 | 21,96 | 1.869 | 27,49 | ||||
| 2025-08-08 | 13F | SBI Securities Co., Ltd. | 1.560 | -9,25 | 36 | -5,41 | ||||
| 2025-08-14 | 13F | Snowden Capital Advisors LLC | 219.632 | 0,81 | 5.019 | 5,38 | ||||
| 2025-07-29 | 13F | International Assets Investment Management, Llc | 37.497 | 0,87 | 857 | 5,42 | ||||
| 2025-08-08 | 13F | Cetera Investment Advisers | 698.676 | 0,94 | 15.965 | 5,51 | ||||
| 2025-08-25 | NP | FTBI - First Trust Balanced Income ETF | 25.929 | 592 | ||||||
| 2025-08-06 | 13F | Legacy Investment Solutions, LLC | 28.653 | 66,76 | 655 | 61,88 | ||||
| 2025-08-13 | 13F | WCG Wealth Advisors LLC | 24.515 | 560 | ||||||
| 2025-08-14 | 13F | Hilltop Holdings Inc. | 9.281 | 212 | ||||||
| 2025-08-05 | 13F | GPS Wealth Strategies Group, LLC | 8.337 | 8,81 | 191 | 13,77 | ||||
| 2025-07-22 | 13F | Wealthcare Advisory Partners LLC | 10.327 | 0,08 | 236 | 4,44 | ||||
| 2025-07-14 | 13F | GAMMA Investing LLC | 913 | 0,00 | 21 | 5,26 | ||||
| 2025-08-11 | 13F | Elequin Capital Lp | 126.702 | 2.895 | ||||||
| 2025-08-08 | 13F | Avantax Advisory Services, Inc. | 128.694 | -1,52 | 2.941 | 2,94 | ||||
| 2025-08-11 | 13F | Aptus Capital Advisors, LLC | 4.435 | 30,10 | 101 | 36,49 | ||||
| 2025-08-13 | 13F | Beacon Pointe Advisors, LLC | 61.563 | -5,12 | 1.407 | -0,85 | ||||
| 2025-08-11 | 13F | Core Wealth Partners LLC | 34.301 | 33,58 | 784 | 39,57 | ||||
| 2025-08-07 | 13F | PCG Wealth Advisors, LLC | 74.652 | -45,32 | 1.706 | -42,86 | ||||
| 2025-05-27 | NP | XFLX - FundX Flexible ETF | 183.480 | 134,00 | 4.011 | 119,85 | ||||
| 2025-07-22 | 13F | DAVENPORT & Co LLC | 10.957 | 250 | ||||||
| 2025-08-27 | 13F/A | Brinker Capital Investments, LLC | 21.198 | -1,28 | 484 | 3,20 | ||||
| 2025-08-14 | 13F | Jane Street Group, Llc | 68.849 | -18,44 | 1.573 | -14,74 | ||||
| 2025-08-06 | 13F | Golden State Wealth Management, LLC | 1.263 | -95,87 | 29 | -95,81 | ||||
| 2025-07-22 | 13F | Accel Wealth Management | 50.749 | -0,98 | 1.160 | 3,48 | ||||
| 2025-08-14 | 13F | Wiley Bros.-aintree Capital, Llc | 18.980 | 434 | ||||||
| 2025-08-11 | 13F | Western Wealth Management, LLC | 0 | -100,00 | 0 | -100,00 | ||||
| 2025-08-14 | 13F | Citadel Advisors Llc | 24.187 | 553 | ||||||
| 2025-07-07 | 13F | Insight Wealth Strategies, LLC | 13.441 | 1,14 | 306 | 5,17 | ||||
| 2025-08-11 | 13F | One Capital Management, LLC | 0 | -100,00 | 0 | |||||
| 2025-08-11 | 13F | Lowe Brockenbrough & Co Inc | 3.500 | 80 | ||||||
| 2025-04-09 | 13F | HBW Advisory Services LLC | 0 | -100,00 | 0 | -100,00 | ||||
| 2025-08-13 | 13F | Level Four Advisory Services, Llc | 17.110 | -44,74 | 391 | -42,31 | ||||
| 2025-07-25 | 13F | Valley Brook Capital Group, Inc. | 11.180 | 0,24 | 255 | 4,94 | ||||
| 2025-07-09 | 13F | Presidio Capital Management, LLC | 19.863 | 5,30 | 454 | 9,95 | ||||
| 2025-07-31 | 13F | Cambridge Investment Research Advisors, Inc. | 684.255 | 25,23 | 16 | 36,36 | ||||
| 2025-07-08 | 13F | Nbc Securities, Inc. | 1.669 | 2,02 | 0 | |||||
| 2025-08-14 | 13F | Bank Of America Corp /de/ | 1 | 0,00 | 0 | |||||
| 2025-07-29 | 13F | Private Trust Co Na | 10.353 | 10,69 | 237 | 15,69 | ||||
| 2025-08-12 | 13F | Jpmorgan Chase & Co | 0 | -100,00 | 0 | |||||
| 2025-07-25 | 13F | Atria Wealth Solutions, Inc. | 60.697 | -64,69 | 1.387 | -63,11 | ||||
| 2025-04-15 | 13F | Transform Wealth, LLC | 41.631 | 910 | ||||||
| 2025-07-28 | 13F | Harbour Investments, Inc. | 124.275 | -1,06 | 2.840 | 3,42 | ||||
| 2025-05-09 | 13F | GeoWealth Management, LLC | 0 | -100,00 | 0 | |||||
| 2025-07-23 | 13F | Castle Rock Wealth Management, LLC | 15.566 | -0,03 | 360 | 5,59 | ||||
| 2025-08-14 | 13F | Wells Fargo & Company/mn | 4.567.850 | 23,28 | 104.375 | 28,86 | ||||
| 2025-07-22 | 13F | Legacy CG, LLC | 323.505 | -55,97 | 7.392 | -53,98 | ||||
| 2025-08-12 | 13F | Gladstone Institutional Advisory LLC | 15.629 | -17,48 | 357 | -13,77 | ||||
| 2025-08-06 | 13F | Moors & Cabot, Inc. | 9.050 | 207 | ||||||
| 2025-08-14 | 13F | Raymond James Financial Inc | 2.769.271 | -9,79 | 63.278 | -5,71 | ||||
| 2025-08-14 | 13F | Susquehanna International Group, Llp | 48.411 | -53,06 | 1.106 | -50,93 | ||||
| 2025-07-29 | 13F | Stratos Wealth Partners, LTD. | 0 | -100,00 | 0 | |||||
| 2025-08-06 | 13F | Prospera Financial Services Inc | 133.339 | 18,36 | 3.047 | 23,76 | ||||
| 2025-08-12 | 13F | Change Path, LLC | 293.875 | -0,79 | 6.715 | 3,71 | ||||
| 2025-07-23 | 13F | Sachetta, LLC | 12.870 | 294 | ||||||
| 2025-07-11 | 13F | Quad-Cities Investment Group, LLC | 50.685 | 8,11 | 1.158 | 13,09 | ||||
| 2025-08-08 | 13F | Mjp Associates Inc /adv | 387.576 | 17,99 | 8.856 | 23,34 | ||||
| 2025-07-28 | 13F | BRYN MAWR TRUST Co | 1.202 | -3,45 | 27 | 0,00 | ||||
| 2025-08-04 | 13F | IFG Advisory, LLC | 20.543 | 469 | ||||||
| 2025-08-13 | 13F | Capital Analysts, Inc. | 13.022 | 7,47 | 0 | |||||
| 2025-08-13 | 13F | StoneX Group Inc. | 23.092 | 0,00 | 528 | 4,56 | ||||
| 2025-04-29 | 13F | Onyx Bridge Wealth Group LLC | 0 | -100,00 | 0 | |||||
| 2025-07-24 | 13F | IFP Advisors, Inc | 24.610 | -3,00 | 562 | 1,44 | ||||
| 2025-08-12 | 13F | Richmond Investment Services, LLC | 14.666 | 335 | ||||||
| 2025-05-27 | NP | XRLX - FundX Conservative ETF | 83.551 | 178,50 | 1.826 | 161,60 | ||||
| 2025-07-18 | 13F | Truist Financial Corp | 94.565 | 11,80 | 2.161 | 16,88 | ||||
| 2025-07-11 | 13F | Farther Finance Advisors, LLC | 71.644 | 1.637 | ||||||
| 2025-07-30 | 13F | BlueChip Wealth Advisors LLC | 19.180 | 0,00 | 438 | 4,53 | ||||
| 2025-08-14 | 13F | Mariner, LLC | 94.321 | -63,06 | 2.155 | -61,39 | ||||
| 2025-08-14 | 13F | Marshall Investment Management, Llc | 0 | -100,00 | 0 | |||||
| 2025-07-23 | 13F | Gentry Private Wealth, Llc | 31.258 | 2,58 | 714 | 7,21 | ||||
| 2025-09-04 | 13F/A | Advisor Group Holdings, Inc. | 386.332 | 12,25 | 8.826 | 17,30 | ||||
| 2025-08-13 | 13F | Gateway Wealth Partners, LLC | 10.262 | 0,00 | 234 | 4,46 | ||||
| 2025-08-05 | 13F | Sigma Planning Corp | 0 | -100,00 | 0 | |||||
| 2025-08-06 | 13F | AE Wealth Management LLC | 34.891 | 3,66 | 797 | 8,44 | ||||
| 2025-08-14 | 13F | Goldman Sachs Group Inc | 0 | -100,00 | 0 | |||||
| 2025-08-28 | NP | TFAFX - Tactical Growth Allocation Fund Class I | 1.370 | 31 | ||||||
| 2025-07-21 | 13F | DHJJ Financial Advisors, Ltd. | 14 | 0,00 | 0 | |||||
| 2025-08-14 | 13F | IHT Wealth Management, LLC | 111.796 | 9,46 | 2.555 | 14,43 | ||||
| 2025-08-12 | 13F | Coldstream Capital Management Inc | 0 | -100,00 | 0 | |||||
| 2025-08-26 | 13F/A | Thrivent Financial For Lutherans | 0 | -100,00 | 0 | |||||
| 2025-04-16 | 13F | Farmers & Merchants Investments Inc | 0 | -100,00 | 0 | |||||
| 2025-08-07 | 13F | Resources Investment Advisors, LLC. | 65.658 | -17,72 | 1.500 | -13,99 | ||||
| 2025-08-13 | 13F | First Trust Advisors Lp | 27.808 | 635 | ||||||
| 2025-08-19 | 13F | Asset Dedication, LLC | 1.922 | 44 | ||||||
| 2025-08-14 | 13F | Warren Averett Asset Management, LLC | 10.304 | 235 | ||||||
| 2025-04-17 | 13F | Authentikos Wealth Advisory, LLC | 0 | -100,00 | 0 | |||||
| 2025-08-14 | 13F | Royal Bank Of Canada | 746.968 | 9,09 | 17.068 | 14,02 | ||||
| 2025-08-14 | 13F | Ausdal Financial Partners, Inc. | 78.222 | 15,08 | 1.787 | 20,34 | ||||
| 2025-08-15 | 13F | Puff Wealth Management, Llc | 48.831 | 3,61 | 1.116 | 8,25 | ||||
| 2025-08-27 | 13F | Barnes Wealth Management Group, Inc | 12.138 | 3,30 | 277 | 8,20 | ||||
| 2025-07-24 | 13F | Us Bancorp \de\ | 18.629 | -3,05 | 426 | 1,19 | ||||
| 2025-08-12 | 13F | J.w. Cole Advisors, Inc. | 23.442 | 51,91 | 536 | 58,75 | ||||
| 2025-08-12 | 13F | NWF Advisory Services Inc. | 0 | -100,00 | 0 | |||||
| 2025-07-30 | 13F | IMG Wealth Management, Inc. | 4.259 | 16,59 | 97 | 22,78 | ||||
| 2025-08-11 | 13F | Private Advisor Group, LLC | 28.083 | 91,93 | 642 | 100,94 | ||||
| 2025-08-14 | 13F | Ameriprise Financial Inc | 10.879 | -8,72 | 249 | -4,62 | ||||
| 2025-08-12 | 13F | SRS Capital Advisors, Inc. | 114.610 | 29,44 | 2.619 | 35,30 | ||||
| 2025-07-16 | 13F | Independent Wealth Network Inc. | 22.575 | -6,95 | 516 | -2,83 | ||||
| 2025-07-10 | 13F | Wealth Enhancement Advisory Services, Llc | 233.154 | -0,91 | 5.353 | 4,08 | ||||
| 2025-08-01 | 13F | Redmond Asset Management, LLC | 15.012 | -15,49 | 343 | -11,60 | ||||
| 2025-07-25 | 13F | Concurrent Investment Advisors, LLC | 93.363 | 17,50 | 2.133 | 22,87 | ||||
| 2025-08-13 | 13F | Quadrature Capital Ltd | 10.552 | 241 | ||||||
| 2025-08-12 | 13F | Proequities, Inc. | 0 | 0 | ||||||
| 2025-08-06 | 13F | Legacy Wealth Managment, LLC/ID | 28.653 | 34,26 | 655 | 40,34 | ||||
| 2025-07-17 | 13F | Janney Capital Management LLC | 129.298 | -0,60 | 3 | 0,00 | ||||
| 2025-08-01 | 13F | GoalVest Advisory LLC | 813 | -5,79 | 19 | 0,00 | ||||
| 2025-08-19 | 13F | National Asset Management, Inc. | 0 | -100,00 | 0 | |||||
| 2025-08-05 | 13F | Bank Of Montreal /can/ | 1.350 | 31 | ||||||
| 2025-08-14 | 13F | Mml Investors Services, Llc | 88.795 | 22,90 | 2 | 100,00 | ||||
| 2025-08-14 | 13F | Aqr Capital Management Llc | 22.682 | -0,25 | 518 | 4,23 | ||||
| 2025-07-16 | 13F | ORG Partners LLC | 2.000 | -75,00 | 46 | -74,29 | ||||
| 2025-08-14 | 13F | Two Sigma Investments, Lp | 448.600 | 10.251 | ||||||
| 2025-08-15 | 13F | Equitable Holdings, Inc. | 129.684 | 5,95 | 2.963 | 10,77 | ||||
| 2025-07-22 | 13F | Ergawealth Advisors, Inc. | 369.549 | 8.444 | ||||||
| 2025-08-14 | 13F/A | Rockefeller Capital Management L.P. | 198.688 | 5,05 | 4.540 | 9,82 | ||||
| 2025-08-19 | 13F | Advisory Services Network, LLC | 0 | -100,00 | 0 | |||||
| 2025-04-22 | 13F | Flagship Harbor Advisors, Llc | 0 | -100,00 | 0 | |||||
| 2025-07-23 | 13F | Kingswood Wealth Advisors, Llc | 49.180 | 7,50 | 1.124 | 11,85 | ||||
| 2025-05-15 | 13F | Concorde Asset Management, LLC | 9.695 | 206 | ||||||
| 2025-07-10 | 13F | Sovran Advisors, LLC | 36.139 | -10,08 | 826 | -1,90 | ||||
| 2025-08-18 | 13F | Tactive Advisors, LLC | 12.347 | 282 |