Statistiche di base
| Proprietari istituzionali | 172 total, 172 long only, 0 short only, 0 long/short - change of 16,11% MRQ |
| Allocazione media del portafoglio | 0.3793 % - change of 26,85% MRQ |
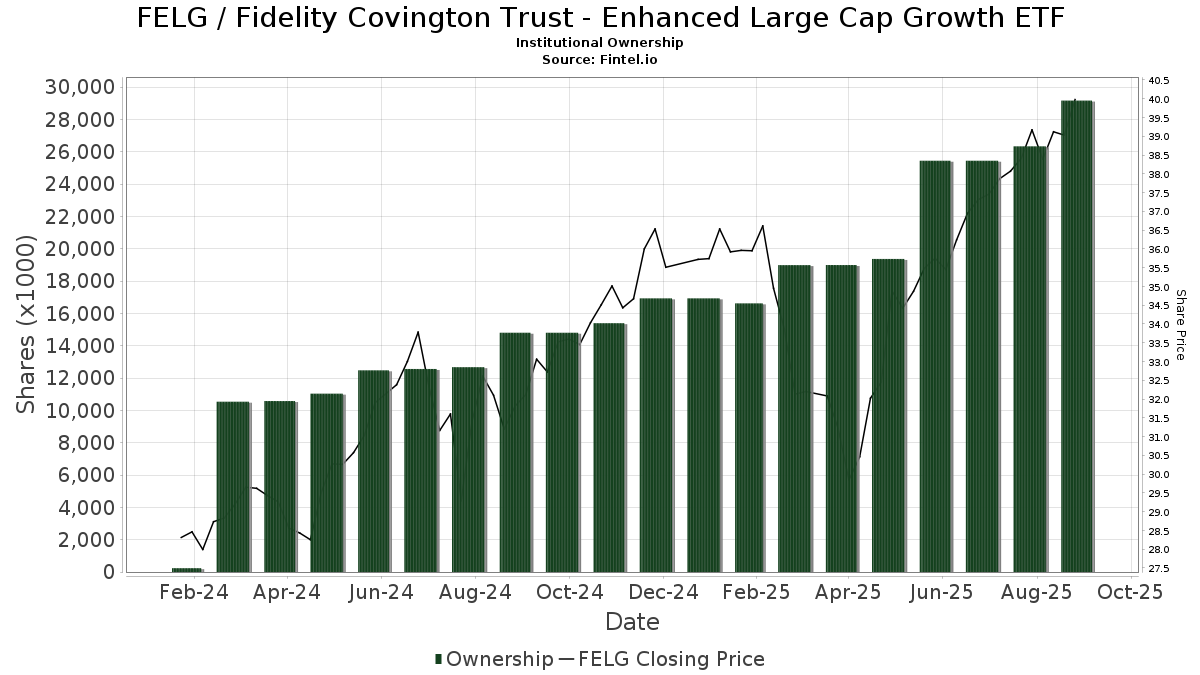
| Azioni istituzionali (Long) | 29.171.785 (ex 13D/G) - change of 3,72MM shares 14,63% MRQ |
| Valore istituzionale (Long) | $ 703.097 USD ($1000) |
Proprietà istituzionale e azionisti
Fidelity Covington Trust - Enhanced Large Cap Growth ETF (US:FELG) ha 172 proprietari istituzionali e azionisti che hanno presentato i moduli 13D/G o 13F alla Securities Exchange Commission (SEC). Queste istituzioni detengono un totale di 29,171,785 azioni. I maggiori azionisti includono Mml Investors Services, Llc, Envestnet Asset Management Inc, Commonwealth Equity Services, Llc, LPL Financial LLC, Equitable Holdings, Inc., Independence Financial Advisors, LLC, Raymond James Financial Inc, Advisor Group Holdings, Inc., Spectrum Investment Advisors, Inc., and Cambridge Investment Research Advisors, Inc. .
(Fidelity Covington Trust - Enhanced Large Cap Growth ETF (ARCA:FELG) la struttura proprietaria istituzionale mostra le attuali posizioni nella società da parte di istituzioni e fondi, nonché le ultime variazioni nella dimensione della posizione. I principali azionisti possono essere singoli investitori, fondi comuni, hedge fund o istituzioni. L'allegato 13D indica che l'investitore detiene (o ha detenuto) più del 5% della società e intende (o intendeva) perseguire attivamente un cambiamento nella strategia aziendale. L'allegato 13G indica un investimento passivo superiore al 5%.
The share price as of September 5, 2025 is 39,28 / share. Previously, on September 9, 2024, the share price was 30,84 / share. This represents an increase of 27,37% over that period.
Indice del sentiment dei fondi
L'indice del sentiment dei fondi (anche noto come "indice di accumulo di proprietà") individua i titoli più acquistati dai fondi. È il risultato di un sofisticato modello quantitativo multi-fattore che identifica le società con i più alti livelli di accumulo istituzionale. Il modello utilizza una combinazione dell'aumento totale dei proprietari dichiarati, delle variazioni nelle allocazioni di portafoglio di tali proprietari e di altre metriche. Il punteggio varia da 0 a 100: i numeri più alti indicano un livello di accumulo superiore ad altre società, mentre 50 rappresenta la media.
Frequenza di aggiornamento: giornaliera
Consulta Ownership Explorer per visualizzare l'elenco delle aziende con il ranking più alto.
Rapporto put/call istituzionale
Oltre a segnalare le emissioni standard di titoli azionari e di debito, gli istituti con più di 100 milioni di asset in gestione devono anche dichiarare le loro partecipazioni in opzioni put e call. Poiché le opzioni put indicano generalmente un sentiment negativo e le opzioni call un sentiment positivo, possiamo avere un'idea del sentiment istituzionale complessivo attraverso il rapporto tra put e call. Il grafico a destra mostra il rapporto storico put/call per questo strumento.
L'utilizzo del rapporto put/call come indicatore del sentiment degli investitori consente di superare una delle principali lacune dell'utilizzo della proprietà istituzionale totale, ovvero il fatto che una quantità significativa di asset in gestione viene investita passivamente per seguire gli indici. Generalmente, i fondi a gestione passiva non acquistano opzioni, per cui il rapporto put/call riflette più fedelmente il sentiment dei fondi a gestione attiva.
Depositi 13F e NPORT
Le informazioni relative ai depositi 13F sono gratuite. Per accedere alle informazioni relative ai depositi NP è necessario un'abbonamento premium. Le righe verdi indicano le nuove posizioni. Le righe rosse indicano le posizioni chiuse. Fai clic sull'icona del link per visualizzare la cronologia completa delle transazioni.
Esegui l'upgrade
per sbloccare i dati premium ed esportarli in Excel ![]() .
.
| Data di deposito | Fonte | Investitore | Tipo | Prezzo medio (Stima) |
Azioni | Δ Azioni (%) |
Valore dichiarato ($ 1000) |
Δ Valore (%) |
Allocazione del portafoglio (%) |
|
|---|---|---|---|---|---|---|---|---|---|---|
| 2025-08-11 | 13F | Cornerstone Planning Group LLC | 1.082 | 0,00 | 41 | 28,13 | ||||
| 2025-08-14 | 13F | GWM Advisors LLC | 22.225 | 31,19 | 823 | 54,41 | ||||
| 2025-08-14 | 13F | Geneva Partners, LLC | 19.154 | -43,18 | 709 | -32,86 | ||||
| 2025-07-17 | 13F | Janney Montgomery Scott LLC | 14.666 | -1,60 | 1 | |||||
| 2025-08-06 | 13F | Wedbush Securities Inc | 13.099 | 4,93 | 0 | |||||
| 2025-04-28 | 13F | CarsonAllaria Wealth Management, Ltd. | 0 | -100,00 | 0 | |||||
| 2025-08-07 | 13F | Kestra Private Wealth Services, Llc | 22.006 | 37,93 | 815 | 62,15 | ||||
| 2025-07-21 | 13F | Ameritas Advisory Services, LLC | 2.801 | 104 | ||||||
| 2025-05-14 | 13F | PKS Advisory Services, LLC | 0 | -100,00 | 0 | |||||
| 2025-08-18 | 13F/A | Kestra Investment Management, LLC | 462.790 | -41,23 | 17.137 | -30,91 | ||||
| 2025-07-15 | 13F | Fifth Third Bancorp | 231 | 0,00 | 9 | 14,29 | ||||
| 2025-08-07 | 13F | Proficio Capital Partners LLC | 0 | -100,00 | 0 | |||||
| 2025-07-14 | 13F | Sowell Financial Services LLC | 26.372 | 977 | ||||||
| 2025-08-04 | 13F | Integrity Alliance, Llc. | 0 | -100,00 | 0 | |||||
| 2025-05-06 | 13F | Assetmark, Inc | 0 | -100,00 | 0 | |||||
| 2025-08-14 | 13F | Stifel Financial Corp | 24.697 | 90,75 | 915 | 124,57 | ||||
| 2025-08-08 | 13F | Advisors Capital Management, LLC | 190.632 | 89,46 | 7.059 | 122,75 | ||||
| 2025-08-14 | 13F | Menora Mivtachim Holdings Ltd. | 211.326 | 55,32 | 7.825 | 82,61 | ||||
| 2025-08-11 | 13F | Nations Financial Group Inc, /ia/ /adv | 7.647 | 283 | ||||||
| 2025-08-15 | 13F | Captrust Financial Advisors | 10.634 | 11,58 | 394 | 31,00 | ||||
| 2025-08-14 | 13F | Quantinno Capital Management LP | 10.979 | 407 | ||||||
| 2025-07-09 | 13F | Baron Wealth Management LLC | 11.426 | 423 | ||||||
| 2025-08-14 | 13F | UBS Group AG | 1.651 | 0,00 | 61 | 17,31 | ||||
| 2025-08-01 | 13F | Envestnet Asset Management Inc | 5.941.796 | 7,70 | 220.025 | 26,60 | ||||
| 2025-07-21 | 13F | Pacific Financial Group Inc | 6.044 | 224 | ||||||
| 2025-07-18 | 13F | Rogco, Lp | 1.521 | 56 | ||||||
| 2025-08-15 | 13F | Kestra Advisory Services, LLC | 550.317 | 15,08 | 20.378 | 35,29 | ||||
| 2025-08-07 | 13F | Allworth Financial LP | 3.462 | 0,03 | 128 | 18,52 | ||||
| 2025-08-11 | 13F | Regal Investment Advisors LLC | 11.193 | 2,87 | 414 | 21,05 | ||||
| 2025-07-18 | 13F | Madrona Financial Services, LLC | 11.706 | 46,03 | 433 | 71,83 | ||||
| 2025-07-29 | 13F | Fundamentun, Llc | 7.857 | 291 | ||||||
| 2025-08-08 | 13F | Creative Planning | 42.648 | 0,96 | 1.579 | 18,72 | ||||
| 2025-07-15 | 13F | Charter Capital Management, LLC\DE | 8.938 | 331 | ||||||
| 2025-07-09 | 13F | Act Wealth Management, Llc | 10.667 | 0,12 | 395 | 17,61 | ||||
| 2025-08-08 | 13F | Thoroughbred Financial Services, Llc | 6.289 | -38,63 | 0 | |||||
| 2025-08-14 | 13F | EP Wealth Advisors, Inc. | 6.086 | 69,01 | 225 | 99,12 | ||||
| 2025-08-27 | NP | ACGRX - Advisors Capital Growth Fund | 153.700 | 128,38 | 5.692 | 168,57 | ||||
| 2025-07-15 | 13F | Bay Capital Advisors, LLC | 19.219 | 13,23 | 712 | 33,15 | ||||
| 2025-07-25 | 13F | Ball & Co Wealth Management Inc. | 20.497 | -45,42 | 1 | -100,00 | ||||
| 2025-07-15 | 13F | Beacon Investment Advisory Services, Inc. | 10.021 | 0,00 | 371 | 17,78 | ||||
| 2025-07-18 | 13F | Rolek Wealth Management LLC | 31.558 | -20,72 | 1.169 | -4,50 | ||||
| 2025-07-25 | 13F | Verdence Capital Advisors LLC | 11.182 | 0,13 | 414 | 17,95 | ||||
| 2025-08-14 | 13F | Citadel Advisors Llc | 0 | -100,00 | 0 | |||||
| 2025-08-12 | 13F | Steward Partners Investment Advisory, Llc | 1.687 | 313,48 | 62 | 416,67 | ||||
| 2025-08-12 | 13F | Jpmorgan Chase & Co | 499.432 | 0,87 | 18.494 | 18,58 | ||||
| 2025-07-10 | 13F | Oliver Lagore Vanvalin Investment Group | 1 | 0,00 | 0 | |||||
| 2025-08-12 | 13F | SRS Capital Advisors, Inc. | 3.343 | 124 | ||||||
| 2025-07-17 | 13F | Halbert Hargrove Global Advisors, Llc | 253 | 0,00 | 9 | 28,57 | ||||
| 2025-05-28 | 13F | Intrua Financial, LLC | 0 | -100,00 | 0 | -100,00 | ||||
| 2025-07-29 | 13F | Spectrum Investment Advisors, Inc. | 690.417 | 4,06 | 25.566 | 22,34 | ||||
| 2025-08-13 | 13F | Fisher Asset Management, LLC | 6.336 | 235 | ||||||
| 2025-08-12 | 13F | Proequities, Inc. | 0 | 0 | ||||||
| 2025-08-13 | 13F | Colonial Trust Advisors | 1.121 | 42 | ||||||
| 2025-05-01 | 13F | Iron Horse Wealth Management, LLC | 0 | -100,00 | 0 | |||||
| 2025-08-15 | 13F | Tower Research Capital LLC (TRC) | 11.458 | 424 | ||||||
| 2025-07-25 | 13F | Hazlett, Burt & Watson, Inc. | 593 | 0,17 | 0 | |||||
| 2025-08-07 | 13F | Cahill Financial Advisors Inc | 5.887 | 218 | ||||||
| 2025-08-13 | 13F | IAG Wealth Partners, LLC | 28 | 1 | ||||||
| 2025-07-31 | 13F | Cambridge Investment Research Advisors, Inc. | 550.661 | 45,33 | 20 | 81,82 | ||||
| 2025-08-06 | 13F | AE Wealth Management LLC | 3.678 | -8,12 | 136 | 7,94 | ||||
| 2025-08-01 | 13F | Transcend Wealth Collective, Llc | 7.644 | 283 | ||||||
| 2025-08-14 | 13F | Foronjy Financial Llc | 7.758 | 287 | ||||||
| 2025-08-11 | 13F | Heritage Wealth Advisors | 552 | 0,00 | 20 | 17,65 | ||||
| 2025-07-23 | 13F | Element Wealth, LLC | 8.993 | 333 | ||||||
| 2025-07-14 | 13F | Sentinel Pension Advisors Inc | 381.516 | 40,05 | 14.128 | 64,63 | ||||
| 2025-08-08 | 13F | Cetera Investment Advisers | 196.778 | 24,39 | 7.287 | 46,22 | ||||
| 2025-08-05 | 13F | Sigma Planning Corp | 11.822 | -1,34 | 438 | 15,92 | ||||
| 2025-08-13 | 13F | Summit Wealth Group Llc / Co | 31.127 | 1.153 | ||||||
| 2025-08-12 | 13F | O'shaughnessy Asset Management, Llc | 0 | -100,00 | 0 | |||||
| 2025-07-23 | 13F | Clear Creek Financial Management, LLC | 24.841 | -29,85 | 920 | -17,58 | ||||
| 2025-08-14 | 13F | CoreCap Advisors, LLC | 1.671 | 97,99 | 62 | 134,62 | ||||
| 2025-08-06 | 13F | Golden State Wealth Management, LLC | 4.479 | 52,92 | 166 | 79,35 | ||||
| 2025-08-12 | 13F | Wood Tarver Financial Group, LLC | 5.707 | 0,00 | 0 | -100,00 | ||||
| 2025-07-22 | 13F | Wealthcare Advisory Partners LLC | 7.497 | -2,20 | 278 | 14,94 | ||||
| 2025-07-28 | 13F | Duncker Streett & Co Inc | 0 | -100,00 | 0 | |||||
| 2025-08-14 | 13F | Susquehanna International Group, Llp | 34.945 | -13,34 | 1.294 | 1,89 | ||||
| 2025-08-14 | 13F | Hilltop Holdings Inc. | 40.943 | -1,77 | 1.516 | 15,55 | ||||
| 2025-08-14 | 13F | Fmr Llc | 441.654 | 14,85 | 16.354 | 35,01 | ||||
| 2025-07-07 | 13F | Investors Research Corp | 1.208 | -19,89 | 45 | -6,38 | ||||
| 2025-07-23 | 13F | Richardson Capital Management LLC | 5.777 | 0,00 | 214 | 17,68 | ||||
| 2025-08-14 | 13F | Hrt Financial Lp | 8.843 | 0 | ||||||
| 2025-07-23 | 13F | Elm3 Financial Group, LLC | 11.548 | 65,23 | 428 | 94,09 | ||||
| 2025-08-07 | 13F | Flagship Wealth Advisors, Llc | 133.223 | 15,49 | 4.933 | 35,78 | ||||
| 2025-08-05 | 13F | Sage Capital Management, LLC | 12.344 | 0,10 | 457 | 17,78 | ||||
| 2025-05-14 | 13F | Jane Street Group, Llc | 0 | -100,00 | 0 | |||||
| 2025-07-29 | 13F | BKD Wealth Advisors, LLC | 0 | -100,00 | 0 | |||||
| 2025-08-14 | 13F | Great Valley Advisor Group, Inc. | 14.217 | 2,05 | 527 | 20,09 | ||||
| 2025-07-25 | 13F | Cwm, Llc | 2.325 | 0 | ||||||
| 2025-08-19 | 13F | Advisory Services Network, LLC | 9.533 | -10,14 | 364 | 8,98 | ||||
| 2025-08-14 | 13F | Raymond James Financial Inc | 824.707 | -0,30 | 30.539 | 17,20 | ||||
| 2025-07-10 | 13F | Family Legacy Financial Solutions, LLC | 17 | 1 | ||||||
| 2025-08-14 | 13F | Wells Fargo & Company/mn | 148.583 | 3.074,17 | 5.502 | 3.642,86 | ||||
| 2025-07-30 | 13F | Drive Wealth Management, Llc | 6.620 | 0,65 | 245 | 18,36 | ||||
| 2025-07-24 | 13F | IFP Advisors, Inc | 3.720 | 0,11 | 138 | 17,09 | ||||
| 2025-05-09 | 13F | Keeler THomas Management LLC | 0 | -100,00 | 0 | -100,00 | ||||
| 2025-08-06 | 13F | Bensler, LLC | 11.185 | -5,03 | 414 | 11,59 | ||||
| 2025-07-07 | 13F | Nova Wealth Management, Inc. | 59.048 | 3,05 | 2.187 | 21,11 | ||||
| 2025-07-22 | 13F | Valeo Financial Advisors, LLC | 17.504 | -5,24 | 648 | 11,53 | ||||
| 2025-07-08 | 13F | Lowe Wealth Advisors, LLC | 101 | 0,00 | 4 | 0,00 | ||||
| 2025-08-05 | 13F | Carolinas Wealth Consulting Llc | 0 | -100,00 | 0 | -100,00 | ||||
| 2025-08-05 | 13F | Key FInancial Inc | 26.144 | 0,00 | 968 | 17,62 | ||||
| 2025-08-04 | 13F | IFG Advisory, LLC | 21.618 | 9,26 | 801 | 28,41 | ||||
| 2025-07-29 | 13F | Private Trust Co Na | 1.435 | -49,83 | 53 | -41,11 | ||||
| 2025-07-18 | 13F | Truist Financial Corp | 200.469 | -1,99 | 7.423 | 15,23 | ||||
| 2025-08-15 | 13F | Morgan Stanley | 14.954 | -26,48 | 554 | -13,59 | ||||
| 2025-07-21 | 13F | Greenwood Capital Associates Llc | 51.998 | 21,36 | 1.925 | 42,70 | ||||
| 2025-08-26 | 13F/A | Thrivent Financial For Lutherans | 34.390 | -93,88 | 1 | -94,74 | ||||
| 2025-08-14 | 13F | D. E. Shaw & Co., Inc. | 8.100 | 17,39 | 300 | 37,79 | ||||
| 2025-04-21 | 13F | Nelson, Van Denburg & Campbell Wealth Management Group, LLC | 0 | -100,00 | 0 | |||||
| 2025-08-13 | 13F | Flow Traders U.s. Llc | 0 | -100,00 | 0 | |||||
| 2025-09-04 | 13F/A | Advisor Group Holdings, Inc. | 721.700 | -30,49 | 26.723 | -18,31 | ||||
| 2025-07-29 | 13F | Salus Financial Advisors, LLC | 6.772 | -17,68 | 251 | -3,47 | ||||
| 2025-04-21 | 13F | ORG Partners LLC | 0 | -100,00 | 0 | |||||
| 2025-08-04 | 13F | Creekmur Asset Management LLC | 21.071 | 0,04 | 780 | 17,65 | ||||
| 2025-08-14 | 13F | Mml Investors Services, Llc | 5.981.257 | 20,36 | 221 | 41,67 | ||||
| 2025-08-04 | 13F | Atria Investments Llc | 111.039 | 2,60 | 4.112 | 20,59 | ||||
| 2025-08-12 | 13F | Vestor Capital, Llc | 12.665 | 45,74 | 1 | |||||
| 2025-07-22 | 13F | Merit Financial Group, LLC | 24.561 | 84,70 | 909 | 117,46 | ||||
| 2025-07-28 | 13F | Harbour Investments, Inc. | 35.388 | -2,01 | 1.310 | 15,22 | ||||
| 2025-04-21 | 13F | Envestnet Portfolio Solutions, Inc. | 0 | -100,00 | 0 | |||||
| 2025-08-14 | 13F | Redwood Financial Network Corp | 24.448 | 4,33 | 905 | 22,63 | ||||
| 2025-08-08 | 13F | Avantax Advisory Services, Inc. | 275.017 | 123,96 | 10.184 | 163,26 | ||||
| 2025-08-14 | 13F | Mercer Global Advisors Inc /adv | 6.593 | 244 | ||||||
| 2025-08-08 | 13F | Advyzon Investment Management, LLC | 12.282 | 455 | ||||||
| 2025-07-11 | 13F | Farther Finance Advisors, LLC | 1.072 | 40 | ||||||
| 2025-08-11 | 13F | CBIZ Investment Advisory Services, LLC | 0 | -100,00 | 0 | -100,00 | ||||
| 2025-07-15 | 13F | Perennial Advisors, LLC | 12.675 | 0,00 | 469 | 17,54 | ||||
| 2025-08-13 | 13F | Capital Analysts, Inc. | 472 | -98,76 | 0 | -100,00 | ||||
| 2025-08-11 | 13F | HighTower Advisors, LLC | 19.745 | 0,13 | 731 | 17,71 | ||||
| 2025-05-09 | 13F | Atria Wealth Solutions, Inc. | 0 | -100,00 | 0 | |||||
| 2025-08-11 | 13F | Private Advisor Group, LLC | 169.996 | -38,78 | 6.295 | -28,04 | ||||
| 2025-08-12 | 13F | J.w. Cole Advisors, Inc. | 11.935 | -51,75 | 442 | -43,39 | ||||
| 2025-08-14 | 13F | Bank Of America Corp /de/ | 8.651 | 251,10 | 320 | 315,58 | ||||
| 2025-08-08 | 13F | Independence Financial Advisors, LLC | 830.356 | 1.399,41 | 30.748 | 1.663,07 | ||||
| 2025-08-14 | 13F | RMB Capital Management, LLC | 5.822 | 216 | ||||||
| 2025-07-17 | 13F | Prepared Retirement Institute LLC | 239.293 | 64,32 | 8.861 | 93,18 | ||||
| 2025-07-18 | 13F | Pure Financial Advisors, Inc. | 21.944 | 3,04 | 813 | 21,19 | ||||
| 2025-08-15 | 13F | CI Private Wealth, LLC | 6.967 | 0,00 | 258 | 17,35 | ||||
| 2025-08-25 | 13F | Silverlake Wealth Management Llc | 81.009 | -17,10 | 3.000 | -2,57 | ||||
| 2025-07-24 | 13F | Us Bancorp \de\ | 4.087 | -9,92 | 151 | 6,34 | ||||
| 2025-08-13 | 13F | Marshall Wace, Llp | 34.819 | 1.289 | ||||||
| 2025-08-06 | 13F | Commonwealth Equity Services, Llc | 3.520.372 | 47,86 | 130 | 75,68 | ||||
| 2025-07-30 | 13F | Roman Butler Fullerton & Co | 7.078 | 0,13 | 270 | 23,96 | ||||
| 2025-08-04 | 13F | Creative Financial Designs Inc /adv | 101 | 0,00 | 4 | 0,00 | ||||
| 2025-08-13 | 13F | Northwestern Mutual Wealth Management Co | 497.331 | 8,68 | 18.416 | 27,76 | ||||
| 2025-08-01 | 13F | Gwn Securities Inc. | 5.567 | -84,52 | 206 | -83,28 | ||||
| 2025-07-14 | 13F | Abound Wealth Management | 1.093 | 40 | ||||||
| 2025-07-31 | 13F | First Business Financial Services, Inc. | 5.700 | 211 | ||||||
| 2025-07-14 | 13F | Infinity Wealth Counsel, LLC | 23.225 | 10,07 | 860 | 29,52 | ||||
| 2025-07-15 | 13F | Financial Partners Group, Inc | 58.112 | -7,34 | 2.152 | 8,91 | ||||
| 2025-05-14 | 13F | Ameriprise Financial Inc | 0 | -100,00 | 0 | -100,00 | ||||
| 2025-08-14 | 13F | Comerica Bank | 856 | 152,51 | 32 | 210,00 | ||||
| 2025-07-15 | 13F | Regatta Capital Group, Llc | 7.157 | 0,13 | 265 | 17,78 | ||||
| 2025-08-13 | 13F | Maia Wealth LLC | 10.183 | -4,33 | 377 | 15,29 | ||||
| 2025-08-14 | 13F | Investmark Advisory Group LLC | 53.740 | 448,14 | 1.990 | 546,10 | ||||
| 2025-08-14 | 13F | Integrated Wealth Concepts LLC | 153.232 | 4,52 | 5.674 | 22,89 | ||||
| 2025-07-23 | 13F | Traphagen Investment Advisors Llc | 18.187 | 0,12 | 673 | 17,66 | ||||
| 2025-08-14 | 13F | Mariner, LLC | 22.698 | 6,06 | 840 | 24,63 | ||||
| 2025-05-12 | 13F | Sandy Spring Bank | 3.051 | 96 | ||||||
| 2025-08-14 | 13F | Royal Bank Of Canada | 41.284 | -9,77 | 1.529 | 6,03 | ||||
| 2025-08-06 | 13F | Atlantic Union Bankshares Corp | 3.051 | 113 | ||||||
| 2025-08-12 | 13F | Pathstone Holdings, LLC | 10.344 | 0,12 | 383 | 17,85 | ||||
| 2025-08-12 | 13F | SlateStone Wealth, LLC | 5.564 | 0 | ||||||
| 2025-08-12 | 13F | Global Retirement Partners, LLC | 20.017 | 47.559,52 | 741 | 74.000,00 | ||||
| 2025-08-14 | 13F | Goldman Sachs Group Inc | 7.335 | 272 | ||||||
| 2025-08-13 | 13F | Truvestments Capital Llc | 300 | 0,00 | 11 | 22,22 | ||||
| 2025-08-07 | 13F | Rollins Financial Advisors, LLC | 53.948 | -15,16 | 1.998 | -0,25 | ||||
| 2025-07-10 | 13F | Wealth Enhancement Advisory Services, Llc | 12.493 | 466 | ||||||
| 2025-08-13 | 13F | Lido Advisors, LLC | 72.557 | 3,42 | 2.687 | 21,59 | ||||
| 2025-07-15 | 13F | FMA Wealth Management, LLC | 10.965 | 32,68 | 406 | 42,46 | ||||
| 2025-05-15 | 13F | National Wealth Management Group, LLC | 9.642 | 0,00 | 304 | -10,88 | ||||
| 2025-07-23 | 13F | Venturi Wealth Management, LLC | 8.000 | 0,00 | 296 | 17,46 | ||||
| 2025-07-17 | 13F | Sound Income Strategies, LLC | 1.006 | 0,00 | 37 | 19,35 | ||||
| 2025-08-14 | 13F | Qube Research & Technologies Ltd | 1.891 | -39,85 | 70 | -29,29 | ||||
| 2025-08-13 | 13F | Kuhn & Co Investment Counsel | 15.372 | 2,88 | 569 | 21,06 | ||||
| 2025-07-23 | 13F | Valmark Advisers, Inc. | 102.329 | 64,90 | 3.789 | 93,91 | ||||
| 2025-08-15 | 13F | Equitable Holdings, Inc. | 948.919 | -30,16 | 35.138 | -17,90 | ||||
| 2025-07-10 | 13F | Security National Bank | 11.175 | 0,00 | 414 | 17,33 | ||||
| 2025-08-13 | 13F | Russell Investments Group, Ltd. | 1.082 | 40 | ||||||
| 2025-07-14 | 13F | AdvisorNet Financial, Inc | 1.621 | 0,00 | 60 | 17,65 | ||||
| 2025-08-14 | 13F | Coastal Bridge Advisors, LLC | 10.793 | 0,12 | 400 | 17,70 | ||||
| 2025-07-23 | 13F | InTrack Investment Management Inc | 39.816 | 1.474 | ||||||
| 2025-08-11 | 13F | Principal Securities, Inc. | 185.403 | 10.263,50 | 6.865 | 10.796,83 | ||||
| 2025-07-25 | 13F | Gibson Capital, LLC | 16.230 | 0,00 | 601 | 17,61 | ||||
| 2025-07-30 | 13F | Cullen/frost Bankers, Inc. | 5.308 | 90,52 | 197 | 125,29 | ||||
| 2025-08-08 | 13F | Larson Financial Group LLC | 641 | 75,62 | 24 | 109,09 | ||||
| 2025-08-14 | 13F | LaSalle St. Investment Advisors, LLC | 13.775 | -2,73 | 1 | |||||
| 2025-08-18 | 13F | Geneos Wealth Management Inc. | 250 | 0,00 | 9 | 28,57 | ||||
| 2025-08-14 | 13F | Sunbelt Securities, Inc. | 5.969 | -17,56 | 211 | -7,46 | ||||
| 2025-08-07 | 13F | CENTRAL TRUST Co | 440 | 0,00 | 16 | 23,08 | ||||
| 2025-07-10 | 13F | Sovran Advisors, LLC | 26.496 | 162,47 | 980 | 226,33 | ||||
| 2025-07-16 | 13F | Castleview Partners, Llc | 92.003 | 3.407 | ||||||
| 2025-08-06 | 13F | New Millennium Group LLC | 0 | 0 | ||||||
| 2025-07-31 | 13F | Glass Jacobson Investment Advisors llc | 0 | -100,00 | 0 | |||||
| 2025-08-12 | 13F | LPL Financial LLC | 1.836.582 | 47,64 | 68.009 | 73,56 | ||||
| 2025-08-13 | 13F | EverSource Wealth Advisors, LLC | 9.313 | -1,64 | 345 | 15,44 |