Statistiche di base
| Proprietari istituzionali | 181 total, 181 long only, 0 short only, 0 long/short - change of 7,10% MRQ |
| Allocazione media del portafoglio | 0.2026 % - change of -11,53% MRQ |
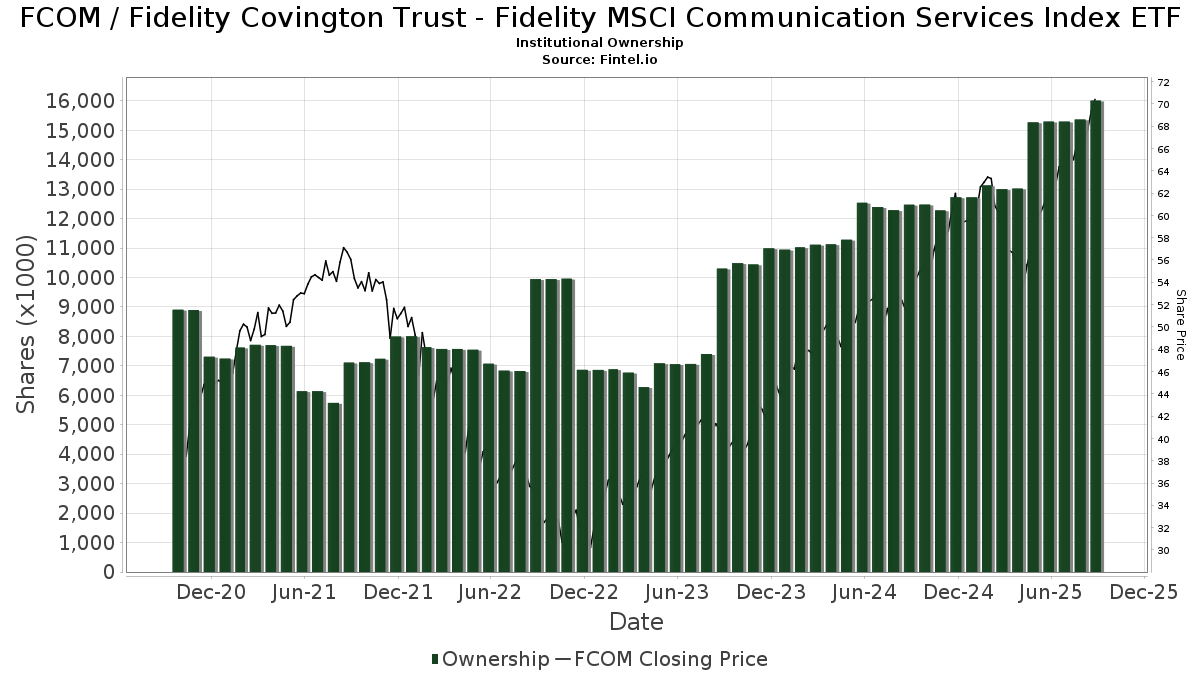
| Azioni istituzionali (Long) | 16.008.501 (ex 13D/G) - change of 0,71MM shares 4,66% MRQ |
| Valore istituzionale (Long) | $ 841.720 USD ($1000) |
Proprietà istituzionale e azionisti
Fidelity Covington Trust - Fidelity MSCI Communication Services Index ETF (US:FCOM) ha 181 proprietari istituzionali e azionisti che hanno presentato i moduli 13D/G o 13F alla Securities Exchange Commission (SEC). Queste istituzioni detengono un totale di 16,008,501 azioni. I maggiori azionisti includono Charles Schwab Investment Management Inc, Harel Insurance Investments & Financial Services Ltd., Lido Advisors, LLC, Northwestern Mutual Wealth Management Co, Agf Management Ltd, Morgan Stanley, Vicus Capital, Wells Fargo & Company/mn, Commonwealth Equity Services, Llc, and LPL Financial LLC .
(Fidelity Covington Trust - Fidelity MSCI Communication Services Index ETF (ARCA:FCOM) la struttura proprietaria istituzionale mostra le attuali posizioni nella società da parte di istituzioni e fondi, nonché le ultime variazioni nella dimensione della posizione. I principali azionisti possono essere singoli investitori, fondi comuni, hedge fund o istituzioni. L'allegato 13D indica che l'investitore detiene (o ha detenuto) più del 5% della società e intende (o intendeva) perseguire attivamente un cambiamento nella strategia aziendale. L'allegato 13G indica un investimento passivo superiore al 5%.
The share price as of September 5, 2025 is 70,28 / share. Previously, on September 9, 2024, the share price was 50,81 / share. This represents an increase of 38,32% over that period.
Indice del sentiment dei fondi
L'indice del sentiment dei fondi (anche noto come "indice di accumulo di proprietà") individua i titoli più acquistati dai fondi. È il risultato di un sofisticato modello quantitativo multi-fattore che identifica le società con i più alti livelli di accumulo istituzionale. Il modello utilizza una combinazione dell'aumento totale dei proprietari dichiarati, delle variazioni nelle allocazioni di portafoglio di tali proprietari e di altre metriche. Il punteggio varia da 0 a 100: i numeri più alti indicano un livello di accumulo superiore ad altre società, mentre 50 rappresenta la media.
Frequenza di aggiornamento: giornaliera
Consulta Ownership Explorer per visualizzare l'elenco delle aziende con il ranking più alto.
Rapporto put/call istituzionale
Oltre a segnalare le emissioni standard di titoli azionari e di debito, gli istituti con più di 100 milioni di asset in gestione devono anche dichiarare le loro partecipazioni in opzioni put e call. Poiché le opzioni put indicano generalmente un sentiment negativo e le opzioni call un sentiment positivo, possiamo avere un'idea del sentiment istituzionale complessivo attraverso il rapporto tra put e call. Il grafico a destra mostra il rapporto storico put/call per questo strumento.
L'utilizzo del rapporto put/call come indicatore del sentiment degli investitori consente di superare una delle principali lacune dell'utilizzo della proprietà istituzionale totale, ovvero il fatto che una quantità significativa di asset in gestione viene investita passivamente per seguire gli indici. Generalmente, i fondi a gestione passiva non acquistano opzioni, per cui il rapporto put/call riflette più fedelmente il sentiment dei fondi a gestione attiva.
Depositi 13F e NPORT
Le informazioni relative ai depositi 13F sono gratuite. Per accedere alle informazioni relative ai depositi NP è necessario un'abbonamento premium. Le righe verdi indicano le nuove posizioni. Le righe rosse indicano le posizioni chiuse. Fai clic sull'icona del link per visualizzare la cronologia completa delle transazioni.
Esegui l'upgrade
per sbloccare i dati premium ed esportarli in Excel ![]() .
.
| Data di deposito | Fonte | Investitore | Tipo | Prezzo medio (Stima) |
Azioni | Δ Azioni (%) |
Valore dichiarato ($ 1000) |
Δ Valore (%) |
Allocazione del portafoglio (%) |
|
|---|---|---|---|---|---|---|---|---|---|---|
| 2025-05-12 | 13F | Founders Financial Securities Llc | 0 | -100,00 | 0 | |||||
| 2025-04-29 | 13F | Element Wealth, LLC | 0 | -100,00 | 0 | |||||
| 2025-05-15 | 13F | Minot DeBlois Advisors LLC | 0 | -100,00 | 0 | |||||
| 2025-08-14 | 13F | Full Sail Capital, LLC | 234.794 | -2,38 | 15.217 | 12,45 | ||||
| 2025-08-14 | 13F | GWM Advisors LLC | 9.204 | -1,60 | 597 | 13,31 | ||||
| 2025-07-17 | 13F | Janney Montgomery Scott LLC | 67.249 | 15,96 | 4 | 33,33 | ||||
| 2025-08-04 | 13F | Creative Financial Designs Inc /adv | 1.223 | 0,00 | 79 | 16,18 | ||||
| 2025-08-08 | 13F | Capital Investment Advisory Services, LLC | 74 | 0,00 | 5 | 0,00 | ||||
| 2025-07-21 | 13F | Ameritas Advisory Services, LLC | 68 | 4 | ||||||
| 2025-08-12 | 13F | Coldstream Capital Management Inc | 0 | -100,00 | 0 | |||||
| 2025-08-12 | 13F | Integrated Advisors Network LLC | 7.230 | -38,14 | 469 | -28,77 | ||||
| 2025-08-14 | 13F | Fmr Llc | 26.237 | 21,59 | 1.700 | 40,03 | ||||
| 2025-08-01 | 13F | Envestnet Asset Management Inc | 47.388 | -56,78 | 3.071 | -50,21 | ||||
| 2025-08-07 | 13F | Kestra Private Wealth Services, Llc | 32.244 | 2,19 | 2.090 | 17,69 | ||||
| 2025-08-14 | 13F | Snowden Capital Advisors LLC | 24.646 | -7,55 | 1.597 | 6,54 | ||||
| 2025-08-12 | 13F | Charles Schwab Investment Management Inc | 4.421.397 | -1,07 | 286.551 | 13,97 | ||||
| 2025-08-12 | 13F | Howe & Rusling Inc | 363 | 24 | ||||||
| 2025-08-14 | 13F | Quantinno Capital Management LP | 4.783 | 25,87 | 310 | 45,07 | ||||
| 2025-07-02 | 13F | Crumly & Associates Inc. | 123.933 | 11,17 | 8.032 | 28,08 | ||||
| 2025-08-14 | 13F | Stifel Financial Corp | 146.682 | -5,37 | 9.507 | 9,01 | ||||
| 2025-07-30 | 13F | Retirement Planning Group | 0 | -100,00 | 0 | |||||
| 2025-07-14 | 13F | AdvisorNet Financial, Inc | 679 | 0,30 | 44 | 13,16 | ||||
| 2025-04-30 | 13F | Personal Cfo Solutions, Llc | 0 | -100,00 | 0 | -100,00 | ||||
| 2025-07-17 | 13F | Wolff Wiese Magana Llc | 69 | 0,00 | 4 | 33,33 | ||||
| 2025-08-01 | 13F | Ashton Thomas Private Wealth, LLC | 9.650 | 0,35 | 625 | 15,74 | ||||
| 2025-08-07 | 13F | Allworth Financial LP | 486 | -38,87 | 31 | -27,91 | ||||
| 2025-07-14 | 13F | Mechanics Bank Trust Department | 23.816 | -3,05 | 1.544 | 11,65 | ||||
| 2025-07-16 | 13F | Fischer Financial Services, Inc. | 106.462 | 0,17 | 6.878 | 15,04 | ||||
| 2025-04-23 | 13F | Oppenheimer & Co Inc | 0 | -100,00 | 0 | -100,00 | ||||
| 2025-08-14 | 13F | Sunbelt Securities, Inc. | 2.356 | -0,13 | 138 | 4,55 | ||||
| 2025-07-16 | 13F | Brown, Lisle/cummings, Inc. | 43 | 0,00 | 3 | 0,00 | ||||
| 2025-07-23 | 13F | Pillar Financial Advisors, LLC | 97 | 0,00 | 6 | 20,00 | ||||
| 2025-09-04 | 13F/A | Advisor Group Holdings, Inc. | 72.479 | -23,28 | 4.709 | -11,55 | ||||
| 2025-08-06 | 13F | Soltis Investment Advisors LLC | 11.538 | -0,62 | 748 | 14,40 | ||||
| 2025-05-15 | 13F/A | Orion Portfolio Solutions, LLC | 46.461 | 0,14 | 2.614 | -4,04 | ||||
| 2025-08-12 | 13F | Jpmorgan Chase & Co | 20.710 | 155,90 | 1.342 | 194,95 | ||||
| 2025-08-15 | 13F | Kestra Advisory Services, LLC | 164.073 | 8,88 | 10.634 | 25,42 | ||||
| 2025-08-08 | 13F | Pnc Financial Services Group, Inc. | 128 | 8 | ||||||
| 2025-08-12 | 13F | Steward Partners Investment Advisory, Llc | 48.305 | 150.853,12 | 3.131 | 312.900,00 | ||||
| 2025-07-16 | 13F | Southern Capital Advisors, Llc | 77.730 | -0,22 | 5.038 | 14,95 | ||||
| 2025-04-25 | 13F | Colonial River Wealth Management, LLC | 0 | -100,00 | 0 | |||||
| 2025-07-22 | 13F | Yoder Wealth Management, Inc. | 76.265 | 5,20 | 4.943 | 21,19 | ||||
| 2025-05-14 | 13F | BOK Financial Private Wealth, Inc. | 0 | -100,00 | 0 | |||||
| 2025-07-31 | 13F | Cambridge Investment Research Advisors, Inc. | 90.418 | 35,70 | 6 | 66,67 | ||||
| 2025-07-29 | 13F | Stratos Wealth Partners, LTD. | 4.710 | -19,31 | 305 | -7,01 | ||||
| 2025-05-15 | 13F | Hrt Financial Lp | 0 | -100,00 | 0 | |||||
| 2025-07-31 | 13F | Moment Partners, LLC | 3.228 | -12,92 | 209 | 0,48 | ||||
| 2025-08-13 | 13F | KDK Private Wealth Management, LLC | 20.669 | -2,11 | 1.339 | 12,90 | ||||
| 2025-07-24 | 13F | Live Oak Investment Partners | 15.964 | 10,53 | 1.035 | 27,34 | ||||
| 2025-04-25 | 13F | Red Tortoise LLC | 0 | -100,00 | 0 | |||||
| 2025-07-30 | 13F | Gables Capital Management Inc. | 662 | 0,00 | 43 | 13,51 | ||||
| 2025-05-09 | 13F | CoreCap Advisors, LLC | 0 | -100,00 | 0 | |||||
| 2025-04-23 | 13F | Gimbal Financial | 0 | -100,00 | 0 | -100,00 | ||||
| 2025-08-06 | 13F | Agf Management Ltd | 632.275 | 10,62 | 40.978 | 27,43 | ||||
| 2025-07-16 | 13F | Signature Resources Capital Management, LLC | 624 | 40 | ||||||
| 2025-08-08 | 13F | Cetera Investment Advisers | 17.034 | -19,04 | 1.104 | -6,76 | ||||
| 2025-07-18 | 13F | Bartlett & Co. Wealth Management Llc | 39 | 0,00 | 3 | 0,00 | ||||
| 2025-04-29 | 13F | Lee Danner & Bass Inc | 0 | -100,00 | 0 | -100,00 | ||||
| 2025-07-16 | 13F | Badgley Phelps Wealth Managers, LLC | 5.316 | 0,00 | 345 | 15,05 | ||||
| 2025-08-12 | 13F | O'shaughnessy Asset Management, Llc | 3.339 | -7,38 | 216 | 6,93 | ||||
| 2025-07-31 | 13F | Moser Wealth Advisors, LLC | 171 | 11 | ||||||
| 2025-08-08 | 13F | Meridian Wealth Management, LLC | 12.599 | 1,03 | 817 | 16,41 | ||||
| 2025-08-05 | 13F | Beckerman Institutional, LLC | 22.107 | -4,92 | 1 | 0,00 | ||||
| 2025-08-14 | 13F | Jane Street Group, Llc | 0 | -100,00 | 0 | |||||
| 2025-08-12 | 13F | Leigh Baldwin & Co., Llc | 4.181 | 0,05 | 271 | 14,89 | ||||
| 2025-07-16 | 13F | RWM Asset Management, LLC | 194.911 | 4,60 | 12.632 | 20,50 | ||||
| 2025-07-17 | 13F | Independence Bank of Kentucky | 70 | -56,25 | 5 | -55,56 | ||||
| 2025-08-05 | 13F | Sigma Planning Corp | 15.010 | -21,79 | 973 | -9,92 | ||||
| 2025-08-13 | 13F | Jones Financial Companies Lllp | 13.903 | 1,99 | 896 | 17,43 | ||||
| 2025-08-15 | 13F | Tower Research Capital LLC (TRC) | 4.721 | 306 | ||||||
| 2025-08-12 | 13F | Proequities, Inc. | 0 | 0 | ||||||
| 2025-07-25 | 13F | Apollon Wealth Management, LLC | 7.774 | -4,12 | 504 | 10,31 | ||||
| 2025-08-08 | 13F | Crossmark Global Holdings, Inc. | 15.283 | 0,00 | 990 | 15,25 | ||||
| 2025-08-14 | 13F | UBS Group AG | 74.709 | 3,55 | 4.842 | 19,27 | ||||
| 2025-08-14 | 13F | Susquehanna International Group, Llp | 39.443 | 275,11 | 2.556 | 332,49 | ||||
| 2025-08-05 | 13F | Harel Insurance Investments & Financial Services Ltd. | 2.484.280 | 22,67 | 161 | 42,48 | ||||
| 2025-05-09 | 13F | Pathway Financial Advisers, LLC | 0 | -100,00 | 0 | |||||
| 2025-07-16 | 13F/A | CX Institutional | 19.815 | 12,19 | 1 | |||||
| 2025-08-04 | 13F | Creekmur Asset Management LLC | 1 | 0,00 | 0 | |||||
| 2025-08-06 | 13F | Golden State Wealth Management, LLC | 12 | 1 | ||||||
| 2025-04-23 | 13F | Mascagni Wealth Management, Inc. | 0 | -100,00 | 0 | -100,00 | ||||
| 2025-08-12 | 13F | AlphaCore Capital LLC | 162 | 10 | ||||||
| 2025-08-12 | 13F | SRS Capital Advisors, Inc. | 428 | 28 | ||||||
| 2025-07-30 | 13F | Pacific Sun Financial Corp | 19.406 | 2,09 | 1.258 | 17,59 | ||||
| 2025-08-05 | 13F | Dunhill Financial, LLC | 109 | 0,00 | 7 | 16,67 | ||||
| 2025-07-23 | 13F | Elm3 Financial Group, LLC | 7.263 | 471 | ||||||
| 2025-08-12 | 13F | CIBC Private Wealth Group, LLC | 64 | 0,00 | 4 | 33,33 | ||||
| 2025-07-10 | 13F | Charter Oak Capital Management, LLC | 6.265 | -20,08 | 406 | -7,94 | ||||
| 2025-08-13 | 13F | Quadrature Capital Ltd | 0 | -100,00 | 0 | |||||
| 2025-08-08 | 13F | Financial Gravity Companies, Inc. | 151 | 10 | ||||||
| 2025-07-24 | 13F | IFP Advisors, Inc | 699 | 0,00 | 45 | 15,38 | ||||
| 2025-08-19 | 13F | Advisory Services Network, LLC | 11.340 | -82,98 | 752 | -79,96 | ||||
| 2025-08-14 | 13F | Wells Fargo & Company/mn | 269.359 | -5,18 | 17.457 | 9,23 | ||||
| 2025-08-11 | 13F | Capital Square, LLC | 3.365 | -23,07 | 215 | -12,60 | ||||
| 2025-08-12 | 13F | Guerra Advisors Inc | 129.640 | -25,59 | 8.402 | -14,29 | ||||
| 2025-08-14 | 13F | Raymond James Financial Inc | 49.361 | 0,57 | 3.199 | 15,86 | ||||
| 2025-04-23 | 13F | Aspetuck Financial Management LLC | 0 | -100,00 | 0 | -100,00 | ||||
| 2025-08-14 | 13F | Citadel Advisors Llc | 0 | -100,00 | 0 | |||||
| 2025-05-09 | 13F | Legacy Capital Group California, Inc. | 0 | -100,00 | 0 | |||||
| 2025-08-14 | 13F | Kovitz Investment Group Partners, LLC | 65.963 | 44,84 | 4.275 | 66,86 | ||||
| 2025-08-05 | 13F | Lifeworks Advisors, LLC | 31.567 | 0,34 | 2.046 | 15,60 | ||||
| 2025-08-14 | 13F | Federation des caisses Desjardins du Quebec | 922 | 60 | ||||||
| 2025-07-28 | 13F | Rosenberg Matthew Hamilton | 3.110 | 0,00 | 202 | 15,52 | ||||
| 2025-07-29 | 13F | Private Trust Co Na | 24 | 26,32 | 2 | 0,00 | ||||
| 2025-08-13 | 13F | Marshall Wace, Llp | 3.218 | -86,08 | 209 | -84,00 | ||||
| 2025-08-14 | 13F | Boston Private Wealth Llc | 3.342 | 217 | ||||||
| 2025-07-22 | 13F | Grimes & Company, Inc. | 21.192 | 1.373 | ||||||
| 2025-07-18 | 13F | Trust Co Of Vermont | 0 | -100,00 | 0 | |||||
| 2025-07-14 | 13F | GAMMA Investing LLC | 132 | 0,00 | 9 | 14,29 | ||||
| 2025-07-25 | 13F | Atria Wealth Solutions, Inc. | 17.298 | -41,29 | 1.121 | -32,41 | ||||
| 2025-08-26 | 13F/A | Thrivent Financial For Lutherans | 38.103 | 2 | ||||||
| 2025-07-24 | 13F | Court Place Advisors, LLC | 16.805 | 1,22 | 1.089 | 16,60 | ||||
| 2025-05-01 | 13F | Q3 Asset Management | 0 | -100,00 | 0 | |||||
| 2025-08-12 | 13F | Global Retirement Partners, LLC | 187 | -44,01 | 12 | -36,84 | ||||
| 2025-07-17 | 13F | Fifth Third Securities, Inc. | 16.816 | 0,17 | 1.090 | 15,36 | ||||
| 2025-08-06 | 13F | New Millennium Group LLC | 727 | 38,21 | 47 | 62,07 | ||||
| 2025-07-24 | 13F | Blair William & Co/il | 557 | 24,33 | 36 | 44,00 | ||||
| 2025-08-11 | 13F | Aptus Capital Advisors, LLC | 604 | 0,17 | 39 | 18,18 | ||||
| 2025-08-14 | 13F | Mml Investors Services, Llc | 13.592 | 15,31 | 1 | |||||
| 2025-07-09 | 13F | Bank of New Hampshire | 204 | 0,00 | 13 | 18,18 | ||||
| 2025-07-11 | 13F | Farther Finance Advisors, LLC | 1.186 | 0,25 | 77 | 15,15 | ||||
| 2025-08-27 | 13F/A | Brinker Capital Investments, LLC | 30.448 | -34,47 | 1.973 | -24,49 | ||||
| 2025-08-08 | 13F | Avantax Advisory Services, Inc. | 4.902 | -15,10 | 318 | -2,16 | ||||
| 2025-08-13 | 13F | Hsbc Holdings Plc | 4.392 | -58,97 | 285 | -52,82 | ||||
| 2025-04-09 | 13F | HBW Advisory Services LLC | 0 | -100,00 | 0 | -100,00 | ||||
| 2025-04-23 | 13F | PMV Capital Advisers, LLC | 0 | -100,00 | 0 | |||||
| 2025-07-28 | 13F | Harbour Investments, Inc. | 1.595 | 14,42 | 103 | 32,05 | ||||
| 2025-07-31 | 13F | Sage Mountain Advisors LLC | 1.243 | 0,00 | 81 | 15,94 | ||||
| 2025-08-08 | 13F | Hartland & Co., LLC | 375 | 24 | ||||||
| 2025-08-15 | 13F | Morgan Stanley | 428.311 | 5,45 | 27.759 | 21,48 | ||||
| 2025-05-13 | 13F | Heck Capital Advisors, LLC | 0 | -100,00 | 0 | -100,00 | ||||
| 2025-07-22 | 13F | PUREfi Wealth, LLC | 4.233 | 0,00 | 274 | 15,13 | ||||
| 2025-05-13 | 13F | Adviser Investments LLC | 0 | -100,00 | 0 | |||||
| 2025-08-06 | 13F | AE Wealth Management LLC | 119.757 | 7,28 | 7.761 | 23,58 | ||||
| 2025-08-05 | 13F | EPG Wealth Management LLC | 19.458 | -13,78 | 1.261 | -0,63 | ||||
| 2025-04-10 | 13F | Secure Asset Management, LLC | 0 | -100,00 | 0 | |||||
| 2025-05-14 | 13F | Truvestments Capital Llc | 0 | -100,00 | 0 | |||||
| 2025-08-11 | 13F | HighTower Advisors, LLC | 184.383 | 0,93 | 11.950 | 16,26 | ||||
| 2025-08-11 | 13F | Private Advisor Group, LLC | 4.163 | 0,31 | 270 | 15,45 | ||||
| 2025-07-15 | 13F | Lynch & Associates/in | 25.292 | 3,74 | 1.639 | 19,55 | ||||
| 2025-08-12 | 13F | J.w. Cole Advisors, Inc. | 3.642 | 1,53 | 236 | 17,41 | ||||
| 2025-07-22 | 13F | Merit Financial Group, LLC | 17.524 | -30,58 | 1.136 | -20,07 | ||||
| 2025-07-24 | 13F | Williams & Novak, LLC | 4.573 | -3,48 | 296 | 10,45 | ||||
| 2025-08-14 | 13F | IHT Wealth Management, LLC | 4.807 | 312 | ||||||
| 2025-08-14 | 13F | Bank Of America Corp /de/ | 70.285 | 7,73 | 4.555 | 24,11 | ||||
| 2025-05-12 | 13F | Independent Advisor Alliance | 0 | -100,00 | 0 | |||||
| 2025-08-06 | 13F | Decker Retirement Planning Inc. | 573 | 0,00 | 37 | 15,63 | ||||
| 2025-08-08 | 13F | Independence Financial Advisors, LLC | 146.441 | -8,33 | 9.491 | 5,60 | ||||
| 2025-07-25 | 13F | Cwm, Llc | 200 | 100,00 | 0 | |||||
| 2025-08-12 | 13F | Franklin Resources Inc | 0 | -100,00 | 0 | |||||
| 2025-08-08 | 13F | Creative Planning | 10.702 | 43,79 | 694 | 65,79 | ||||
| 2025-08-04 | 13F | Integrity Alliance, Llc. | 0 | -100,00 | 0 | |||||
| 2025-05-21 | 13F/A | Geneos Wealth Management Inc. | 46 | 3 | ||||||
| 2025-07-16 | 13F | Legend Financial Advisors, Inc. | 283 | 18 | ||||||
| 2025-05-15 | 13F | Prospera Financial Services Inc | 0 | -100,00 | 0 | |||||
| 2025-08-04 | 13F | Arkadios Wealth Advisors | 23.978 | 1,48 | 1.554 | 16,85 | ||||
| 2025-07-28 | 13F | Kiker Wealth Management, LLC | 0 | -100,00 | 0 | |||||
| 2025-07-24 | 13F | Us Bancorp \de\ | 36 | -77,78 | 2 | -77,78 | ||||
| 2025-07-10 | 13F | Wealth Enhancement Advisory Services, Llc | 9.310 | -1,89 | 603 | 13,13 | ||||
| 2025-08-15 | 13F | CI Private Wealth, LLC | 3.113 | 202 | ||||||
| 2025-08-04 | 13F | Assetmark, Inc | 228 | 15 | ||||||
| 2025-08-13 | 13F | Colonial Trust Co / SC | 691 | -24,89 | 45 | -13,73 | ||||
| 2025-08-14 | 13F | Main Street Financial Solutions, LLC | 14.256 | -4,35 | 924 | 10,14 | ||||
| 2025-08-11 | 13F | Brown Brothers Harriman & Co | 8.361 | 243,93 | 542 | 297,79 | ||||
| 2025-07-08 | 13F | Atlas Brown,Inc. | 10.356 | -1,12 | 671 | 13,92 | ||||
| 2025-07-16 | 13F | American National Bank | 12.878 | -1,69 | 835 | 13,16 | ||||
| 2025-08-06 | 13F | Atlantic Union Bankshares Corp | 400 | 26 | ||||||
| 2025-08-13 | 13F | Northwestern Mutual Wealth Management Co | 1.382.346 | 9,42 | 89.590 | 26,05 | ||||
| 2025-08-14 | 13F | Mariner, LLC | 10.338 | 15,61 | 670 | 33,20 | ||||
| 2025-04-24 | 13F | HighMark Wealth Management LLC | 0 | -100,00 | 0 | |||||
| 2025-08-04 | 13F | Savvy Advisors, Inc. | 4.788 | -1,05 | 310 | 13,97 | ||||
| 2025-08-11 | 13F | Anfield Capital Management, LLC | 163 | 185,96 | 11 | 233,33 | ||||
| 2025-08-14 | 13F | Comerica Bank | 2.817 | 0,11 | 183 | 15,19 | ||||
| 2025-05-01 | 13F | Fulcrum Equity Management | 0 | -100,00 | 0 | |||||
| 2025-07-28 | 13F | Copia Wealth Management | 125 | 0,00 | 8 | 14,29 | ||||
| 2025-08-14 | 13F | Royal Bank Of Canada | 11.009 | 0,20 | 714 | 15,53 | ||||
| 2025-05-12 | 13F | Sandy Spring Bank | 400 | 0,00 | 23 | -4,35 | ||||
| 2025-08-12 | 13F | Pathstone Holdings, LLC | 4.491 | 15,54 | 291 | 33,49 | ||||
| 2025-08-06 | 13F | Kcm Investment Advisors Llc | 7.302 | 0,00 | 473 | 15,37 | ||||
| 2025-07-18 | 13F | Vicus Capital | 289.689 | 4,39 | 18.775 | 20,25 | ||||
| 2025-08-06 | 13F | Stonebridge Financial Planning Group, LLC | 16.225 | 3,85 | 1.052 | 19,70 | ||||
| 2025-08-07 | 13F | Birchcreek Wealth Management, LLC | 19.342 | 12,11 | 1.254 | 29,18 | ||||
| 2025-08-13 | 13F | Lido Advisors, LLC | 1.867.729 | 4,49 | 121.048 | 20,37 | ||||
| 2025-05-08 | 13F | Plante Moran Financial Advisors, LLC | 0 | -100,00 | 0 | -100,00 | ||||
| 2025-08-19 | 13F | Asset Dedication, LLC | 334 | 22 | ||||||
| 2025-05-15 | 13F | Mercer Global Advisors Inc /adv | 0 | -100,00 | 0 | |||||
| 2025-08-14 | 13F | Vista Investment Management | 18.037 | 0,51 | 1.169 | 15,76 | ||||
| 2025-08-14 | 13F | Two Sigma Investments, Lp | 43.000 | 2.787 | ||||||
| 2025-08-06 | 13F | Mcrae Capital Management Inc | 3.116 | 202 | ||||||
| 2025-08-14 | 13F | Qube Research & Technologies Ltd | 4.920 | 1.423,22 | 319 | 1.666,67 | ||||
| 2025-08-04 | 13F | Prairie Wealth Advisors, Inc. | 4.166 | 1,21 | 270 | 16,45 | ||||
| 2025-08-12 | 13F | Atlas Capital Advisors Llc | 48.474 | -26,72 | 3.142 | -15,59 | ||||
| 2025-08-15 | 13F | Chapman Financial Group, Llc | 49 | 3 | ||||||
| 2025-07-28 | 13F | Acorn Financial Advisory Services Inc /adv | 5.977 | 31,91 | 387 | 52,36 | ||||
| 2025-07-21 | 13F | Exchange Capital Management, Inc. | 30.879 | -6,30 | 2.001 | 7,99 | ||||
| 2025-07-14 | 13F | Park Avenue Securities Llc | 3.098 | 0 | ||||||
| 2025-07-15 | 13F | Elevated Capital Advisors, LLC | 5.919 | 0,00 | 333 | 0,00 | ||||
| 2025-07-23 | 13F | Kingswood Wealth Advisors, Llc | 8.510 | 5,49 | 552 | 21,63 | ||||
| 2025-08-06 | 13F | Valued Wealth Advisors LLC | 178 | 0,00 | 12 | 10,00 | ||||
| 2025-07-14 | 13F | UMA Financial Services, Inc. | 166 | 0,00 | 11 | 11,11 | ||||
| 2025-07-17 | 13F | Sound Income Strategies, LLC | 546 | 0,00 | 35 | 16,67 | ||||
| 2025-08-12 | 13F | Trexquant Investment LP | 4.845 | 11,56 | 314 | 28,69 | ||||
| 2025-05-14 | 13F | River Wealth Advisors LLC | 0 | -100,00 | 0 | |||||
| 2025-08-13 | 13F | Congress Wealth Management LLC / DE / | 43.008 | 24,61 | 2.787 | 43,59 | ||||
| 2025-07-17 | 13F | Smith, Salley & Associates | 58.636 | 0,18 | 3.800 | 15,43 | ||||
| 2025-05-01 | 13F | High Note Wealth, LLC | 0 | -100,00 | 0 | |||||
| 2025-08-15 | 13F | Equitable Holdings, Inc. | 6.889 | -0,13 | 446 | 14,95 | ||||
| 2025-08-13 | 13F | Russell Investments Group, Ltd. | 189 | 26,85 | 12 | 50,00 | ||||
| 2025-07-30 | 13F | VCI Wealth Management LLC | 21.409 | 7,40 | 1.388 | 23,73 | ||||
| 2025-08-12 | 13F | Nemes Rush Group LLC | 0 | -100,00 | 0 | |||||
| 2025-07-16 | 13F | Beaumont Financial Advisors, LLC | 28.557 | 1.851 | ||||||
| 2025-08-05 | 13F | Bank Of Montreal /can/ | 0 | -100,00 | 0 | |||||
| 2025-08-14 | 13F | Colony Group, LLC | 12.274 | -3,13 | 795 | 11,66 | ||||
| 2025-08-11 | 13F | Citigroup Inc | 26.029 | 40,68 | 1.687 | 62,12 | ||||
| 2025-08-08 | 13F | Smithfield Trust Co | 6.650 | 41,19 | 0 | |||||
| 2025-07-25 | 13F | Envestnet Portfolio Solutions, Inc. | 0 | -100,00 | 0 | |||||
| 2025-07-28 | 13F | Axxcess Wealth Management, Llc | 0 | -100,00 | 0 | |||||
| 2025-08-14 | 13F | LaSalle St. Investment Advisors, LLC | 4.053 | -18,17 | 0 | |||||
| 2025-08-06 | 13F | Maltin Wealth Management, Inc. | 58.061 | 2,03 | 3.763 | 17,53 | ||||
| 2025-08-11 | 13F | Principal Securities, Inc. | 9.184 | 1.166,76 | 595 | 1.316,67 | ||||
| 2025-08-06 | 13F | Commonwealth Equity Services, Llc | 265.779 | 5,26 | 17 | 21,43 | ||||
| 2025-08-12 | 13F | LPL Financial LLC | 241.133 | 32,54 | 15.628 | 52,68 | ||||
| 2025-07-10 | 13F | Sovran Advisors, LLC | 6.256 | 10,61 | 401 | 35,02 | ||||
| 2025-08-01 | 13F | Rossby Financial, LCC | 531 | 0,00 | 34 | 17,24 | ||||
| 2025-08-11 | 13F | Beaumont Capital Management, LLC | 0 | -100,00 | 0 | |||||
| 2025-08-14 | 13F | Ameriprise Financial Inc | 4.280 | 1,21 | 277 | 16,88 | ||||
| 2025-08-11 | 13F | WPG Advisers, LLC | 79 | 0,00 | 5 | 25,00 |