Statistiche di base
| Proprietari istituzionali | 164 total, 164 long only, 0 short only, 0 long/short - change of -4,07% MRQ |
| Allocazione media del portafoglio | 0.1232 % - change of -8,20% MRQ |
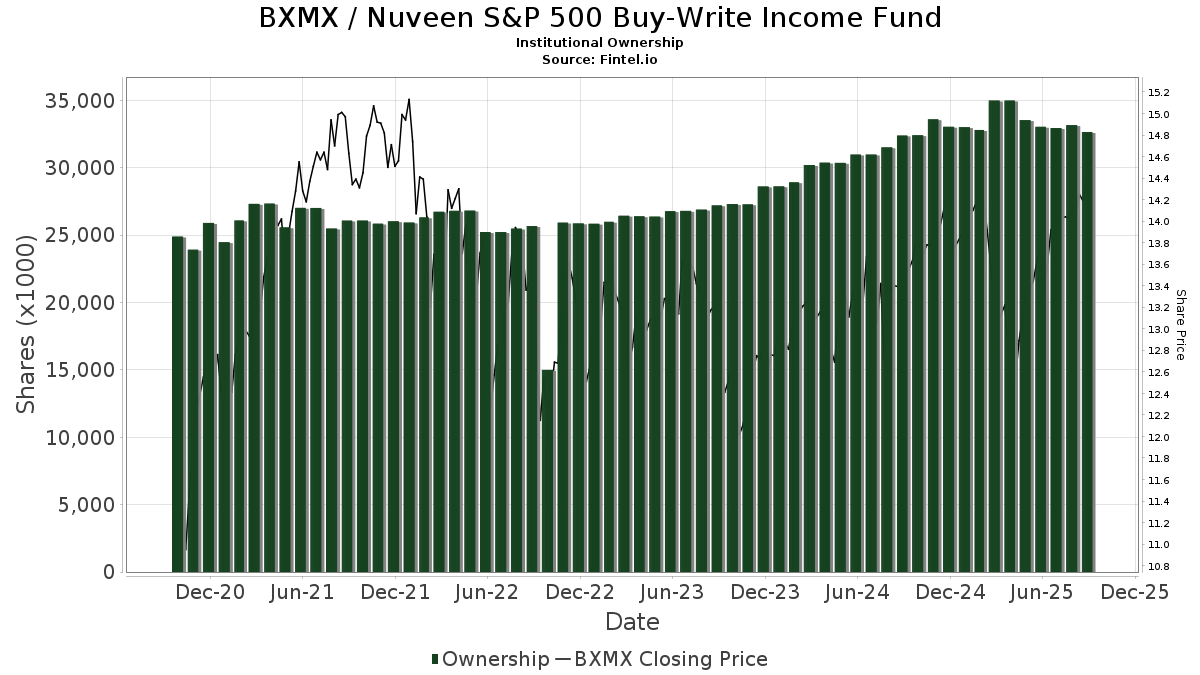
| Azioni istituzionali (Long) | 32.658.930 (ex 13D/G) - change of -0,30MM shares -0,91% MRQ |
| Valore istituzionale (Long) | $ 433.203 USD ($1000) |
Proprietà istituzionale e azionisti
Nuveen S&P 500 Buy-Write Income Fund (US:BXMX) ha 164 proprietari istituzionali e azionisti che hanno presentato i moduli 13D/G o 13F alla Securities Exchange Commission (SEC). Queste istituzioni detengono un totale di 32,658,930 azioni. I maggiori azionisti includono Morgan Stanley, Wells Fargo & Company/mn, LPL Financial LLC, Invesco Ltd., UBS Group AG, PCEF - Invesco CEF Income Composite ETF, Raymond James Financial Inc, Advisors Asset Management, Inc., Allspring Global Investments Holdings, LLC, and Bank Of America Corp /de/ .
(Nuveen S&P 500 Buy-Write Income Fund (NYSE:BXMX) la struttura proprietaria istituzionale mostra le attuali posizioni nella società da parte di istituzioni e fondi, nonché le ultime variazioni nella dimensione della posizione. I principali azionisti possono essere singoli investitori, fondi comuni, hedge fund o istituzioni. L'allegato 13D indica che l'investitore detiene (o ha detenuto) più del 5% della società e intende (o intendeva) perseguire attivamente un cambiamento nella strategia aziendale. L'allegato 13G indica un investimento passivo superiore al 5%.
The share price as of September 5, 2025 is 14,27 / share. Previously, on September 6, 2024, the share price was 13,19 / share. This represents an increase of 8,19% over that period.
Indice del sentiment dei fondi
L'indice del sentiment dei fondi (anche noto come "indice di accumulo di proprietà") individua i titoli più acquistati dai fondi. È il risultato di un sofisticato modello quantitativo multi-fattore che identifica le società con i più alti livelli di accumulo istituzionale. Il modello utilizza una combinazione dell'aumento totale dei proprietari dichiarati, delle variazioni nelle allocazioni di portafoglio di tali proprietari e di altre metriche. Il punteggio varia da 0 a 100: i numeri più alti indicano un livello di accumulo superiore ad altre società, mentre 50 rappresenta la media.
Frequenza di aggiornamento: giornaliera
Consulta Ownership Explorer per visualizzare l'elenco delle aziende con il ranking più alto.
Rapporto put/call istituzionale
Oltre a segnalare le emissioni standard di titoli azionari e di debito, gli istituti con più di 100 milioni di asset in gestione devono anche dichiarare le loro partecipazioni in opzioni put e call. Poiché le opzioni put indicano generalmente un sentiment negativo e le opzioni call un sentiment positivo, possiamo avere un'idea del sentiment istituzionale complessivo attraverso il rapporto tra put e call. Il grafico a destra mostra il rapporto storico put/call per questo strumento.
L'utilizzo del rapporto put/call come indicatore del sentiment degli investitori consente di superare una delle principali lacune dell'utilizzo della proprietà istituzionale totale, ovvero il fatto che una quantità significativa di asset in gestione viene investita passivamente per seguire gli indici. Generalmente, i fondi a gestione passiva non acquistano opzioni, per cui il rapporto put/call riflette più fedelmente il sentiment dei fondi a gestione attiva.
Depositi 13F e NPORT
Le informazioni relative ai depositi 13F sono gratuite. Per accedere alle informazioni relative ai depositi NP è necessario un'abbonamento premium. Le righe verdi indicano le nuove posizioni. Le righe rosse indicano le posizioni chiuse. Fai clic sull'icona del link per visualizzare la cronologia completa delle transazioni.
Esegui l'upgrade
per sbloccare i dati premium ed esportarli in Excel ![]() .
.
| Data di deposito | Fonte | Investitore | Tipo | Prezzo medio (Stima) |
Azioni | Δ Azioni (%) |
Valore dichiarato ($ 1000) |
Δ Valore (%) |
Allocazione del portafoglio (%) |
|
|---|---|---|---|---|---|---|---|---|---|---|
| 2025-07-15 | 13F | World Equity Group, Inc. | 26.750 | 102,65 | 371 | 114,45 | ||||
| 2025-07-10 | 13F | Oliver Lagore Vanvalin Investment Group | 9.597 | 0,00 | 126 | -6,72 | ||||
| 2025-08-14 | 13F | Hilltop Holdings Inc. | 39.598 | -11,90 | 550 | -6,79 | ||||
| 2025-08-18 | 13F | Hollencrest Capital Management | 8.609 | 0,00 | 119 | 6,25 | ||||
| 2025-07-16 | 13F | Signaturefd, Llc | 2.511 | 35 | ||||||
| 2025-08-14 | 13F | Polar Asset Management Partners Inc. | 156.696 | 2.175 | ||||||
| 2025-07-16 | 13F | Twelve Points Wealth Management LLC | 432.690 | 4,27 | 6.006 | 10,30 | ||||
| 2025-08-12 | 13F | Wealth Dimensions Group, Ltd. | 10.943 | -10,69 | 152 | -5,62 | ||||
| 2025-07-24 | 13F | IFP Advisors, Inc | 5.200 | -7,14 | 72 | -1,37 | ||||
| 2025-07-29 | 13F | International Assets Investment Management, Llc | 47.367 | 10,33 | 657 | 16,70 | ||||
| 2025-08-14 | 13F | GWM Advisors LLC | 87.831 | 102,31 | 1.219 | 114,24 | ||||
| 2025-08-11 | 13F | Delta Asset Management Llc/tn | 1.800 | 0,00 | 25 | 4,35 | ||||
| 2025-03-12 | 13F/A | Private Capital Management Llc | 0 | -100,00 | 0 | |||||
| 2025-08-12 | 13F | Advisors Asset Management, Inc. | 927.730 | 18,19 | 12.877 | 25,03 | ||||
| 2025-08-07 | 13F | BOK Financial Private Wealth, Inc. | 1.957 | 0,00 | 28 | 3,85 | ||||
| 2025-08-14 | 13F | Apriem Advisors | 17.968 | 0,00 | 249 | 5,96 | ||||
| 2025-07-17 | 13F | Janney Montgomery Scott LLC | 269.380 | 27,32 | 4 | 50,00 | ||||
| 2025-08-06 | 13F | Maltin Wealth Management, Inc. | 18.291 | 1,72 | 254 | 7,66 | ||||
| 2025-07-25 | 13F | Hazlett, Burt & Watson, Inc. | 7.594 | -21,89 | 0 | |||||
| 2025-07-23 | 13F | Joel Isaacson & Co., LLC | 0 | -100,00 | 0 | |||||
| 2025-07-24 | 13F | Costello Asset Management, INC | 100 | 0,00 | 1 | 0,00 | ||||
| 2025-08-14 | 13F | Mml Investors Services, Llc | 17.905 | 5,32 | 0 | |||||
| 2025-08-07 | 13F | Readystate Asset Management Lp | 0 | -100,00 | 0 | |||||
| 2025-08-08 | 13F | Cornerstone Advisors, LLC | 380.684 | -45,66 | 5.284 | -42,52 | ||||
| 2025-08-13 | 13F | StoneX Group Inc. | 26.437 | -20,26 | 373 | -16,03 | ||||
| 2025-07-25 | 13F | Cwm, Llc | 1.748 | 0,00 | 0 | |||||
| 2025-07-08 | 13F | Nbc Securities, Inc. | 28.864 | -0,71 | 0 | |||||
| 2025-07-17 | 13F | Venture Visionary Partners LLC | 52.681 | -3,03 | 731 | 2,67 | ||||
| 2025-08-14 | 13F | Wiley Bros.-aintree Capital, Llc | 87.808 | 67,66 | 1.219 | 78,59 | ||||
| 2025-07-29 | 13F | Hoese & Co LLP | 875 | -50,00 | 12 | -45,45 | ||||
| 2025-08-01 | 13F | Envestnet Asset Management Inc | 167.022 | -4,50 | 2.318 | 1,05 | ||||
| 2025-08-13 | 13F | Kayne Anderson Rudnick Investment Management Llc | 465 | 0,00 | 6 | 0,00 | ||||
| 2025-08-12 | 13F | Steward Partners Investment Advisory, Llc | 50.446 | 1,03 | 700 | 6,87 | ||||
| 2025-08-14 | 13F | Two Sigma Investments, Lp | 169.380 | 2.351 | ||||||
| 2025-08-13 | 13F | Global Endowment Management, LP | 0 | -100,00 | 0 | |||||
| 2025-05-08 | 13F | Plante Moran Financial Advisors, LLC | 0 | -100,00 | 0 | |||||
| 2025-04-29 | 13F | Pensionmark Financial Group, Llc | 0 | -100,00 | 0 | |||||
| 2025-08-12 | 13F | LPL Financial LLC | 1.629.051 | 0,85 | 22.611 | 6,69 | ||||
| 2025-08-12 | 13F | Proequities, Inc. | 0 | 0 | ||||||
| 2025-08-07 | 13F | Hennion & Walsh Asset Management, Inc. | 104.200 | 99,24 | 1.446 | 110,79 | ||||
| 2025-08-14 | 13F | Royal Bank Of Canada | 479.512 | -3,25 | 6.656 | 2,37 | ||||
| 2025-08-12 | 13F | Pathstone Holdings, LLC | 17.537 | 0,00 | 243 | 5,65 | ||||
| 2025-08-15 | 13F | Kestra Advisory Services, LLC | 74.671 | 11,09 | 1.036 | 17,59 | ||||
| 2025-08-04 | 13F | Carret Asset Management, Llc | 10.000 | 0,00 | 139 | 5,34 | ||||
| 2025-08-15 | 13F | Captrust Financial Advisors | 15.769 | 219 | ||||||
| 2025-08-13 | 13F | Invesco Ltd. | 1.507.507 | -0,41 | 20.924 | 5,36 | ||||
| 2025-07-15 | 13F | Bay Capital Advisors, LLC | 15.950 | 0,00 | 221 | 5,74 | ||||
| 2025-08-15 | 13F | Puff Wealth Management, Llc | 81.552 | 3,15 | 1.132 | 9,06 | ||||
| 2025-08-12 | 13F | Wood Tarver Financial Group, LLC | 21 | 0,00 | 0 | |||||
| 2025-07-25 | 13F | Northwest Capital Management Inc | 978 | 0,00 | 14 | 8,33 | ||||
| 2025-07-31 | 13F | Cambridge Investment Research Advisors, Inc. | 567.331 | 1,63 | 8 | 0,00 | ||||
| 2025-07-25 | 13F | Stephens Consulting, LLC | 0 | -100,00 | 0 | |||||
| 2025-05-12 | 13F | Independent Advisor Alliance | 0 | -100,00 | 0 | -100,00 | ||||
| 2025-08-07 | 13F | Kestra Private Wealth Services, Llc | 18.292 | 5,02 | 254 | 10,96 | ||||
| 2025-08-14 | 13F | Wells Fargo & Company/mn | 1.689.550 | 1,44 | 23.451 | 7,32 | ||||
| 2025-07-28 | 13F | BRYN MAWR TRUST Co | 504 | 0,00 | 7 | 0,00 | ||||
| 2025-03-11 | 13F/A | Elequin Capital Lp | 0 | -100,00 | 0 | |||||
| 2025-07-14 | 13F | Matrix Trust Co | 57.855 | 0,67 | 1 | |||||
| 2025-07-09 | 13F | Triumph Capital Management | 17.432 | 0,00 | 242 | 5,70 | ||||
| 2025-05-15 | 13F | Talon Private Wealth, LLC | 0 | -100,00 | 0 | -100,00 | ||||
| 2025-05-05 | 13F | Lindbrook Capital, Llc | 690.062 | 0,00 | 9.054 | -6,22 | ||||
| 2025-07-14 | 13F | Park Avenue Securities Llc | 122.039 | -4,13 | 2 | 0,00 | ||||
| 2025-08-11 | 13F | Blue Bell Private Wealth Management, Llc | 5.680 | 2,64 | 79 | 8,33 | ||||
| 2025-08-06 | 13F | Commonwealth Equity Services, Llc | 327.849 | -6,20 | 5 | 0,00 | ||||
| 2025-08-07 | 13F | Commerce Bank | 15.819 | 0,00 | 220 | 5,80 | ||||
| 2025-05-06 | 13F | MCF Advisors LLC | 0 | -100,00 | 0 | |||||
| 2025-08-05 | 13F | Bank of New York Mellon Corp | 12.762 | 8,09 | 177 | 14,94 | ||||
| 2025-08-14 | 13F | Susquehanna International Group, Llp | 0 | -100,00 | 0 | |||||
| 2025-07-21 | 13F | Ameritas Advisory Services, LLC | 3.090 | 43 | ||||||
| 2025-08-12 | 13F | Landscape Capital Management, L.l.c. | 0 | -100,00 | 0 | |||||
| 2025-05-08 | 13F | Private Advisory Group LLC | 0 | -100,00 | 0 | |||||
| 2025-08-11 | 13F | Rothschild Investment Llc | 693 | 0,00 | 10 | 0,00 | ||||
| 2025-08-14 | 13F | Atomi Financial Group, Inc. | 77.062 | -5,89 | 1.070 | -0,47 | ||||
| 2025-08-11 | 13F | Citigroup Inc | 2.650 | 0,00 | 37 | 5,88 | ||||
| 2025-08-27 | NP | RYDEX VARIABLE TRUST - Multi-Hedge Strategies Fund Variable Annuity | 230 | -19,30 | 3 | 0,00 | ||||
| 2025-07-15 | 13F | Focused Wealth Management, Inc | 333.887 | 1,57 | 4.634 | 7,47 | ||||
| 2025-08-05 | 13F | Key FInancial Inc | 37 | 0,00 | 1 | |||||
| 2025-07-24 | 13F | Leo Wealth, LLC | 34.991 | 0,00 | 486 | 5,66 | ||||
| 2025-08-14 | 13F | Mariner, LLC | 16.381 | 12,93 | 227 | 19,47 | ||||
| 2025-08-19 | 13F | Newbridge Financial Services Group, Inc. | 1.061 | 15 | ||||||
| 2025-04-15 | 13F | Fiduciary Financial Group, Llc | 0 | -100,00 | 0 | |||||
| 2025-07-28 | NP | PCEF - Invesco CEF Income Composite ETF This fund is a listed as child fund of Invesco Ltd. and if that institution has disclosed ownership in this security, then these positions will not be double counted when calculating total shares and total value | 1.465.087 | -0,51 | 19.735 | -3,24 | ||||
| 2025-08-13 | 13F | Rsm Us Wealth Management Llc | 17.671 | -0,82 | 250 | 5,04 | ||||
| 2025-05-06 | 13F | Venturi Wealth Management, LLC | 0 | -100,00 | 0 | |||||
| 2025-07-22 | 13F | DAVENPORT & Co LLC | 13.927 | 0,00 | 193 | 6,04 | ||||
| 2025-07-30 | 13F | D.a. Davidson & Co. | 48.594 | 0,70 | 674 | 6,48 | ||||
| 2025-08-14 | 13F | UBS Group AG | 1.488.300 | -4,04 | 20.658 | 1,52 | ||||
| 2025-08-04 | 13F | Spire Wealth Management | 37.364 | 10,23 | 519 | 16,67 | ||||
| 2025-08-08 | 13F | Avantax Advisory Services, Inc. | 22.147 | 18,73 | 307 | 25,82 | ||||
| 2025-08-05 | 13F | Prosperity Wealth Management, Inc. | 123.745 | 1,21 | 1.718 | 7,04 | ||||
| 2025-08-06 | 13F | Marco Investment Management Llc | 27.300 | 0,00 | 379 | 5,59 | ||||
| 2025-08-12 | 13F | Founders Financial Alliance, LLC | 12.908 | -0,20 | 179 | 5,92 | ||||
| 2025-08-14 | 13F | Kovitz Investment Group Partners, LLC | 105.731 | 39,30 | 1.468 | 47,54 | ||||
| 2025-08-14 | 13F | Bank Of America Corp /de/ | 823.947 | 2,94 | 11.436 | 8,90 | ||||
| 2025-08-12 | 13F | Armor Investment Advisors, LLC | 19.673 | -0,07 | 273 | 5,81 | ||||
| 2025-07-28 | 13F | Harbour Investments, Inc. | 1.825 | 25 | ||||||
| 2025-08-19 | 13F | National Asset Management, Inc. | 31.119 | -70,37 | 432 | -70,66 | ||||
| 2025-07-29 | 13F | Private Trust Co Na | 2.000 | -12,78 | 28 | -10,00 | ||||
| 2025-07-25 | 13F | Allspring Global Investments Holdings, LLC | 905.057 | 42,10 | 12.562 | 50,34 | ||||
| 2025-07-14 | 13F | Farmers & Merchants Investments Inc | 1.850 | 0,00 | 26 | 4,17 | ||||
| 2025-08-14 | 13F | NCP Inc. | 127.332 | 0,82 | 1.767 | 6,64 | ||||
| 2025-07-29 | 13F | Sims Investment Management, Llc | 60.100 | 0,00 | 834 | 5,84 | ||||
| 2025-08-14 | 13F | Glen Eagle Advisors, LLC | 15.970 | -21,96 | 222 | -17,54 | ||||
| 2025-08-14 | 13F | Cnh Partners Llc | 361.193 | -23,44 | 4.992 | -18,61 | ||||
| 2025-08-13 | 13F | Baird Financial Group, Inc. | 29.808 | -4,34 | 414 | 1,23 | ||||
| 2025-08-05 | 13F | Shaker Financial Services, LLC | 77.595 | -62,94 | 1.106 | -60,77 | ||||
| 2025-08-13 | 13F | Colonial Trust Co / SC | 254 | 0,00 | 3 | 0,00 | ||||
| 2025-08-04 | 13F | Horizon Wealth Management, LLC | 11.660 | 0,00 | 162 | 5,92 | ||||
| 2025-07-16 | 13F | St Germain D J Co Inc | 187 | 0,00 | 3 | 0,00 | ||||
| 2025-08-13 | 13F | Colonial Trust Advisors | 2.200 | 31 | ||||||
| 2025-08-27 | NP | RYMSX - Guggenheim Multi-Hedge Strategies Fund Class P | 137 | -37,44 | 2 | -50,00 | ||||
| 2025-08-11 | 13F | Annis Gardner Whiting Capital Advisors, LLC | 3.000 | 0,00 | 42 | 5,13 | ||||
| 2025-08-12 | 13F | CIBC Private Wealth Group, LLC | 33 | 0,00 | 0 | |||||
| 2025-08-18 | 13F | Arq Wealth Advisors, Llc | 0 | -100,00 | 0 | |||||
| 2025-08-05 | 13F | Sage Capital Management, LLC | 255.095 | 2,35 | 3.541 | 8,26 | ||||
| 2025-08-12 | 13F | Coldstream Capital Management Inc | 0 | -100,00 | 0 | |||||
| 2025-08-06 | 13F | SOUTH STATE Corp | 978 | 0,00 | 14 | 8,33 | ||||
| 2025-07-25 | 13F | Integrated Capital Management, Inc. | 23.069 | 2,70 | 320 | 8,84 | ||||
| 2025-08-11 | 13F | Nations Financial Group Inc, /ia/ /adv | 20.877 | -6,92 | 290 | -1,70 | ||||
| 2025-08-14 | 13F | Wealth Preservation Advisors, LLC | 7.655 | 0,00 | 106 | 6,00 | ||||
| 2025-08-05 | 13F | Huntington National Bank | 35 | 0,00 | ||||||
| 2025-07-15 | 13F | Financial Management Professionals, Inc. | 314 | 0,00 | 4 | 0,00 | ||||
| 2025-08-04 | 13F | Kovack Advisors, Inc. | 12.778 | -3,77 | 177 | 1,72 | ||||
| 2025-04-22 | 13F | Castleview Partners, Llc | 0 | -100,00 | 0 | |||||
| 2025-07-24 | 13F | Us Bancorp \de\ | 5.000 | 0,00 | 69 | 6,15 | ||||
| 2025-07-18 | 13F | Truist Financial Corp | 41.249 | -0,07 | 573 | 5,73 | ||||
| 2025-07-07 | 13F | Bangor Savings Bank | 1.057 | -45,99 | 15 | -44,00 | ||||
| 2025-08-13 | 13F | Summit Financial, LLC | 26.414 | 116,45 | 373 | 133,13 | ||||
| 2025-08-06 | 13F | Prospera Financial Services Inc | 100.783 | 1,49 | 1.399 | 7,37 | ||||
| 2025-07-08 | 13F | Apella Capital, LLC | 15.035 | 0,00 | 209 | 8,33 | ||||
| 2025-07-21 | 13F | Pflug Koory, LLC | 33.682 | 0,00 | 468 | 5,90 | ||||
| 2025-07-17 | 13F | Jackson, Grant Investment Advisers, Inc. | 31.103 | 1,49 | 432 | 7,21 | ||||
| 2025-08-14 | 13F | Ameriprise Financial Inc | 313.236 | -21,45 | 4.334 | -17,17 | ||||
| 2025-08-20 | NP | ADANX - AQR Diversified Arbitrage Fund Class N | 119.046 | -13,55 | 1.652 | -8,53 | ||||
| 2025-08-06 | 13F | Moors & Cabot, Inc. | 73.052 | -44,65 | 1.014 | -41,48 | ||||
| 2025-08-08 | 13F | Cetera Investment Advisers | 153.547 | 8,89 | 2.131 | 15,19 | ||||
| 2025-08-18 | 13F | Geneos Wealth Management Inc. | 9.252 | -1,76 | 128 | 4,07 | ||||
| 2025-07-08 | 13F | Arlington Trust Co LLC | 6.000 | 0,00 | 83 | 6,41 | ||||
| 2025-07-23 | 13F | Tyche Wealth Partners LLC | 25.640 | 0,07 | 356 | 5,65 | ||||
| 2025-08-14 | 13F | CoreFirst Bank & Trust | 930 | 13 | ||||||
| 2025-08-22 | NP | Cornerstone Total Return Fund Inc | 87.486 | -63,05 | 1.214 | -60,91 | ||||
| 2025-07-16 | 13F | Encompass Wealth Advisors, Llc | 14.207 | -37,20 | 197 | -33,45 | ||||
| 2025-04-23 | 13F | Continuum Advisory, LLC | 0 | -100,00 | 0 | |||||
| 2025-08-13 | 13F | Northwestern Mutual Wealth Management Co | 47.387 | 3,15 | 658 | 9,14 | ||||
| 2025-05-15 | 13F | Gwn Securities Inc. | 0 | -100,00 | 0 | |||||
| 2025-08-14 | 13F | Raymond James Financial Inc | 951.409 | -0,65 | 13.206 | 5,11 | ||||
| 2025-08-07 | 13F | Allworth Financial LP | 36.858 | 244,79 | 512 | 278,52 | ||||
| 2025-08-11 | 13F | HighTower Advisors, LLC | 37.334 | -13,43 | 518 | -8,32 | ||||
| 2025-07-07 | 13F | Centurion Wealth Management LLC | 12.318 | 0,00 | 171 | -1,16 | ||||
| 2025-07-10 | 13F | Global Financial Private Client, LLC | 0 | -100,00 | 0 | |||||
| 2025-07-29 | 13F | Commons Capital, Llc | 15.127 | 1,34 | 210 | 7,18 | ||||
| 2025-07-24 | 13F | Eastern Bank | 2.199 | 0,00 | 31 | 7,14 | ||||
| 2025-08-11 | 13F | Alteri Wealth LLC | 47.955 | 10,48 | 666 | 16,87 | ||||
| 2025-06-04 | 13F | Pvg Asset Management Corp | 0 | -100,00 | 0 | |||||
| 2025-07-01 | 13F | Harbor Investment Advisory, Llc | 2.468 | 0,00 | 34 | 6,25 | ||||
| 2025-07-25 | 13F | Atria Wealth Solutions, Inc. | 14.914 | -69,25 | 211 | -67,34 | ||||
| 2025-07-21 | 13F | Patriot Financial Group Insurance Agency, LLC | 27.630 | 0,93 | 384 | 6,69 | ||||
| 2025-08-08 | 13F | Pnc Financial Services Group, Inc. | 32.256 | 29,21 | 448 | 36,70 | ||||
| 2025-05-14 | 13F | ICONIQ Capital, LLC | 0 | -100,00 | 0 | |||||
| 2025-07-16 | 13F | Investment Partners Asset Management, Inc. | 37.219 | -0,24 | 517 | 5,52 | ||||
| 2025-08-08 | 13F | Fortis Group Advisors, LLC | 250 | 0,00 | 3 | 0,00 | ||||
| 2025-08-14 | 13F/A | Rockefeller Capital Management L.P. | 34.524 | 1,75 | 479 | 7,64 | ||||
| 2025-04-25 | 13F | Smallwood Wealth Investment Management, LLC | 4.027 | 53 | ||||||
| 2025-08-13 | 13F | MONECO Advisors, LLC | 257.967 | -2,18 | 3.581 | 3,50 | ||||
| 2025-08-12 | 13F | Bokf, Na | 0 | -100,00 | 0 | |||||
| 2025-08-12 | 13F | Richmond Investment Services, LLC | 114.171 | 95,73 | 1.585 | 107,06 | ||||
| 2025-05-08 | 13F | Essential Planning, LLC. | 0 | -100,00 | 0 | |||||
| 2025-05-07 | 13F | Sheaff Brock Investment Advisors, LLC | 13.188 | -0,08 | 173 | -5,98 | ||||
| 2025-09-04 | 13F/A | Advisor Group Holdings, Inc. | 380.959 | 3,05 | 5.288 | 9,03 | ||||
| 2025-08-14 | 13F | Quantedge Capital Pte Ltd | 0 | -100,00 | 0 | |||||
| 2025-07-18 | 13F | TPG Advisors LLC | 138.713 | -0,49 | 1.925 | 5,31 | ||||
| 2025-08-05 | 13F | Palogic Value Management, L.P. | 21.371 | -2,29 | 297 | 3,50 | ||||
| 2025-05-06 | 13F | Atria Investments Llc | 0 | -100,00 | 0 | |||||
| 2025-07-15 | 13F | Shulman DeMeo Asset Management LLC | 96.095 | -0,12 | 1.334 | 5,63 | ||||
| 2025-07-11 | 13F | Pinnacle Bancorp, Inc. | 2.895 | 40 | ||||||
| 2025-08-08 | 13F | Creative Planning | 0 | -100,00 | 0 | |||||
| 2025-08-11 | 13F | WPG Advisers, LLC | 683 | -35,63 | 9 | -30,77 | ||||
| 2025-08-13 | 13F | Green Harvest Asset Management LLC | 15.760 | 0,00 | 219 | 5,83 | ||||
| 2025-08-08 | 13F | Islay Capital Management, Llc | 76.317 | -4,91 | 1.059 | 0,67 | ||||
| 2025-08-14 | 13F | Comerica Bank | 92.866 | 3,05 | 1.289 | 8,97 | ||||
| 2025-08-14 | 13F | CoreCap Advisors, LLC | 20.656 | 55,19 | 287 | 64,37 | ||||
| 2025-06-12 | 13F/A | Deutsche Bank Ag\ | 0 | -100,00 | 0 | |||||
| 2025-08-14 | 13F | Great Valley Advisor Group, Inc. | 0 | -100,00 | 0 | |||||
| 2025-08-14 | 13F | Wetherby Asset Management Inc | 26.302 | 109,85 | 365 | 108,57 | ||||
| 2025-04-16 | 13F | Fortitude Family Office, LLC | 0 | -100,00 | 0 | |||||
| 2025-08-12 | 13F | Jpmorgan Chase & Co | 2.528 | 4,08 | 35 | 12,90 | ||||
| 2025-08-13 | 13F | Guggenheim Capital Llc | 723.627 | 8,17 | 10.044 | 14,44 | ||||
| 2025-05-02 | 13F | Legacy Capital Wealth Partners, LLC | 0 | -100,00 | 0 | -100,00 | ||||
| 2025-08-14 | 13F | Stifel Financial Corp | 302.608 | 7,54 | 4.200 | 13,79 | ||||
| 2025-07-30 | 13F | FNY Investment Advisers, LLC | 5.000 | 0,00 | 0 | |||||
| 2025-08-14 | 13F | Jane Street Group, Llc | 0 | -100,00 | 0 | |||||
| 2025-08-15 | 13F | Morgan Stanley | 11.835.003 | 2,03 | 164.270 | 7,94 | ||||
| 2025-08-04 | 13F | Wolverine Asset Management Llc | 0 | -100,00 | 0 | |||||
| 2025-07-16 | 13F | Instrumental Wealth, Llc | 25.251 | 5,92 | 353 | 15,41 | ||||
| 2025-08-14 | 13F | Colony Group, LLC | 30.143 | 21,39 | 418 | 28,62 | ||||
| 2025-07-30 | 13F | Patten Group, Inc. | 58.215 | -0,73 | 808 | 5,07 | ||||
| 2025-07-31 | 13F | Blake Schutter Theil Wealth Advisors, LLC | 68.604 | 0,24 | 952 | 6,13 | ||||
| 2025-08-07 | 13F | Clarity Wealth Advisors, LLC | 10.091 | -17,10 | 140 | -11,95 | ||||
| 2025-07-11 | 13F | Farther Finance Advisors, LLC | 3.600 | 380,00 | 50 | 444,44 | ||||
| 2025-07-23 | 13F | Ameliora Wealth Management Ltd. | 200 | 0,00 | 3 | 0,00 | ||||
| 2025-08-22 | NP | Cornerstone Strategic Value Fund Inc | 293.198 | -36,79 | 4.070 | -33,13 |