Statistiche di base
| Proprietari istituzionali | 214 total, 212 long only, 0 short only, 2 long/short - change of 21,59% MRQ |
| Allocazione media del portafoglio | 0.2188 % - change of 72,56% MRQ |
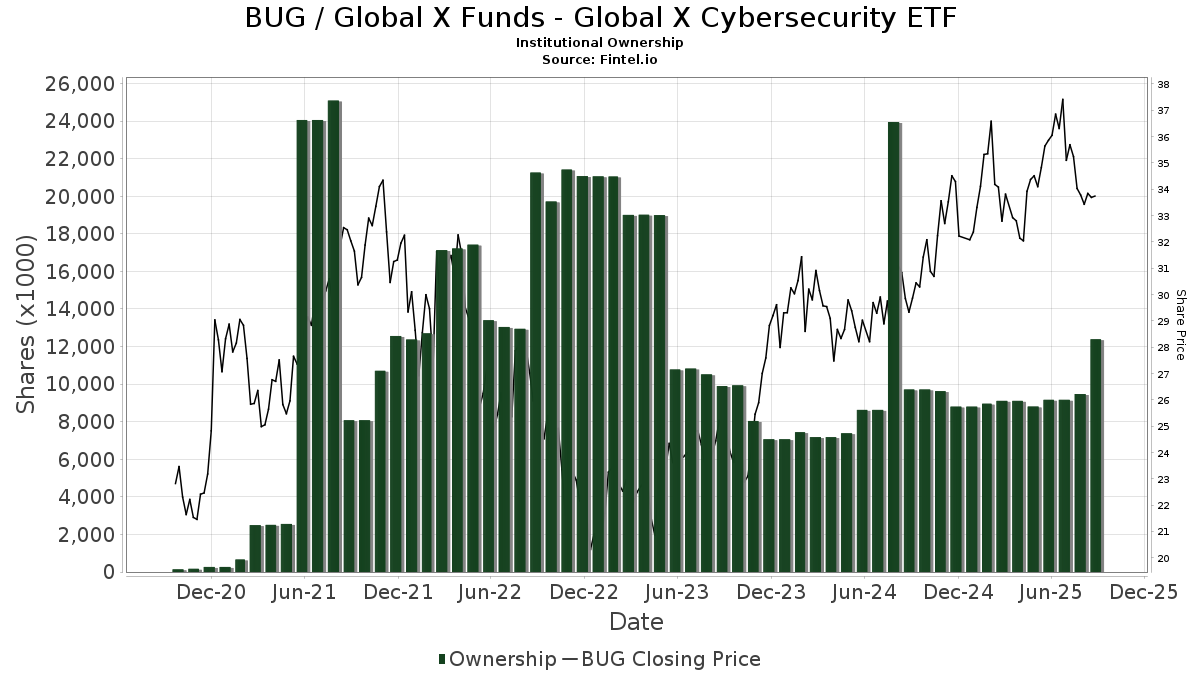
| Azioni istituzionali (Long) | 12.382.994 (ex 13D/G) - change of 3,22MM shares 35,10% MRQ |
| Valore istituzionale (Long) | $ 345.858 USD ($1000) |
Proprietà istituzionale e azionisti
Global X Funds - Global X Cybersecurity ETF (US:BUG) ha 214 proprietari istituzionali e azionisti che hanno presentato i moduli 13D/G o 13F alla Securities Exchange Commission (SEC). Queste istituzioni detengono un totale di 12,382,994 azioni. I maggiori azionisti includono Clal Insurance Enterprises Holdings Ltd, Moss Adams Wealth Advisors LLC, Morgan Stanley, LPL Financial LLC, Edmond De Rothschild Holding S.a., Raymond James Financial Inc, Mirae Asset Global Investments Co., Ltd., Bank Of America Corp /de/, Cetera Investment Advisers, and Royal Bank Of Canada .
(Global X Funds - Global X Cybersecurity ETF (NasdaqGM:BUG) la struttura proprietaria istituzionale mostra le attuali posizioni nella società da parte di istituzioni e fondi, nonché le ultime variazioni nella dimensione della posizione. I principali azionisti possono essere singoli investitori, fondi comuni, hedge fund o istituzioni. L'allegato 13D indica che l'investitore detiene (o ha detenuto) più del 5% della società e intende (o intendeva) perseguire attivamente un cambiamento nella strategia aziendale. L'allegato 13G indica un investimento passivo superiore al 5%.
The share price as of September 5, 2025 is 34,14 / share. Previously, on September 6, 2024, the share price was 28,94 / share. This represents an increase of 17,97% over that period.
Indice del sentiment dei fondi
L'indice del sentiment dei fondi (anche noto come "indice di accumulo di proprietà") individua i titoli più acquistati dai fondi. È il risultato di un sofisticato modello quantitativo multi-fattore che identifica le società con i più alti livelli di accumulo istituzionale. Il modello utilizza una combinazione dell'aumento totale dei proprietari dichiarati, delle variazioni nelle allocazioni di portafoglio di tali proprietari e di altre metriche. Il punteggio varia da 0 a 100: i numeri più alti indicano un livello di accumulo superiore ad altre società, mentre 50 rappresenta la media.
Frequenza di aggiornamento: giornaliera
Consulta Ownership Explorer per visualizzare l'elenco delle aziende con il ranking più alto.
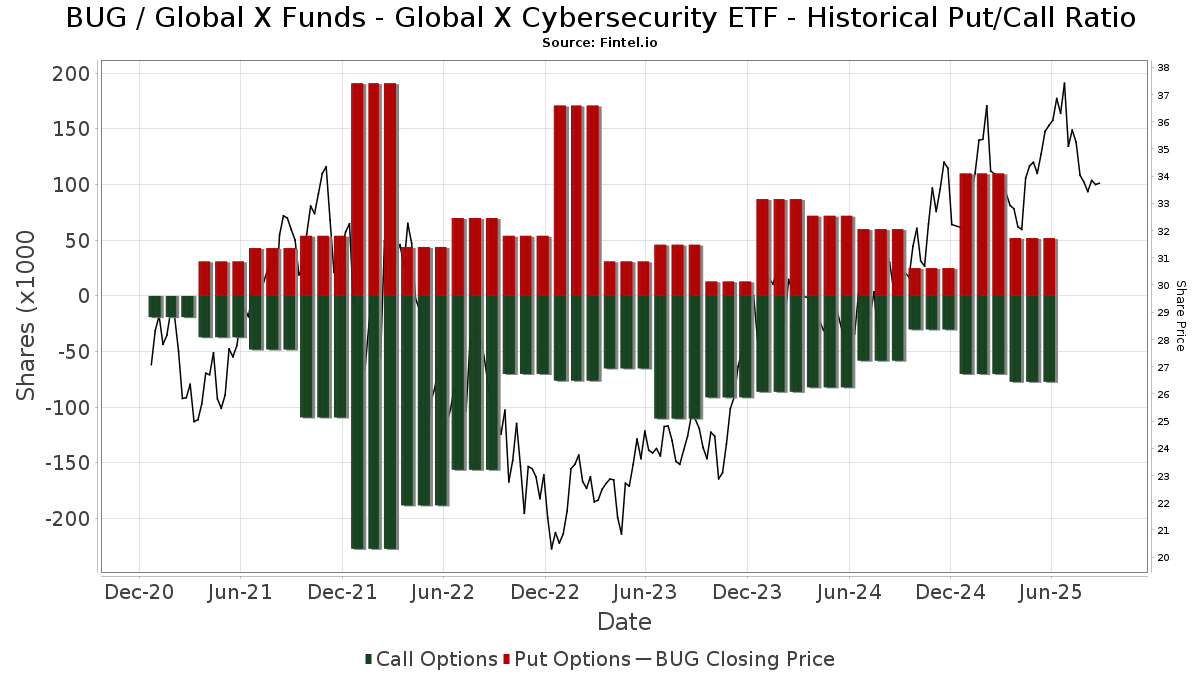
Rapporto put/call istituzionale
Oltre a segnalare le emissioni standard di titoli azionari e di debito, gli istituti con più di 100 milioni di asset in gestione devono anche dichiarare le loro partecipazioni in opzioni put e call. Poiché le opzioni put indicano generalmente un sentiment negativo e le opzioni call un sentiment positivo, possiamo avere un'idea del sentiment istituzionale complessivo attraverso il rapporto tra put e call. Il grafico a destra mostra il rapporto storico put/call per questo strumento.
L'utilizzo del rapporto put/call come indicatore del sentiment degli investitori consente di superare una delle principali lacune dell'utilizzo della proprietà istituzionale totale, ovvero il fatto che una quantità significativa di asset in gestione viene investita passivamente per seguire gli indici. Generalmente, i fondi a gestione passiva non acquistano opzioni, per cui il rapporto put/call riflette più fedelmente il sentiment dei fondi a gestione attiva.
Depositi 13F e NPORT
Le informazioni relative ai depositi 13F sono gratuite. Per accedere alle informazioni relative ai depositi NP è necessario un'abbonamento premium. Le righe verdi indicano le nuove posizioni. Le righe rosse indicano le posizioni chiuse. Fai clic sull'icona del link per visualizzare la cronologia completa delle transazioni.
Esegui l'upgrade
per sbloccare i dati premium ed esportarli in Excel ![]() .
.
| Data di deposito | Fonte | Investitore | Tipo | Prezzo medio (Stima) |
Azioni | Δ Azioni (%) |
Valore dichiarato ($ 1000) |
Δ Valore (%) |
Allocazione del portafoglio (%) |
|
|---|---|---|---|---|---|---|---|---|---|---|
| 2025-08-12 | 13F | Integras Partners LLC | 12.151 | 42,67 | 451 | 63,64 | ||||
| 2025-07-18 | 13F | Truist Financial Corp | 7.424 | 275 | ||||||
| 2025-08-14 | 13F | IHT Wealth Management, LLC | 14.910 | 3,81 | 553 | 19,18 | ||||
| 2025-07-17 | 13F | Archford Capital Strategies, LLC | 6.503 | -41,35 | 241 | -32,68 | ||||
| 2025-08-14 | 13F | Qube Research & Technologies Ltd | 17.024 | 632 | ||||||
| 2025-08-12 | 13F | Stelac Advisory Services LLC | 7.709 | -24,83 | 286 | -13,60 | ||||
| 2025-07-21 | 13F | Sterling Investment Counsel, LLC | 18.922 | -13,99 | 702 | -1,27 | ||||
| 2025-08-05 | 13F | C2P Capital Advisory Group, LLC d.b.a. Prosperity Capital Advisors | 11.967 | 14,06 | 444 | 29,53 | ||||
| 2025-05-09 | 13F | GeoWealth Management, LLC | 0 | -100,00 | 0 | |||||
| 2025-08-12 | 13F | Jpmorgan Chase & Co | 125.424 | 36,76 | 4.653 | 56,93 | ||||
| 2025-08-18 | 13F | Wolverine Trading, Llc | 0 | -100,00 | 0 | -100,00 | ||||
| 2025-07-31 | 13F | Guardian Asset Advisors, LLC | 13.921 | -2,98 | 517 | 11,21 | ||||
| 2025-08-06 | 13F | Atlantic Union Bankshares Corp | 775 | 29 | ||||||
| 2025-05-16 | 13F | Jones Financial Companies Lllp | 0 | -100,00 | 0 | |||||
| 2025-08-01 | 13F | Oarsman Capital, Inc. | 65.579 | 29,97 | 2.433 | 49,11 | ||||
| 2025-07-30 | 13F | Caliber Wealth Management, LLC / KS | 11.750 | 0,00 | 436 | 14,78 | ||||
| 2025-08-11 | 13F | Private Advisor Group, LLC | 23.961 | 8,13 | 889 | 24,02 | ||||
| 2025-07-25 | 13F | Concurrent Investment Advisors, LLC | 9.158 | 340 | ||||||
| 2025-08-14 | 13F | Paragon Private Wealth Management, LLC | 9.589 | 356 | ||||||
| 2025-08-29 | 13F | Total Investment Management Inc | 306 | 11 | ||||||
| 2025-07-16 | 13F | Ayalon Holdings Ltd. | 10.169 | 0,00 | 0 | |||||
| 2025-07-21 | 13F | Ameriflex Group, Inc. | 1.656 | -77,36 | 61 | -74,15 | ||||
| 2025-07-03 | 13F | Garde Capital, Inc. | 26 | 0,00 | 1 | |||||
| 2025-08-14 | 13F | Ameriprise Financial Inc | 62.996 | -8,02 | 2.337 | 5,60 | ||||
| 2025-04-21 | 13F | ERn Financial, LLC | 0 | -100,00 | 0 | |||||
| 2025-08-13 | 13F | Continuum Advisory, LLC | 0 | -100,00 | 0 | |||||
| 2025-08-04 | 13F | Spire Wealth Management | 23.252 | -6,34 | 863 | 7,48 | ||||
| 2025-07-31 | 13F | Cambridge Investment Research Advisors, Inc. | 74.311 | -9,78 | 3 | 0,00 | ||||
| 2025-08-15 | 13F | Equitable Holdings, Inc. | 5.486 | -38,50 | 204 | -29,51 | ||||
| 2025-08-07 | 13F | Resources Investment Advisors, LLC. | 25.863 | 9,80 | 960 | 26,02 | ||||
| 2025-08-05 | 13F | Bank Of Montreal /can/ | 6.587 | -13,47 | 244 | -0,81 | ||||
| 2025-08-05 | 13F | Dunhill Financial, LLC | 60 | 0,00 | 2 | 100,00 | ||||
| 2025-08-12 | 13F | MAI Capital Management | 7.643 | 7,04 | 284 | 23,04 | ||||
| 2025-07-08 | 13F | Parallel Advisors, LLC | 531 | -39,38 | 20 | -32,14 | ||||
| 2025-07-10 | 13F | Wealth Enhancement Advisory Services, Llc | 13.561 | 504 | ||||||
| 2025-07-17 | 13F | Spectrum Strategic Capital Management, LLC | 40.869 | 1.516 | ||||||
| 2025-08-14 | 13F | Ancora Advisors, LLC | 2.121 | 0,00 | 79 | 14,71 | ||||
| 2025-08-08 | 13F | Phoenix Wealth Advisors | 30.903 | -0,97 | 1.147 | 13,58 | ||||
| 2025-08-11 | 13F | HighTower Advisors, LLC | 145.101 | 3,95 | 5.383 | 19,25 | ||||
| 2025-07-16 | 13F | Dakota Wealth Management | 32.938 | -12,21 | 1.222 | 0,74 | ||||
| 2025-07-16 | 13F | Perigon Wealth Management, LLC | 6.142 | 228 | ||||||
| 2025-08-14 | 13F | Citadel Advisors Llc | Put | 19.300 | 9,66 | 716 | 25,83 | |||
| 2025-07-11 | 13F | WealthBridge Investment Counsel Inc. | 99.100 | 1,75 | 4 | 0,00 | ||||
| 2025-08-14 | 13F | Citadel Advisors Llc | Call | 26.600 | 95,59 | 987 | 124,60 | |||
| 2025-07-07 | 13F | OMNI 360 Wealth, Inc. | 9.603 | 356 | ||||||
| 2025-08-14 | 13F | Citadel Advisors Llc | 9.907 | -47,66 | 368 | -40,03 | ||||
| 2025-07-28 | 13F | Harbour Investments, Inc. | 1.254 | -35,53 | 47 | -25,81 | ||||
| 2025-08-13 | 13F | VestGen Advisors, LLC | 10.264 | -8,75 | 353 | -2,75 | ||||
| 2025-08-04 | 13F | Whalen Wealth Management Inc. | 0 | -100,00 | 0 | |||||
| 2025-08-11 | 13F | TD Waterhouse Canada Inc. | 0 | -100,00 | 0 | |||||
| 2025-04-30 | 13F | Alpha Cubed Investments, LLC | 0 | -100,00 | 0 | |||||
| 2025-08-08 | 13F | Cetera Investment Advisers | 258.043 | 18,71 | 9.573 | 36,19 | ||||
| 2025-08-18 | 13F | Wolverine Trading, Llc | Call | 10.600 | 388 | |||||
| 2025-08-12 | 13F | Trexquant Investment LP | 7.454 | -10,12 | 277 | 2,99 | ||||
| 2025-07-18 | 13F | Trust Co Of Vermont | 44 | 0,00 | 2 | 0,00 | ||||
| 2025-08-07 | 13F | Nwam Llc | 93.881 | 3.308 | ||||||
| 2025-07-24 | 13F | Us Bancorp \de\ | 337 | 0,00 | 13 | 20,00 | ||||
| 2025-08-18 | 13F | Geneos Wealth Management Inc. | 185 | 0,00 | 7 | 20,00 | ||||
| 2025-07-24 | 13F | IFP Advisors, Inc | 9.591 | -7,60 | 356 | 5,97 | ||||
| 2025-08-18 | 13F | Wolverine Trading, Llc | Put | 0 | -100,00 | 0 | -100,00 | |||
| 2025-05-09 | 13F | Delta Financial Group, Inc. | 8.783 | -0,55 | 0 | |||||
| 2025-08-08 | 13F | SBI Securities Co., Ltd. | 7.025 | -0,69 | 261 | 14,04 | ||||
| 2025-07-17 | 13F | Albion Financial Group /ut | 80 | 0,00 | 3 | 0,00 | ||||
| 2025-07-30 | 13F | Bleakley Financial Group, LLC | 23.608 | 8,86 | 876 | 24,82 | ||||
| 2025-08-13 | 13F | Northwestern Mutual Wealth Management Co | 114.077 | 3,89 | 4.232 | 19,21 | ||||
| 2025-05-15 | 13F | Tower Research Capital LLC (TRC) | 0 | -100,00 | 0 | |||||
| 2025-08-14 | 13F | CoreCap Advisors, LLC | 624 | 488,68 | 23 | 666,67 | ||||
| 2025-07-14 | 13F | Sowell Financial Services LLC | 83.077 | 423,91 | 3.082 | 501,95 | ||||
| 2025-08-05 | 13F | Fourth Dimension Wealth, LLC | 4 | 0,00 | 0 | |||||
| 2025-07-24 | 13F | Robertson Stephens Wealth Management, LLC | 8.641 | -1,26 | 321 | 13,07 | ||||
| 2025-08-12 | 13F | Fairscale Capital, LLC | 747 | 0,00 | 26 | 4,17 | ||||
| 2025-09-04 | 13F/A | Advisor Group Holdings, Inc. | 94.797 | -36,21 | 3.515 | -26,88 | ||||
| 2025-08-08 | 13F | Capital Investment Advisory Services, LLC | 1.300 | 0,00 | 48 | 14,29 | ||||
| 2025-08-14 | 13F | Raymond James Financial Inc | 398.117 | 1,46 | 14.770 | 16,39 | ||||
| 2025-08-14 | 13F | TCG Advisory Services, LLC | 11.583 | -7,13 | 430 | 6,45 | ||||
| 2025-08-14 | 13F | Snowden Capital Advisors LLC | 8.968 | -35,75 | 333 | -26,39 | ||||
| 2025-04-25 | 13F | Joel Isaacson & Co., LLC | 0 | -100,00 | 0 | |||||
| 2025-07-30 | 13F | Insight Advisors, LLC/ PA | 16.361 | -12,96 | 607 | -0,16 | ||||
| 2025-08-13 | 13F | Cresset Asset Management, LLC | 13.187 | 9,24 | 489 | 25,38 | ||||
| 2025-08-12 | 13F | Laurel Wealth Advisors LLC | 7.420 | 3.610,00 | 0 | -100,00 | ||||
| 2025-08-12 | 13F | FourThought Financial Partners, LLC | 10.772 | 0,00 | 400 | 14,66 | ||||
| 2025-08-14 | 13F | Comerica Bank | 4.484 | 3,08 | 166 | 18,57 | ||||
| 2025-08-14 | 13F | Gerber Kawasaki Wealth & Investment Management | 5.636 | 209 | ||||||
| 2025-08-14 | 13F | MIRAE ASSET GLOBAL ETFS HOLDINGS Ltd. | 102.289 | 118,35 | 3.795 | 150,43 | ||||
| 2025-07-16 | 13F | Advisors Management Group Inc /adv | 28.522 | -0,08 | 1 | |||||
| 2025-08-14 | 13F | CIBC World Markets Inc. | 130.429 | 1,88 | 4.839 | 16,86 | ||||
| 2025-08-12 | 13F | Deutsche Bank Ag\ | 30 | 1 | ||||||
| 2025-07-25 | 13F | Atria Wealth Solutions, Inc. | 0 | -100,00 | 0 | |||||
| 2025-05-15 | 13F | Glenmede Trust Co Na | 1.740 | 0,00 | 56 | 1,82 | ||||
| 2025-08-14 | 13F | Mariner, LLC | 41.575 | 5,67 | 1.542 | 21,23 | ||||
| 2025-05-16 | 13F | Coordinated Financial Services, Inc./CO | 0 | -100,00 | 0 | |||||
| 2025-07-15 | 13F | Fifth Third Bancorp | 9.244 | 0,00 | 343 | 14,77 | ||||
| 2025-08-13 | 13F | Twin Peaks Wealth Advisors, LLC | 1.016 | 34 | ||||||
| 2025-08-13 | 13F | Empire Financial Management Company, LLC | 10.056 | -40,85 | 373 | -32,06 | ||||
| 2025-08-13 | 13F | Mount Yale Investment Advisors, LLC | 801 | 30 | ||||||
| 2025-05-14 | 13F | CIBC Private Wealth Group, LLC | 0 | -100,00 | 0 | -100,00 | ||||
| 2025-08-13 | 13F | Scotia Capital Inc. | 21.688 | 805 | ||||||
| 2025-07-16 | 13F | TigerOak Management, L.L.C. | 96.632 | -0,03 | 3.585 | 14,72 | ||||
| 2025-08-12 | 13F | Proequities, Inc. | 0 | 0 | ||||||
| 2025-05-16 | 13F | McIlrath & Eck, LLC | 0 | -100,00 | 0 | |||||
| 2025-07-14 | 13F | Painted Porch Advisors LLC | 22 | -67,65 | 1 | -100,00 | ||||
| 2025-04-21 | 13F | Trivant Custom Portfolio Group, LLC | 0 | -100,00 | 0 | |||||
| 2025-08-14 | 13F | Mml Investors Services, Llc | 49.945 | -33,90 | 2 | -50,00 | ||||
| 2025-08-13 | 13F | Russell Investments Group, Ltd. | 23 | 1 | ||||||
| 2025-07-29 | 13F | Werba Rubin Papier Wealth Management | 5.396 | 200 | ||||||
| 2025-08-15 | 13F | Morgan Stanley | 1.116.401 | 24,19 | 41.419 | 42,47 | ||||
| 2025-05-20 | 13F/A | Colony Group, LLC | 0 | -100,00 | 0 | |||||
| 2025-08-15 | 13F | Provenance Wealth Advisors, LLC | 18.526 | 134,77 | 687 | 169,41 | ||||
| 2025-07-11 | 13F | Farther Finance Advisors, LLC | 0 | -100,00 | 0 | |||||
| 2025-08-29 | 13F | Centaurus Financial, Inc. | 4.952 | 0 | ||||||
| 2025-08-14 | 13F | Susquehanna International Group, Llp | 0 | -100,00 | 0 | |||||
| 2025-07-25 | 13F | Hazlett, Burt & Watson, Inc. | 17.983 | -1,19 | 1 | |||||
| 2025-05-12 | 13F | Citigroup Inc | 0 | -100,00 | 0 | |||||
| 2025-08-14 | 13F | Group One Trading, L.p. | 4.507 | 347,57 | 167 | 421,88 | ||||
| 2025-08-14 | 13F/A | Rockefeller Capital Management L.P. | 11.359 | 2,39 | 421 | 17,60 | ||||
| 2025-07-30 | 13F | Brookstone Capital Management | 16.177 | 143,26 | 600 | 179,07 | ||||
| 2025-05-09 | 13F | McClarren Financial Advisors, Inc. | 0 | -100,00 | 0 | |||||
| 2025-08-12 | 13F | Calton & Associates, Inc. | 5.905 | 219 | ||||||
| 2025-04-25 | 13F | Verity Asset Management, Inc. | 0 | -100,00 | 0 | -100,00 | ||||
| 2025-07-31 | 13F | Pinnacle Wealth Management Group, Inc. | 74.137 | 2,60 | 2.750 | 17,72 | ||||
| 2025-08-14 | 13F | NCM Capital Management, LLC | 30.826 | 6,80 | 1.140 | 22,19 | ||||
| 2025-07-23 | 13F | Eagle Strategies LLC | 21.955 | -0,17 | 815 | 14,49 | ||||
| 2025-08-14 | 13F | Camden Capital, LLC | 25.360 | 0,00 | 941 | 14,63 | ||||
| 2025-08-11 | 13F/A | Purus Wealth Management, LLC | 6.351 | -0,83 | 236 | 13,53 | ||||
| 2025-08-11 | 13F | Intrepid Financial Planning Group LLC | 13.203 | -3,61 | 490 | 10,63 | ||||
| 2025-08-14 | 13F | Wells Fargo & Company/mn | 1.177 | 503,59 | 44 | 616,67 | ||||
| 2025-07-14 | 13F | Park Avenue Securities Llc | 34.366 | -28,32 | 1 | 0,00 | ||||
| 2025-07-28 | 13F | Triton Wealth Management, PLLC | 18.350 | 653 | ||||||
| 2025-08-05 | 13F | GPS Wealth Strategies Group, LLC | 3.729 | 153,16 | 138 | 193,62 | ||||
| 2025-07-22 | 13F | Team Financial Group, LLC | 2.566 | 95 | ||||||
| 2025-08-05 | 13F | EPG Wealth Management LLC | 0 | -100,00 | 0 | |||||
| 2025-08-08 | 13F | Pnc Financial Services Group, Inc. | 74.500 | -7,82 | 2.764 | 5,74 | ||||
| 2025-07-15 | 13F | Aspire Capital Advisors LLC | 60.238 | 2.235 | ||||||
| 2025-08-04 | 13F | Creative Financial Designs Inc /adv | 4.734 | -24,18 | 176 | -12,94 | ||||
| 2025-08-01 | 13F | GoalVest Advisory LLC | 50 | 0,00 | 2 | 0,00 | ||||
| 2025-08-07 | 13F | Winch Advisory Services, LLC | 576 | 0,00 | 21 | 16,67 | ||||
| 2025-08-12 | 13F | O'shaughnessy Asset Management, Llc | 420 | -13,40 | 16 | 0,00 | ||||
| 2025-08-14 | 13F | Jupiter Wealth Management LLC | 5.000 | 169 | ||||||
| 2025-08-12 | 13F | Franklin Resources Inc | 7.628 | 0,00 | 283 | 14,63 | ||||
| 2025-08-26 | NP | USAF - Atlas America Fund | 12.674 | 470 | ||||||
| 2025-07-21 | 13F | Credential Qtrade Securities Inc. | 0 | -100,00 | 0 | -100,00 | ||||
| 2025-08-19 | 13F | Advisory Services Network, LLC | 17.414 | 20,40 | 603 | 29,12 | ||||
| 2025-08-04 | 13F | Migdal Insurance & Financial Holdings Ltd. | 19.000 | -24,00 | 1 | |||||
| 2025-07-29 | 13F | Stratos Wealth Partners, LTD. | 48.654 | 2,50 | 1.805 | 17,59 | ||||
| 2025-08-12 | 13F | Global Retirement Partners, LLC | 761 | -6,17 | 28 | 7,69 | ||||
| 2025-08-14 | 13F | Goldman Sachs Group Inc | 11.983 | 445 | ||||||
| 2025-08-05 | 13F | Harel Insurance Investments & Financial Services Ltd. | 1 | 0,00 | 0 | |||||
| 2025-07-14 | 13F | Armstrong Advisory Group, Inc | 2.028 | 75 | ||||||
| 2025-08-04 | 13F | L.m. Kohn & Company | 5.532 | 205 | ||||||
| 2025-08-12 | 13F | Edmond De Rothschild Holding S.a. | 403.016 | 3,71 | 14.952 | 18,97 | ||||
| 2025-08-12 | 13F | AlphaCore Capital LLC | 200 | 7 | ||||||
| 2025-07-09 | 13F | WealthCare Investment Partners, LLC | 5.530 | 205 | ||||||
| 2025-08-11 | 13F | Principal Securities, Inc. | 1.198 | 32,08 | 44 | 51,72 | ||||
| 2025-08-06 | 13F | Black Swift Group, LLC | 15.360 | -20,66 | 570 | -9,11 | ||||
| 2025-05-15 | 13F | Vident Advisory, LLC | 0 | -100,00 | 0 | -100,00 | ||||
| 2025-07-24 | 13F | Stonebridge Financial Group, LLC | 0 | -100,00 | 0 | |||||
| 2025-07-22 | 13F | Accel Wealth Management | 21.512 | -4,76 | 798 | 9,32 | ||||
| 2025-08-13 | 13F | Beacon Pointe Advisors, LLC | 11.022 | 0,00 | 409 | 14,61 | ||||
| 2025-08-04 | 13F | Atria Investments Llc | 6.119 | 227 | ||||||
| 2025-08-06 | 13F | Golden State Wealth Management, LLC | 500 | 0,00 | 19 | 12,50 | ||||
| 2025-08-14 | 13F | Cubist Systematic Strategies, LLC | 28.964 | 1.075 | ||||||
| 2025-08-13 | 13F | Cheviot Value Management, LLC | 600 | 100,00 | 19 | 90,00 | ||||
| 2025-08-04 | 13F | Joseph P. Lucia & Associates, LLC | 20.825 | 17,54 | 773 | 34,97 | ||||
| 2025-08-12 | 13F | BlackRock, Inc. | 650 | 24 | ||||||
| 2025-08-13 | 13F | Smith, Moore & Co. | 5.721 | 212 | ||||||
| 2025-08-11 | 13F | Farrow Financial Inc. | 75.779 | -0,65 | 2.811 | 13,99 | ||||
| 2025-07-21 | 13F | Ameritas Advisory Services, LLC | 7.793 | 16,07 | 289 | 34,42 | ||||
| 2025-07-17 | 13F | Grandview Asset Management LLC | 34.887 | 90,31 | 1 | |||||
| 2025-08-14 | 13F | Harwood Advisory Group, LLC | 279 | -1,06 | 10 | 11,11 | ||||
| 2025-07-30 | 13F | Atlantic Edge Private Wealth Management, LLC | 100 | 4 | ||||||
| 2025-08-07 | 13F | Greystone Financial Group, LLC | 12.331 | -0,34 | 457 | 14,25 | ||||
| 2025-08-06 | 13F | Commonwealth Equity Services, Llc | 102.973 | 8,66 | 4 | 0,00 | ||||
| 2025-08-15 | 13F | Captrust Financial Advisors | 5.926 | 220 | ||||||
| 2025-08-05 | 13F | Simplex Trading, Llc | 7.131 | 22,84 | 0 | |||||
| 2025-07-15 | 13F | North Star Investment Management Corp. | 6.320 | 9,53 | 234 | 25,81 | ||||
| 2025-08-14 | 13F | Bank Of America Corp /de/ | 310.249 | -10,96 | 11.510 | 2,16 | ||||
| 2025-05-12 | 13F | Founders Financial Alliance, LLC | 0 | -100,00 | 0 | -100,00 | ||||
| 2025-08-14 | 13F | Glenmede Investment Management, LP | 1.740 | 65 | ||||||
| 2025-08-14 | 13F | Stifel Financial Corp | 51.762 | 24,72 | 1.920 | 43,07 | ||||
| 2025-08-14 | 13F | UBS Group AG | 123.401 | 40,42 | 4.578 | 61,08 | ||||
| 2025-08-26 | 13F | Nautilus Advisors LLC | 10.640 | 395 | ||||||
| 2025-08-01 | 13F | Bessemer Group Inc | 0 | -100,00 | 0 | |||||
| 2025-07-18 | 13F | O'ROURKE & COMPANY, Inc | 17.275 | 0,25 | 641 | 14,90 | ||||
| 2025-07-25 | 13F | Cwm, Llc | 5.391 | 0,00 | 0 | |||||
| 2025-07-29 | 13F | Ballast, Inc. | 20.825 | 773 | ||||||
| 2025-08-13 | 13F | Congress Wealth Management LLC / DE / | 20.007 | 2,82 | 742 | 15,22 | ||||
| 2025-05-02 | 13F | Bogart Wealth, LLC | 0 | 0 | ||||||
| 2025-08-07 | 13F | Allworth Financial LP | 5.385 | 12,12 | 200 | 25,95 | ||||
| 2025-08-07 | 13F | Parkside Financial Bank & Trust | 40 | 0,00 | 1 | 0,00 | ||||
| 2025-08-05 | 13F | Claro Advisors LLC | 6.710 | -1,54 | 249 | 12,73 | ||||
| 2025-08-08 | 13F | Tortoise Investment Management, LLC | 100 | 4 | ||||||
| 2025-08-13 | 13F | Marshall Wace, Llp | 11.403 | -10,23 | 423 | 3,17 | ||||
| 2025-08-12 | 13F | Change Path, LLC | 19.073 | -21,57 | 708 | -10,05 | ||||
| 2025-08-12 | 13F | LPL Financial LLC | 903.796 | 60,29 | 33.531 | 83,89 | ||||
| 2025-08-01 | 13F | Envestnet Asset Management Inc | 114.313 | 29,10 | 4.241 | 48,13 | ||||
| 2025-08-14 | 13F | Sei Investments Co | 6.463 | 240 | ||||||
| 2025-07-31 | 13F | CVA Family Office, LLC | 30 | 0,00 | 1 | |||||
| 2025-08-06 | 13F | AE Wealth Management LLC | 126 | -93,23 | 5 | -93,33 | ||||
| 2025-08-14 | 13F | Potentia Wealth | 0 | -100,00 | 0 | |||||
| 2025-08-15 | 13F | Northeast Financial Consultants Inc | 40.450 | 0,00 | 1.501 | 14,68 | ||||
| 2025-08-14 | 13F | Fmr Llc | 6.414 | -14,31 | 238 | -2,07 | ||||
| 2025-07-02 | 13F | HBW Advisory Services LLC | 16.608 | -2,09 | 616 | 12,41 | ||||
| 2025-07-17 | 13F | Guyasuta Investment Advisors Inc | 6.200 | 230 | ||||||
| 2025-04-21 | 13F | Nelson, Van Denburg & Campbell Wealth Management Group, LLC | 0 | -100,00 | 0 | |||||
| 2025-07-30 | 13F | Phoenix Holdings Ltd. | 12.834 | -56,81 | 476 | -50,42 | ||||
| 2025-07-08 | 13F | Granite Bay Wealth Management, LLC | 41.204 | -27,99 | 2 | 0,00 | ||||
| 2025-07-24 | 13F | Aurora Private Wealth, Inc. | 0 | -100,00 | 0 | |||||
| 2025-08-11 | 13F | Aptus Capital Advisors, LLC | 1.092 | 0,00 | 41 | 14,29 | ||||
| 2025-08-12 | 13F | Archer Investment Corp | 349 | 0,00 | 13 | 9,09 | ||||
| 2025-08-12 | 13F | Clal Insurance Enterprises Holdings Ltd | 2.500.000 | 93 | ||||||
| 2025-08-12 | 13F | Steward Partners Investment Advisory, Llc | 5.024 | 34,15 | 186 | 53,72 | ||||
| 2025-04-17 | 13F | Copia Wealth Management | 0 | -100,00 | 0 | |||||
| 2025-07-30 | 13F | Eqis Capital Management, Inc. | 12.263 | -1,27 | 455 | 13,22 | ||||
| 2025-07-22 | 13F | Merit Financial Group, LLC | 101.304 | -46,36 | 3.758 | -38,47 | ||||
| 2025-07-24 | 13F | Bernard Wealth Management Corp. | 17 | 0,00 | 1 | |||||
| 2025-08-14 | 13F | Turim 21 Investimentos Ltda. | 5.393 | 0,00 | 200 | 14,94 | ||||
| 2025-07-14 | 13F | U.S. Capital Wealth Advisors, LLC | 32.024 | -0,08 | 1.188 | 14,67 | ||||
| 2025-08-11 | 13F | NewEdge Wealth, LLC | 21.283 | -8,47 | 698 | -7,19 | ||||
| 2025-07-16 | 13F | Crown Wealth Group, LLC | 173.234 | 6.427 | ||||||
| 2025-07-16 | 13F | Owen LaRue, LLC | 8.550 | 0,00 | 317 | 14,86 | ||||
| 2025-07-08 | 13F | Nbc Securities, Inc. | 3.824 | 25,67 | 0 | |||||
| 2025-07-16 | 13F | BOS Asset Management, LLC | 6.522 | 242 | ||||||
| 2025-08-12 | 13F | Howe & Rusling Inc | 600 | 22 | ||||||
| 2025-08-14 | 13F | Ssi Investment Management Llc | 9.248 | 44,05 | 343 | 65,70 | ||||
| 2025-07-08 | 13F | Apella Capital, LLC | 0 | -100,00 | 0 | |||||
| 2025-08-08 | 13F | Creative Planning | 6.233 | 231 | ||||||
| 2025-07-23 | NP | PSWD - Xtrackers Cybersecurity Select Equity ETF | 160 | -88,61 | 6 | -89,36 | ||||
| 2025-08-13 | 13F | EverSource Wealth Advisors, LLC | 36 | 1 | ||||||
| 2025-07-17 | 13F | Moss Adams Wealth Advisors LLC | 1.421.225 | 1,57 | 52.727 | 16,52 | ||||
| 2025-08-14 | 13F | Susquehanna International Group, Llp | Call | 40.000 | -30,07 | 1.484 | -19,74 | |||
| 2025-07-28 | 13F | Essex LLC | 24.789 | -10,96 | 920 | 2,11 | ||||
| 2025-08-14 | 13F | Susquehanna International Group, Llp | Put | 33.400 | -61,25 | 1.239 | -55,54 | |||
| 2025-07-21 | 13F | Mirae Asset Global Investments Co., Ltd. | 363.900 | -7,94 | 13.501 | 4,00 | ||||
| 2025-08-01 | 13F | Biltmore Family Office, LLC | 162.436 | 2,51 | 6.026 | 17,60 | ||||
| 2025-08-12 | 13F | J.w. Cole Advisors, Inc. | 7.578 | 281 | ||||||
| 2025-08-08 | 13F | Avantax Advisory Services, Inc. | 18.997 | 18,01 | 705 | 35,38 | ||||
| 2025-08-14 | 13F | GWM Advisors LLC | 11.920 | 434,77 | 442 | 513,89 | ||||
| 2025-08-13 | 13F | Level Four Advisory Services, Llc | 133.561 | 1,51 | 4.955 | 16,45 | ||||
| 2025-08-14 | 13F | Royal Bank Of Canada | 212.091 | 0,12 | 7.868 | 14,84 | ||||
| 2025-04-18 | 13F | Financial Freedom, LLC | 0 | -100,00 | 0 | |||||
| 2025-05-12 | 13F | Sandy Spring Bank | 775 | 0,00 | 25 | 4,17 | ||||
| 2025-07-23 | 13F | Bellevue Asset Management, Llc | 398 | 0,00 | 15 | 16,67 | ||||
| 2025-08-11 | 13F | Y.D. More Investments Ltd | 1.400 | 0,00 | 52 | 13,33 | ||||
| 2025-07-17 | 13F | Robbins Farley Llc | 10 | 400,00 | 0 | |||||
| 2025-05-12 | 13F | Independent Advisor Alliance | 0 | -100,00 | 0 | |||||
| 2025-08-15 | 13F | Kestra Advisory Services, LLC | 201.113 | -14,06 | 7.461 | -1,40 | ||||
| 2025-08-14 | 13F | Federation des caisses Desjardins du Quebec | 29.077 | 15,91 | 1.079 | 32,92 | ||||
| 2025-07-14 | 13F | Opal Wealth Advisors, LLC | 2.431 | -5,88 | 90 | 8,43 | ||||
| 2025-07-16 | 13F | West Branch Capital LLC | 0 | -100,00 | 0 | |||||
| 2025-08-14 | 13F | Synovus Financial Corp | 9.394 | -0,49 | 349 | 14,10 | ||||
| 2025-07-29 | 13F | Private Trust Co Na | 537 | 0,00 | 20 | 11,76 | ||||
| 2025-08-11 | 13F | Blue Bell Private Wealth Management, Llc | 6 | 0,00 | 0 | |||||
| 2025-08-14 | 13F | AllSquare Wealth Management LLC | 1.702 | 161,04 | 63 | 200,00 | ||||
| 2025-07-30 | NP | GXDW - Global X Thematic Growth ETF This fund is a listed as child fund of Mirae Asset Global Investments Co., Ltd. and if that institution has disclosed ownership in this security, then these positions will not be double counted when calculating total shares and total value | 53.774 | 1.877 | ||||||
| 2025-08-01 | 13F | Bank of Jackson Hole Trust | 650 | 0,00 | 24 | 9,09 |