Statistiche di base
| Proprietari istituzionali | 170 total, 170 long only, 0 short only, 0 long/short - change of 2,41% MRQ |
| Allocazione media del portafoglio | 0.5269 % - change of -5,86% MRQ |
| Azioni istituzionali (Long) | 42.232.745 (ex 13D/G) - change of 0,18MM shares 0,43% MRQ |
| Valore istituzionale (Long) | $ 1.047.218 USD ($1000) |
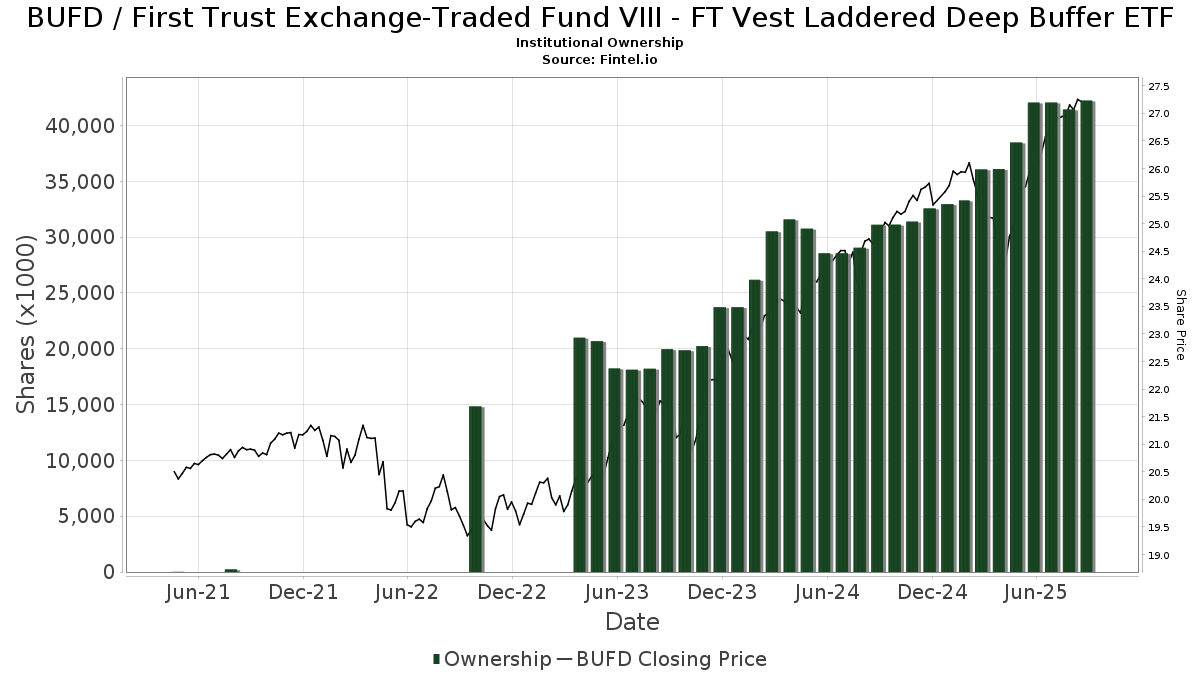
Proprietà istituzionale e azionisti
First Trust Exchange-Traded Fund VIII - FT Vest Laddered Deep Buffer ETF (US:BUFD) ha 170 proprietari istituzionali e azionisti che hanno presentato i moduli 13D/G o 13F alla Securities Exchange Commission (SEC). Queste istituzioni detengono un totale di 42,232,745 azioni. I maggiori azionisti includono LPL Financial LLC, Gw Henssler & Associates Ltd, Envestnet Asset Management Inc, Legacy Financial Group LLC, Centennial Wealth Advisory LLC, Advisor Group Holdings, Inc., Creekmur Asset Management LLC, Truist Financial Corp, Cetera Investment Advisers, and Commonwealth Equity Services, Llc .
(First Trust Exchange-Traded Fund VIII - FT Vest Laddered Deep Buffer ETF (BATS:BUFD) la struttura proprietaria istituzionale mostra le attuali posizioni nella società da parte di istituzioni e fondi, nonché le ultime variazioni nella dimensione della posizione. I principali azionisti possono essere singoli investitori, fondi comuni, hedge fund o istituzioni. L'allegato 13D indica che l'investitore detiene (o ha detenuto) più del 5% della società e intende (o intendeva) perseguire attivamente un cambiamento nella strategia aziendale. L'allegato 13G indica un investimento passivo superiore al 5%.
The share price as of September 5, 2025 is 27,30 / share. Previously, on September 6, 2024, the share price was 24,43 / share. This represents an increase of 11,75% over that period.
Indice del sentiment dei fondi
L'indice del sentiment dei fondi (anche noto come "indice di accumulo di proprietà") individua i titoli più acquistati dai fondi. È il risultato di un sofisticato modello quantitativo multi-fattore che identifica le società con i più alti livelli di accumulo istituzionale. Il modello utilizza una combinazione dell'aumento totale dei proprietari dichiarati, delle variazioni nelle allocazioni di portafoglio di tali proprietari e di altre metriche. Il punteggio varia da 0 a 100: i numeri più alti indicano un livello di accumulo superiore ad altre società, mentre 50 rappresenta la media.
Frequenza di aggiornamento: giornaliera
Consulta Ownership Explorer per visualizzare l'elenco delle aziende con il ranking più alto.
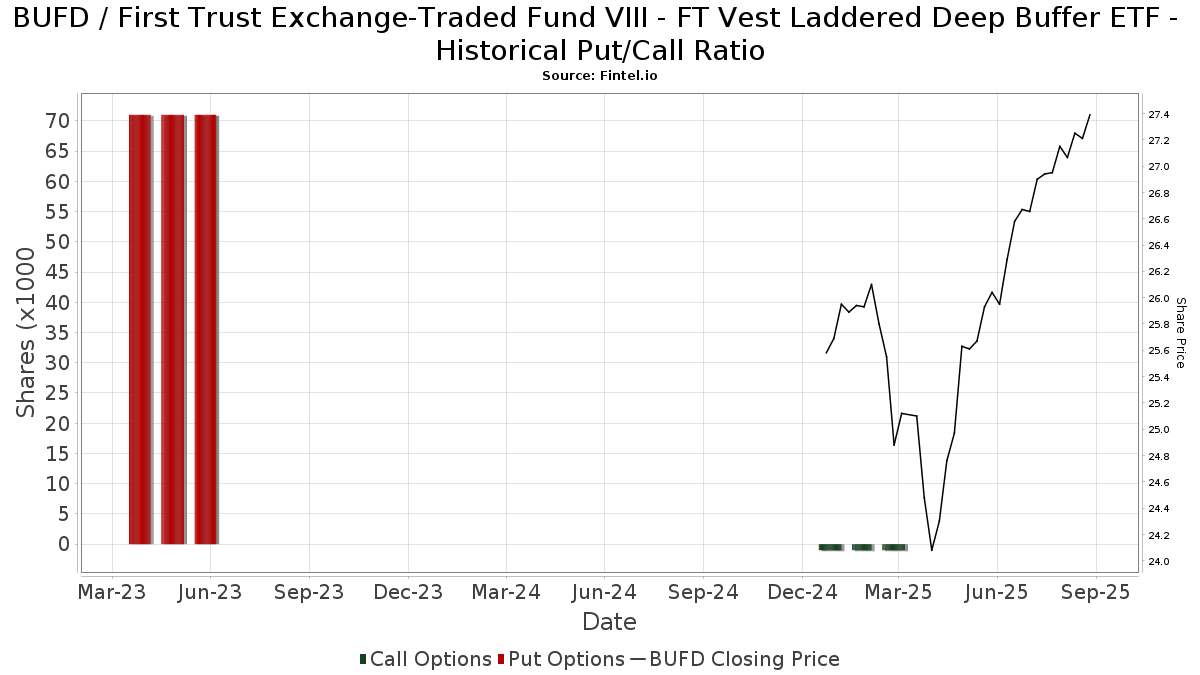
Rapporto put/call istituzionale
Oltre a segnalare le emissioni standard di titoli azionari e di debito, gli istituti con più di 100 milioni di asset in gestione devono anche dichiarare le loro partecipazioni in opzioni put e call. Poiché le opzioni put indicano generalmente un sentiment negativo e le opzioni call un sentiment positivo, possiamo avere un'idea del sentiment istituzionale complessivo attraverso il rapporto tra put e call. Il grafico a destra mostra il rapporto storico put/call per questo strumento.
L'utilizzo del rapporto put/call come indicatore del sentiment degli investitori consente di superare una delle principali lacune dell'utilizzo della proprietà istituzionale totale, ovvero il fatto che una quantità significativa di asset in gestione viene investita passivamente per seguire gli indici. Generalmente, i fondi a gestione passiva non acquistano opzioni, per cui il rapporto put/call riflette più fedelmente il sentiment dei fondi a gestione attiva.
Depositi 13F e NPORT
Le informazioni relative ai depositi 13F sono gratuite. Per accedere alle informazioni relative ai depositi NP è necessario un'abbonamento premium. Le righe verdi indicano le nuove posizioni. Le righe rosse indicano le posizioni chiuse. Fai clic sull'icona del link per visualizzare la cronologia completa delle transazioni.
Esegui l'upgrade
per sbloccare i dati premium ed esportarli in Excel ![]() .
.
| Data di deposito | Fonte | Investitore | Tipo | Prezzo medio (Stima) |
Azioni | Δ Azioni (%) |
Valore dichiarato ($ 1000) |
Δ Valore (%) |
Allocazione del portafoglio (%) |
|
|---|---|---|---|---|---|---|---|---|---|---|
| 2025-08-05 | 13F | EPG Wealth Management LLC | Call | 0 | -100,00 | 0 | ||||
| 2025-08-05 | 13F | American Institute for Advanced Investment Management, LLP | 30.572 | -1,98 | 812 | 4,24 | ||||
| 2025-08-13 | 13F | Northwestern Mutual Wealth Management Co | 2.972 | 79 | ||||||
| 2025-07-14 | 13F | Iams Wealth Management, Llc | 46.230 | -61,62 | 1.228 | -59,17 | ||||
| 2025-08-05 | 13F | EPG Wealth Management LLC | 0 | -100,00 | 0 | |||||
| 2025-08-12 | 13F | Cornerstone Wealth Management, LLC | 7.819 | 208 | ||||||
| 2025-07-23 | 13F | GGM Financials LLC | 16.198 | 430 | ||||||
| 2025-08-05 | 13F | C2P Capital Advisory Group, LLC d.b.a. Prosperity Capital Advisors | 25.131 | 667 | ||||||
| 2025-08-08 | 13F | Kingsview Wealth Management, LLC | 81.531 | -0,67 | 2.165 | 5,76 | ||||
| 2025-08-12 | 13F | Jacobi Capital Management LLC | 200.363 | 7,74 | 5.322 | 14,70 | ||||
| 2025-07-11 | 13F | Farther Finance Advisors, LLC | 5.251 | 232,76 | 139 | 256,41 | ||||
| 2025-07-28 | 13F | RFG Advisory, LLC | 17.969 | 48,14 | 477 | 57,95 | ||||
| 2025-07-22 | 13F | Partners Wealth Management, Llc | 18.296 | 0,00 | 457 | 0,00 | ||||
| 2025-08-18 | 13F | N.E.W. Advisory Services LLC | 2.105 | -65,41 | 56 | -63,58 | ||||
| 2025-04-29 | 13F | Resources Investment Advisors, LLC. | 0 | -100,00 | 0 | |||||
| 2025-07-07 | 13F | Schulz Wealth, LTD. | 8.628 | -36,87 | 229 | -32,84 | ||||
| 2025-07-10 | 13F | Wealth Enhancement Advisory Services, Llc | 18.853 | -45,60 | 503 | -41,78 | ||||
| 2025-04-21 | 13F | Nelson, Van Denburg & Campbell Wealth Management Group, LLC | 0 | -100,00 | 0 | |||||
| 2025-08-13 | 13F | StoneX Group Inc. | 53.431 | 236,64 | 1.419 | 258,33 | ||||
| 2025-04-15 | 13F | Integrated Advisors Network LLC | 0 | -100,00 | 0 | |||||
| 2025-08-14 | 13F | Wells Fargo & Company/mn | 58.263 | -12,79 | 1.547 | -7,14 | ||||
| 2025-08-11 | 13F | Summit Wealth Partners, LLC | 8.243 | 0,00 | 219 | 6,34 | ||||
| 2025-07-30 | 13F | Onyx Bridge Wealth Group LLC | 15.100 | 0,00 | 401 | 6,65 | ||||
| 2025-07-16 | 13F | Maridea Wealth Management LLC | 44.119 | 9,73 | 1.172 | 16,75 | ||||
| 2025-08-06 | 13F | AE Wealth Management LLC | 41.523 | -3,81 | 1.103 | 2,32 | ||||
| 2025-07-30 | 13F | Paul Damon & Associates, Inc. | 53.960 | 3,92 | 1.433 | 10,66 | ||||
| 2025-08-14 | 13F | Mariner, LLC | 324.697 | -15,97 | 8.624 | -10,55 | ||||
| 2025-05-15 | 13F/A | Orion Portfolio Solutions, LLC | 28.450 | -19,51 | 710 | -21,40 | ||||
| 2025-08-14 | 13F | Integrated Wealth Concepts LLC | 134.982 | 15,26 | 3.585 | 22,73 | ||||
| 2025-08-13 | 13F | Capital Analysts, Inc. | 33.980 | 1,14 | 1 | |||||
| 2025-08-06 | 13F | Legacy Investment Solutions, LLC | 106.530 | 57,91 | 2.829 | 62,12 | ||||
| 2025-07-09 | 13F | Tounjian Advisory Partners, Llc | 34.163 | 0,00 | 852 | 0,00 | ||||
| 2025-08-14 | 13F | Harvest Investment Services, LLC | 21.454 | -5,31 | 570 | 0,71 | ||||
| 2025-08-12 | 13F | Indie Asset Partners, LLC | 0 | -100,00 | 0 | |||||
| 2025-08-04 | 13F | L.m. Kohn & Company | 28.226 | -4,34 | 750 | 1,77 | ||||
| 2025-07-25 | 13F | Envestnet Portfolio Solutions, Inc. | 8.196 | -93,52 | 218 | -93,13 | ||||
| 2025-05-21 | 13F/A | Geneos Wealth Management Inc. | 0 | -100,00 | 0 | -100,00 | ||||
| 2025-08-12 | 13F | Jpmorgan Chase & Co | 4 | -99,98 | 0 | -100,00 | ||||
| 2025-07-22 | 13F | Simplicity Wealth,LLC | 202.770 | 73,22 | 5.386 | 84,42 | ||||
| 2025-08-12 | 13F | Gladstone Institutional Advisory LLC | 23.507 | -68,43 | 624 | -66,40 | ||||
| 2025-08-13 | 13F | Townsquare Capital Llc | 0 | -100,00 | 0 | |||||
| 2025-07-31 | 13F | Moloney Securities Asset Management, LLC | 17.985 | 3,42 | 478 | 10,16 | ||||
| 2025-08-11 | 13F | Brass Tax Wealth Management, Inc | 425.004 | 5,19 | 11.288 | 11,98 | ||||
| 2025-08-11 | 13F | Principal Securities, Inc. | 53.075 | 20,77 | 1.410 | 25,69 | ||||
| 2025-07-16 | 13F | Essex Financial Services, Inc. | 8.902 | 0,00 | 236 | 6,31 | ||||
| 2025-08-14 | 13F | Schwallier Wealth Management LLC | 0 | -100,00 | 0 | -100,00 | ||||
| 2025-07-30 | 13F | LifeWealth Investments, LLC | 36.581 | 2,24 | 972 | 8,86 | ||||
| 2025-08-19 | 13F | Advisory Services Network, LLC | 174.066 | 9,40 | 4.679 | 17,86 | ||||
| 2025-05-12 | 13F | Independent Advisor Alliance | 0 | -100,00 | 0 | |||||
| 2025-08-06 | 13F | Commonwealth Equity Services, Llc | 767.257 | -24,33 | 20 | -20,00 | ||||
| 2025-08-11 | 13F | Aptus Capital Advisors, LLC | 1.150 | 0,00 | 31 | 7,14 | ||||
| 2025-08-13 | 13F | SCS Capital Management LLC | 16.152 | 1,23 | 429 | 7,54 | ||||
| 2025-09-04 | 13F/A | Advisor Group Holdings, Inc. | 1.756.473 | 6,87 | 46.652 | 13,77 | ||||
| 2025-08-08 | 13F | Avantax Advisory Services, Inc. | 83.669 | 1,02 | 2.222 | 7,55 | ||||
| 2025-08-13 | 13F | Mayfair Advisory Group, LLC | 25.583 | 0,00 | 692 | 8,31 | ||||
| 2025-08-08 | 13F | Foundations Investment Advisors, LLC | 50.158 | -11,26 | 1.332 | -5,53 | ||||
| 2025-08-14 | 13F | Jane Street Group, Llc | 31.794 | -59,93 | 844 | -57,35 | ||||
| 2025-07-18 | 13F | Cooper Financial Group | 19.481 | -8,95 | 517 | -3,00 | ||||
| 2025-08-04 | 13F | Creekmur Asset Management LLC | 1.490.215 | 3,48 | 39.580 | 10,16 | ||||
| 2025-05-08 | 13F | Us Bancorp \de\ | 0 | -100,00 | 0 | |||||
| 2025-07-23 | 13F | Defined Financial Planning LLC | 15.587 | 415 | ||||||
| 2025-07-25 | 13F | We Are One Seven, LLC | 33.913 | 901 | ||||||
| 2025-08-04 | 13F | IFG Advisory, LLC | 88.748 | -16,37 | 2.357 | -10,96 | ||||
| 2025-07-30 | 13F | Strategic Blueprint, LLC | 26.213 | -19,36 | 696 | -14,18 | ||||
| 2025-07-15 | 13F | Santori & Peters, Inc. | 391.090 | 0,04 | 10.387 | 6,50 | ||||
| 2025-07-16 | 13F | Cambridge Advisors Inc. | 17.467 | -5,92 | 464 | 0,00 | ||||
| 2025-07-24 | 13F | Fischer Investment Strategies, Llc | 569.210 | 17,00 | 15.118 | 24,56 | ||||
| 2025-08-13 | 13F | Maia Wealth LLC | 82.743 | -33,99 | 2.198 | -28,30 | ||||
| 2025-08-14 | 13F | Benjamin Edwards Inc | 15.058 | -24,04 | 400 | -19,23 | ||||
| 2025-08-12 | 13F | Richmond Investment Services, LLC | 117.842 | 107,11 | 3.130 | 120,51 | ||||
| 2025-08-06 | 13F | Wedbush Securities Inc | 166.343 | -39,70 | 4 | -33,33 | ||||
| 2025-07-08 | 13F | Nbc Securities, Inc. | 27.898 | -1,98 | 1 | |||||
| 2025-08-04 | 13F | Atria Investments Llc | 16.280 | 432 | ||||||
| 2025-07-07 | 13F | Nova Wealth Management, Inc. | 469 | -52,24 | 12 | -50,00 | ||||
| 2025-08-14 | 13F | Old Mission Capital Llc | 22.791 | 605 | ||||||
| 2025-07-07 | 13F | Capital Asset Advisory Services LLC | 738.615 | 4,35 | 19.588 | 10,26 | ||||
| 2025-08-08 | 13F | Cetera Investment Advisers | 1.019.430 | 4,40 | 27.076 | 11,14 | ||||
| 2025-08-08 | 13F | SBI Securities Co., Ltd. | 2 | -33,33 | 0 | |||||
| 2025-08-06 | 13F | Golden State Wealth Management, LLC | 10.280 | 0,00 | 273 | 6,64 | ||||
| 2025-07-14 | 13F | Chris Bulman Inc | 9.704 | -13,81 | 258 | -8,21 | ||||
| 2025-08-06 | 13F | Wsfs Capital Management, Llc | 8.146 | 0,00 | 216 | 6,40 | ||||
| 2025-07-14 | 13F | Sowell Financial Services LLC | 21.879 | -14,29 | 581 | -8,65 | ||||
| 2025-08-06 | 13F | Walkner Condon Financial Advisors LLC | 53.124 | -25,73 | 1.411 | -20,96 | ||||
| 2025-08-19 | 13F | National Asset Management, Inc. | 0 | -100,00 | 0 | |||||
| 2025-08-11 | 13F | Perennial Investment Advisors, LLC | 112.101 | 2.977 | ||||||
| 2025-07-22 | 13F | Merit Financial Group, LLC | 12.854 | 0,00 | 341 | 6,56 | ||||
| 2025-08-15 | 13F | Morgan Stanley | 23.246 | 2.052,41 | 617 | 2.273,08 | ||||
| 2025-05-15 | 13F | Concorde Asset Management, LLC | 17.354 | 13,75 | 425 | 9,00 | ||||
| 2025-07-02 | 13F | HBW Advisory Services LLC | 10.766 | 0,00 | 286 | 6,34 | ||||
| 2025-03-21 | 13F | Prostatis Group LLC | 0 | -100,00 | 0 | |||||
| 2025-07-11 | 13F | Quad-Cities Investment Group, LLC | 14.538 | 0,00 | 386 | 6,63 | ||||
| 2025-07-21 | 13F | Ameritas Advisory Services, LLC | 12.656 | -64,82 | 336 | -62,63 | ||||
| 2025-08-20 | 13F/A | Coppell Advisory Solutions LLC | 659.729 | 32,17 | 17.437 | 40,98 | ||||
| 2025-07-21 | 13F | Triad Wealth Partners, LLC | 24.522 | 149,97 | 651 | 166,80 | ||||
| 2025-08-15 | 13F | Equitable Holdings, Inc. | 80.799 | 7,28 | 2.146 | 14,21 | ||||
| 2025-08-07 | 13F | Kestra Private Wealth Services, Llc | 721.868 | 535,98 | 19.173 | 577,22 | ||||
| 2025-07-21 | 13F | Andina Capital Management, LLC | 0 | -100,00 | 0 | |||||
| 2025-05-02 | 13F | Apollon Wealth Management, LLC | 0 | -100,00 | 0 | -100,00 | ||||
| 2025-08-05 | 13F | Claro Advisors LLC | 41.916 | 16,54 | 1.113 | 24,08 | ||||
| 2025-07-28 | 13F | Mutual Advisors, LLC | 14.995 | -13,55 | 404 | -5,61 | ||||
| 2025-08-14 | 13F | Great Valley Advisor Group, Inc. | 11.596 | -1,29 | 308 | 5,14 | ||||
| 2025-07-17 | 13F | Albion Financial Group /ut | 358 | 0,00 | 10 | 12,50 | ||||
| 2025-07-30 | 13F | IMG Wealth Management, Inc. | 275.408 | 4,12 | 7.315 | 10,83 | ||||
| 2025-08-13 | 13F | Twin Peaks Wealth Advisors, LLC | 13.188 | 45,71 | 358 | 62,27 | ||||
| 2025-08-08 | 13F | Larson Financial Group LLC | 1.220 | 0,00 | 32 | 6,67 | ||||
| 2025-07-25 | 13F | Cwm, Llc | 275.091 | 0,80 | 7 | 16,67 | ||||
| 2025-08-08 | 13F | Symphony Financial Services, Inc. | 17.475 | 12,92 | 464 | 20,21 | ||||
| 2025-08-14 | 13F | GWM Advisors LLC | 439.981 | -7,90 | 11.686 | -1,96 | ||||
| 2025-07-10 | 13F | Focus Financial Network, Inc. | 15.024 | 0,00 | 399 | 6,68 | ||||
| 2025-07-24 | 13F | Cascade Investment Group, Inc. | 9.680 | -1,56 | 257 | 4,90 | ||||
| 2025-08-05 | 13F | Strategic Financial Concepts, LLC | 18.566 | -3,61 | 493 | 2,71 | ||||
| 2025-07-30 | 13F | TFB Advisors LLC | 18.547 | -23,65 | 493 | -18,81 | ||||
| 2025-05-07 | 13F | Prosperity Consulting Group, LLC | 0 | -100,00 | 0 | |||||
| 2025-08-04 | 13F | Assetmark, Inc | 4.146 | 14,91 | 110 | 22,22 | ||||
| 2025-07-18 | 13F | Truist Financial Corp | 1.128.503 | 1,59 | 29.973 | 8,15 | ||||
| 2025-07-24 | 13F | IFP Advisors, Inc | 27.671 | 8,92 | 735 | 15,96 | ||||
| 2025-07-25 | 13F | Lion Street Advisors, LLC | 25.086 | -4,39 | 666 | 1,83 | ||||
| 2025-07-29 | 13F | Private Trust Co Na | 10.361 | 6,51 | 275 | 13,64 | ||||
| 2025-08-05 | 13F | Milestone Asset Management, Llc | 418.721 | 34,43 | 11.121 | 43,11 | ||||
| 2025-07-31 | 13F | Cambridge Investment Research Advisors, Inc. | 649.420 | -34,62 | 17 | -29,17 | ||||
| 2025-07-28 | 13F | Axxcess Wealth Management, Llc | 702.397 | 4,40 | 18.656 | 11,13 | ||||
| 2025-08-11 | 13F | Regal Investment Advisors LLC | 10.549 | 0,00 | 280 | 6,46 | ||||
| 2025-07-25 | 13F | Atria Wealth Solutions, Inc. | 33.946 | -80,97 | 902 | -79,75 | ||||
| 2025-08-01 | 13F | Wealth Watch Advisors, INC | 103.704 | 42,44 | 2.754 | 51,65 | ||||
| 2025-08-12 | 13F | Proequities, Inc. | 0 | 0 | ||||||
| 2025-05-02 | 13F | BlackRock, Inc. | 0 | -100,00 | 0 | |||||
| 2025-08-11 | 13F | Blue Bell Private Wealth Management, Llc | 235 | 0,00 | 6 | 20,00 | ||||
| 2025-07-18 | 13F | Trilogy Capital Inc. | 12.470 | 0,00 | 331 | 6,43 | ||||
| 2025-08-14 | 13F | Core Wealth Advisors, Inc. | 8.105 | 215 | ||||||
| 2025-07-16 | 13F | EdgeRock Capital LLC | 27.524 | 0,00 | 731 | 6,56 | ||||
| 2025-08-06 | 13F | Prospera Financial Services Inc | 7.926 | 211 | ||||||
| 2025-08-12 | 13F | Change Path, LLC | 277.959 | -0,72 | 7.383 | 5,68 | ||||
| 2025-08-14 | 13F | Mml Investors Services, Llc | 756.648 | -5,63 | 20 | 0,00 | ||||
| 2025-08-15 | 13F | Kestra Advisory Services, LLC | 428.889 | -0,27 | 11.391 | 6,16 | ||||
| 2025-08-05 | 13F | Integrity Financial Corp /WA | 219.828 | -12,86 | 5.839 | -7,24 | ||||
| 2025-07-24 | 13F | SLT Holdings LLC | 44.764 | -7,75 | 1.189 | -1,82 | ||||
| 2025-07-28 | 13F | Virtus Wealth Solutions LLC | 16.198 | 1,36 | 430 | 8,04 | ||||
| 2025-07-30 | 13F | Brookstone Capital Management | 750.871 | -0,41 | 19.943 | 6,02 | ||||
| 2025-08-12 | 13F | LPL Financial LLC | 8.066.365 | 2,80 | 214.243 | 9,43 | ||||
| 2025-08-14 | 13F | Ausdal Financial Partners, Inc. | 8.991 | -0,59 | 239 | 5,78 | ||||
| 2025-08-14 | 13F | CoreCap Advisors, LLC | 41.733 | -9,11 | 1.108 | -3,23 | ||||
| 2025-08-14 | 13F | Financial Strategies Group, Inc. | 41.511 | 4,89 | 1.107 | 14,83 | ||||
| 2025-08-12 | 13F | Tradition Wealth Management, LLC | 66.961 | -2,76 | 1.778 | 3,49 | ||||
| 2025-08-14 | 13F | Planwiser Financial, Llc | 16.779 | 15,46 | 452 | 24,86 | ||||
| 2025-07-17 | 13F | Janney Montgomery Scott LLC | 20.727 | 1,45 | 1 | |||||
| 2025-07-25 | 13F | Gw Henssler & Associates Ltd | 3.959.449 | -6,91 | 105.163 | -0,90 | ||||
| 2025-08-12 | 13F | Steward Partners Investment Advisory, Llc | 36.385 | 25,46 | 966 | 33,61 | ||||
| 2025-08-05 | 13F | GPS Wealth Strategies Group, LLC | 66.202 | 15,52 | 1.758 | 23,02 | ||||
| 2025-08-05 | 13F | Bank Of Montreal /can/ | 150 | 0,00 | 4 | 0,00 | ||||
| 2025-08-01 | 13F | FSA Advisors, Inc. | 29.829 | -12,08 | 792 | -5,94 | ||||
| 2025-07-25 | 13F | Apollon Financial, LLC | 107.588 | -1,29 | 2.858 | 5,08 | ||||
| 2025-08-08 | 13F | Davies Financial Advisors, Inc. | 32.645 | -0,73 | 867 | 5,73 | ||||
| 2025-08-06 | 13F | Legacy Wealth Managment, LLC/ID | 106.530 | 39,09 | 2.829 | 48,12 | ||||
| 2025-08-14 | 13F | Raymond James Financial Inc | 538.025 | 106,35 | 14.290 | 119,66 | ||||
| 2025-07-28 | 13F | Harbour Investments, Inc. | 526.162 | 6,93 | 13.975 | 13,83 | ||||
| 2025-07-21 | 13F | DHJJ Financial Advisors, Ltd. | 3.645 | -30,83 | 97 | -26,72 | ||||
| 2025-08-12 | 13F | Global Retirement Partners, LLC | 21.499 | 0,00 | 571 | 4,20 | ||||
| 2025-04-22 | 13F | Breakthru Advisory Services, Llc | 0 | -100,00 | 0 | |||||
| 2025-07-29 | 13F | Stratos Wealth Partners, LTD. | 443.723 | -2,55 | 11.785 | 3,74 | ||||
| 2025-07-22 | 13F | Echo Wealth Management, LLC | 54.585 | 10,19 | 1.450 | 17,33 | ||||
| 2025-08-04 | 13F | Creative Financial Designs Inc /adv | 1.435 | 0,00 | 38 | 8,57 | ||||
| 2025-08-14 | 13F | Synovus Financial Corp | 221.781 | 5,49 | 5.891 | 12,30 | ||||
| 2025-07-23 | 13F | Clear Creek Financial Management, LLC | 10.600 | 0,00 | 282 | 6,44 | ||||
| 2025-07-09 | 13F | Pallas Capital Advisors LLC | 22.030 | -62,40 | 585 | -59,96 | ||||
| 2025-08-12 | 13F | SRS Capital Advisors, Inc. | 45.101 | -6,16 | 1.198 | -0,17 | ||||
| 2025-07-16 | 13F | Castleview Partners, Llc | 28.452 | -0,29 | 756 | 6,19 | ||||
| 2025-08-05 | 13F | Sigma Planning Corp | 155.309 | -8,97 | 4.125 | -3,10 | ||||
| 2025-08-11 | 13F | Advisor Resource Council | 10.135 | 5,08 | 269 | 12,08 | ||||
| 2025-07-21 | 13F | Precedent Wealth Partners, Llc | 86.687 | 21,81 | 2.302 | 29,69 | ||||
| 2025-07-22 | 13F | Ergawealth Advisors, Inc. | 56.029 | -12,19 | 1.488 | -6,53 | ||||
| 2025-08-14 | 13F | IHT Wealth Management, LLC | 26.626 | 1,68 | 707 | 8,27 | ||||
| 2025-08-11 | 13F | Private Advisor Group, LLC | 426.708 | 5,96 | 11.333 | 12,80 | ||||
| 2025-08-04 | 13F | Arkadios Wealth Advisors | 52.466 | -1,52 | 1.393 | 4,82 | ||||
| 2025-05-14 | 13F | Ameriprise Financial Inc | 0 | -100,00 | 0 | -100,00 | ||||
| 2025-08-05 | 13F | Atlas Private Wealth Advisors | 207.698 | -25,37 | 5.516 | -20,56 | ||||
| 2025-04-10 | 13F | Whipplewood Advisors, LLC | 0 | -100,00 | 0 | |||||
| 2025-07-17 | 13F | Centennial Wealth Advisory LLC | 1.773.912 | -0,58 | 47.119 | 5,84 | ||||
| 2025-08-14 | 13F | Susquehanna International Group, Llp | 10.868 | -81,31 | 289 | -80,14 | ||||
| 2025-08-14 | 13F | Royal Bank Of Canada | 508.836 | -3,86 | 13.515 | 2,35 | ||||
| 2025-07-09 | 13F | Dynamic Advisor Solutions LLC | 16.761 | -16,99 | 445 | -11,53 | ||||
| 2025-07-17 | 13F | Alliance Wealth Advisors, LLC | 15.469 | 0,00 | 411 | 6,49 | ||||
| 2025-07-17 | 13F | HB Wealth Management, LLC | 8.986 | 0,00 | 239 | 6,25 | ||||
| 2025-08-08 | 13F | Good Life Advisors, LLC | 18.527 | -15,16 | 492 | -9,56 | ||||
| 2025-08-29 | 13F | Centaurus Financial, Inc. | 99.994 | -2,77 | 3 | 0,00 | ||||
| 2025-07-24 | 13F | McKinley Carter Wealth Services, Inc. | 21.637 | 0,00 | 575 | 6,49 | ||||
| 2025-07-15 | 13F | Five Pine Wealth Management | 30.655 | 2,25 | 814 | 8,82 | ||||
| 2025-07-15 | 13F | Legacy Financial Group LLC | 1.933.867 | 0,87 | 51.364 | 7,38 | ||||
| 2025-08-01 | 13F | Envestnet Asset Management Inc | 3.480.049 | 1,32 | 92.430 | 7,86 | ||||
| 2025-08-27 | 13F/A | Brinker Capital Investments, LLC | 31.340 | 10,16 | 832 | 17,35 | ||||
| 2025-07-17 | 13F | Sound Income Strategies, LLC | 633 | 8,21 | 17 | 14,29 | ||||
| 2025-08-18 | 13F | Tyler-Stone Wealth Management | 117.378 | 8,37 | 3.118 | 15,36 |