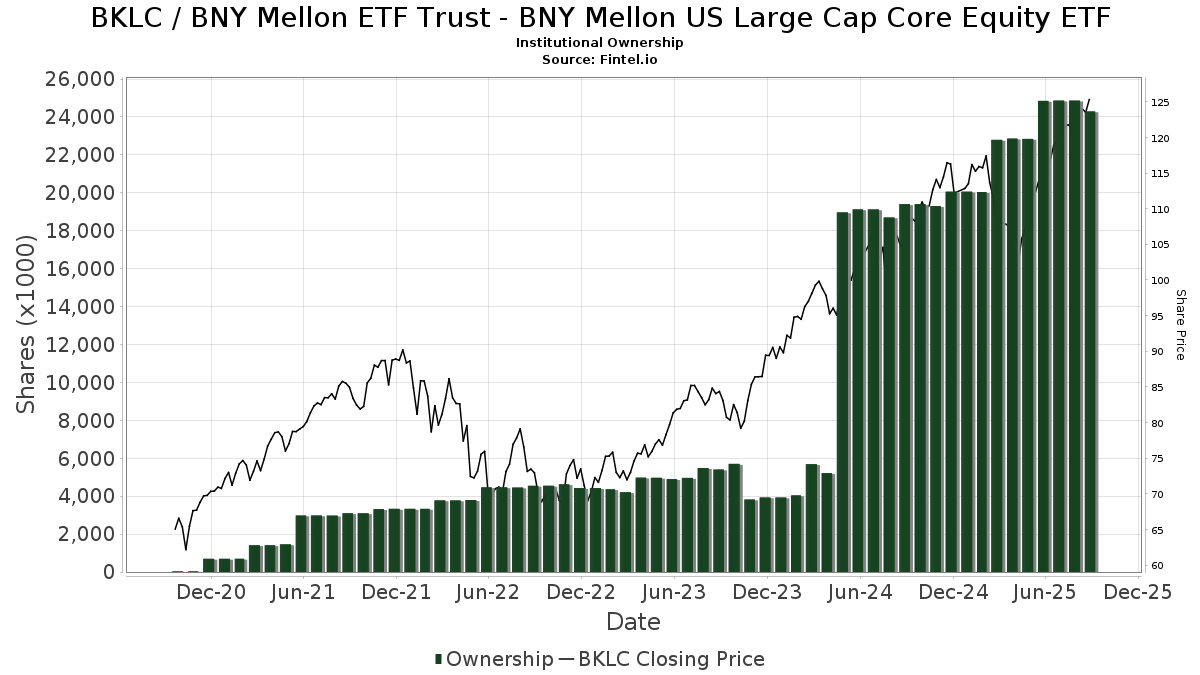
Statistiche di base
| Proprietari istituzionali | 123 total, 122 long only, 0 short only, 1 long/short - change of 12,84% MRQ |
| Allocazione media del portafoglio | 1.1381 % - change of -5,98% MRQ |
| Azioni istituzionali (Long) | 24.293.265 (ex 13D/G) - change of -0,56MM shares -2,24% MRQ |
| Valore istituzionale (Long) | $ 2.867.222 USD ($1000) |
Proprietà istituzionale e azionisti
BNY Mellon ETF Trust - BNY Mellon US Large Cap Core Equity ETF (US:BKLC) ha 123 proprietari istituzionali e azionisti che hanno presentato i moduli 13D/G o 13F alla Securities Exchange Commission (SEC). Queste istituzioni detengono un totale di 24,293,265 azioni. I maggiori azionisti includono RPOA Advisors, Inc., Integrated Wealth Concepts LLC, Bank of New York Mellon Corp, Sentinel Pension Advisors Inc, RAA - SMI 3Fourteen Real Asset Allocation ETF SMI 3Fourteen REAL Asset Allocation ETF, Stadion Money Management, LLC, Toroso Investments, LLC, GM Advisory Group, Inc., Ameriprise Financial Inc, and Northwestern Mutual Wealth Management Co .
(BNY Mellon ETF Trust - BNY Mellon US Large Cap Core Equity ETF (ARCA:BKLC) la struttura proprietaria istituzionale mostra le attuali posizioni nella società da parte di istituzioni e fondi, nonché le ultime variazioni nella dimensione della posizione. I principali azionisti possono essere singoli investitori, fondi comuni, hedge fund o istituzioni. L'allegato 13D indica che l'investitore detiene (o ha detenuto) più del 5% della società e intende (o intendeva) perseguire attivamente un cambiamento nella strategia aziendale. L'allegato 13G indica un investimento passivo superiore al 5%.
The share price as of September 10, 2025 is 125,32 / share. Previously, on September 11, 2024, the share price was 105,32 / share. This represents an increase of 18,99% over that period.
Indice del sentiment dei fondi
L'indice del sentiment dei fondi (anche noto come "indice di accumulo di proprietà") individua i titoli più acquistati dai fondi. È il risultato di un sofisticato modello quantitativo multi-fattore che identifica le società con i più alti livelli di accumulo istituzionale. Il modello utilizza una combinazione dell'aumento totale dei proprietari dichiarati, delle variazioni nelle allocazioni di portafoglio di tali proprietari e di altre metriche. Il punteggio varia da 0 a 100: i numeri più alti indicano un livello di accumulo superiore ad altre società, mentre 50 rappresenta la media.
Frequenza di aggiornamento: giornaliera
Consulta Ownership Explorer per visualizzare l'elenco delle aziende con il ranking più alto.
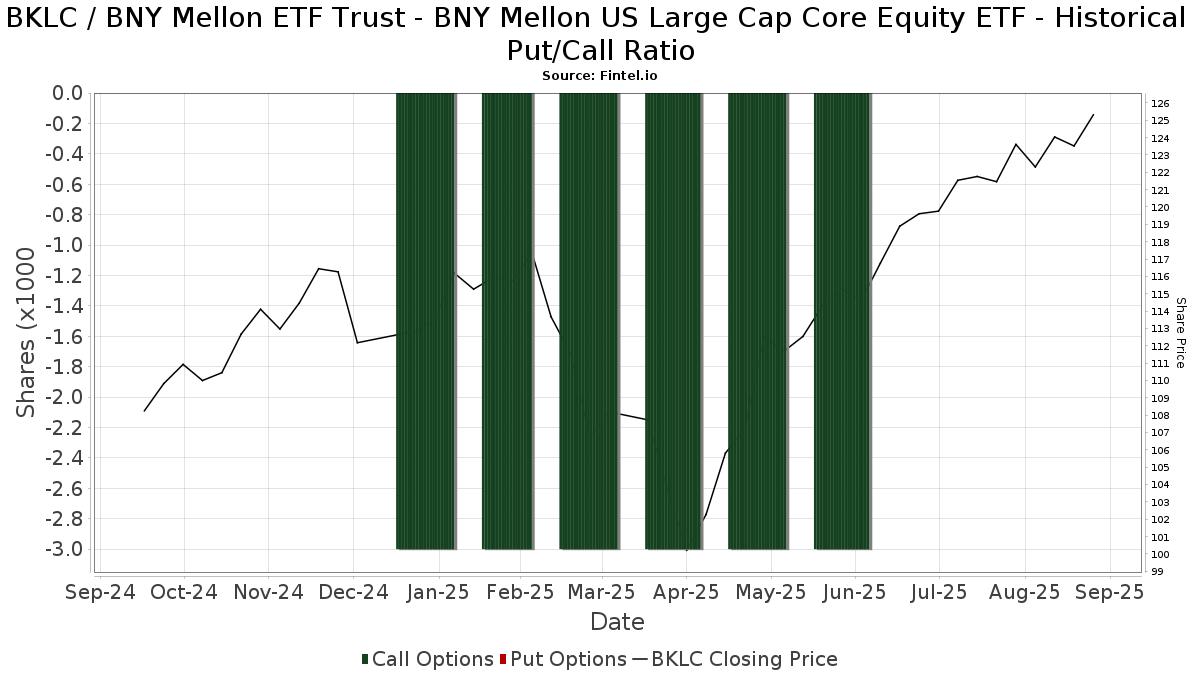
Rapporto put/call istituzionale
Oltre a segnalare le emissioni standard di titoli azionari e di debito, gli istituti con più di 100 milioni di asset in gestione devono anche dichiarare le loro partecipazioni in opzioni put e call. Poiché le opzioni put indicano generalmente un sentiment negativo e le opzioni call un sentiment positivo, possiamo avere un'idea del sentiment istituzionale complessivo attraverso il rapporto tra put e call. Il grafico a destra mostra il rapporto storico put/call per questo strumento.
L'utilizzo del rapporto put/call come indicatore del sentiment degli investitori consente di superare una delle principali lacune dell'utilizzo della proprietà istituzionale totale, ovvero il fatto che una quantità significativa di asset in gestione viene investita passivamente per seguire gli indici. Generalmente, i fondi a gestione passiva non acquistano opzioni, per cui il rapporto put/call riflette più fedelmente il sentiment dei fondi a gestione attiva.
Depositi 13F e NPORT
Le informazioni relative ai depositi 13F sono gratuite. Per accedere alle informazioni relative ai depositi NP è necessario un'abbonamento premium. Le righe verdi indicano le nuove posizioni. Le righe rosse indicano le posizioni chiuse. Fai clic sull'icona del link per visualizzare la cronologia completa delle transazioni.
Esegui l'upgrade
per sbloccare i dati premium ed esportarli in Excel ![]() .
.
| Data di deposito | Fonte | Investitore | Tipo | Prezzo medio (Stima) |
Azioni | Δ Azioni (%) |
Valore dichiarato ($ 1000) |
Δ Valore (%) |
Allocazione del portafoglio (%) |
|
|---|---|---|---|---|---|---|---|---|---|---|
| 2025-08-12 | 13F | Jpmorgan Chase & Co | 112.192 | 539,09 | 13.287 | 612,00 | ||||
| 2025-08-29 | NP | RAA - SMI 3Fourteen Real Asset Allocation ETF SMI 3Fourteen REAL Asset Allocation ETF | 808.422 | 8,01 | 95.741 | 20,32 | ||||
| 2025-07-09 | 13F | WealthCare Investment Partners, LLC | 2.848 | 0,00 | 342 | 22,22 | ||||
| 2025-08-12 | 13F | Quadcap Wealth Management, LLC | 5.604 | 0,11 | 664 | 11,43 | ||||
| 2025-07-25 | 13F | Concord Wealth Partners | 0 | -100,00 | 0 | |||||
| 2025-08-11 | 13F | Aptus Capital Advisors, LLC | 179.103 | 335,02 | 21.211 | 384,60 | ||||
| 2025-05-05 | 13F | Transce3nd, LLC | 0 | -100,00 | 0 | |||||
| 2025-08-14 | 13F | Mariner, LLC | 2.645 | -45,69 | 313 | -39,46 | ||||
| 2025-07-08 | 13F | Parallel Advisors, LLC | 50 | 0,00 | 6 | 0,00 | ||||
| 2025-08-04 | 13F | Assetmark, Inc | 0 | -100,00 | 0 | |||||
| 2025-08-11 | 13F | CFS Investment Advisory Services, LLC | 0 | -100,00 | 0 | |||||
| 2025-08-13 | 13F | Northwestern Mutual Wealth Management Co | 307.822 | 12,69 | 36.455 | 25,53 | ||||
| 2025-08-14 | 13F | Jane Street Group, Llc | 21.406 | 106,03 | 2.535 | 129,62 | ||||
| 2025-08-18 | 13F | Geneos Wealth Management Inc. | 1.857 | 44,51 | 220 | 61,03 | ||||
| 2025-08-08 | 13F | Cetera Investment Advisers | 56.685 | 4,20 | 6.713 | 16,08 | ||||
| 2025-08-13 | 13F | Capital Analysts, Inc. | 375 | 13,64 | 0 | |||||
| 2025-08-15 | 13F | CI Private Wealth, LLC | 2.482 | -17,46 | 294 | -8,15 | ||||
| 2025-08-05 | 13F | Bank of New York Mellon Corp | 1.798.063 | -40,91 | 212.945 | -34,18 | ||||
| 2025-08-05 | 13F | Bank Of Montreal /can/ | 5.270 | 0,00 | 624 | 11,43 | ||||
| 2025-08-12 | 13F | DiMeo Schneider & Associates, L.L.C. | 2.495 | 0,00 | 295 | 11,32 | ||||
| 2025-08-06 | 13F | Commonwealth Equity Services, Llc | 8.139 | 45,08 | 1 | |||||
| 2025-08-14 | 13F | Susquehanna International Group, Llp | 34.196 | -7,28 | 4.050 | 3,26 | ||||
| 2025-07-29 | 13F | Pinnacle Wealth Management, LLC | 4.983 | -4,65 | 590 | 6,31 | ||||
| 2025-07-16 | 13F | Wealth Group Ltd | 13.534 | 1.603 | ||||||
| 2025-07-23 | 13F | REAP Financial Group, LLC | 760 | 0,00 | 90 | 12,50 | ||||
| 2025-07-10 | 13F | Kmg Fiduciary Partners, Llc | 67.389 | 4,40 | 7.981 | 16,28 | ||||
| 2025-07-24 | 13F | Stiles Financial Services Inc | 27.469 | -22,64 | 3.254 | -13,85 | ||||
| 2025-07-29 | 13F | Crux Wealth Advisors | 60.473 | 113,31 | 7.162 | 137,59 | ||||
| 2025-07-15 | 13F | Define Financial, Llc | 1.703 | 202 | ||||||
| 2025-08-14 | 13F | Goldman Sachs Group Inc | 1.814 | 215 | ||||||
| 2025-08-01 | NP | Advisors Preferred Trust - Dynamic Alpha Macro Fund Institutional Class Shares | 89.643 | 0,00 | 10.616 | 11,40 | ||||
| 2025-08-13 | 13F | Northern Trust Corp | 1.905 | 0,00 | 226 | 11,39 | ||||
| 2025-08-11 | 13F | Goodman Financial Corp | 0 | -100,00 | 0 | |||||
| 2025-08-08 | 13F | Empower Advisory Group, LLC | 2.310 | 274 | ||||||
| 2025-08-15 | 13F | Equitable Holdings, Inc. | 56.607 | 70,43 | 6.704 | 89,83 | ||||
| 2025-08-01 | 13F | Zhang Financial LLC | 305.121 | 8,15 | 36.136 | 20,47 | ||||
| 2025-08-08 | 13F | Compass Wealth Management LLC | 0 | -100,00 | 0 | |||||
| 2025-08-14 | 13F | Raymond James Financial Inc | 4.105 | 3,45 | 486 | 15,44 | ||||
| 2025-07-10 | 13F | Wealth Enhancement Advisory Services, Llc | 2.377 | -96,94 | 285 | -96,55 | ||||
| 2025-05-13 | 13F | Neuberger Berman Group LLC | 0 | -100,00 | 0 | |||||
| 2025-07-21 | 13F | Single Point Partners, LLC | 9.037 | 1 | ||||||
| 2025-08-05 | 13F | Simplex Trading, Llc | 41 | 0 | ||||||
| 2025-07-29 | 13F | BKD Wealth Advisors, LLC | 2.079 | 246 | ||||||
| 2025-07-29 | 13F | Woodard & Co Asset Management Group Inc /adv | 230.107 | 2.868,74 | 27.252 | 3.207,16 | ||||
| 2025-08-11 | 13F | Wealthspire Advisors, LLC | 7.874 | 932 | ||||||
| 2025-04-10 | 13F | Retireful, LLC | 0 | -100,00 | 0 | |||||
| 2025-08-15 | 13F | Lantern Wealth Advisors, LLC | 5.822 | 89,52 | 690 | 100,29 | ||||
| 2025-05-15 | 13F | GWM Advisors LLC | 0 | -100,00 | 0 | |||||
| 2025-08-01 | 13F | Envestnet Asset Management Inc | 74.631 | 62,25 | 8.839 | 80,74 | ||||
| 2025-08-14 | 13F | Integrated Wealth Concepts LLC | 2.427.445 | 11,76 | 287.482 | 24,48 | ||||
| 2025-07-25 | 13F | We Are One Seven, LLC | 132.111 | -10,04 | 15.646 | 0,20 | ||||
| 2025-08-14 | 13F | Ameriprise Financial Inc | 364.511 | 5,38 | 43.169 | 17,38 | ||||
| 2025-08-12 | 13F | Proequities, Inc. | 0 | 0 | ||||||
| 2025-08-14 | 13F | CoreCap Advisors, LLC | 9 | 1 | ||||||
| 2025-04-23 | 13F | Win Advisors, Inc | 0 | -100,00 | 0 | |||||
| 2025-07-25 | 13F | Atria Wealth Solutions, Inc. | 11.060 | -16,11 | 1.327 | -5,35 | ||||
| 2025-08-12 | 13F | LPL Financial LLC | 181.577 | -45,71 | 21.504 | -39,53 | ||||
| 2025-08-14 | 13F | UBS Group AG | 78.070 | 6,25 | 9.246 | 18,36 | ||||
| 2025-08-15 | 13F | Kestra Advisory Services, LLC | 97.978 | -2,46 | 11.604 | 8,65 | ||||
| 2025-08-04 | 13F | Spire Wealth Management | 16 | 0,00 | 2 | 0,00 | ||||
| 2025-08-11 | 13F | FSA Wealth Management LLC | 316 | 37 | ||||||
| 2025-08-14 | 13F | Fort Point Capital Partners LLC | 11.735 | 0,70 | 1.390 | 12,20 | ||||
| 2025-08-13 | 13F | Flow Traders U.s. Llc | 24.868 | 58,26 | 3 | 100,00 | ||||
| 2025-07-14 | 13F | Sowell Financial Services LLC | 2.330 | 0,00 | 276 | 11,34 | ||||
| 2025-08-08 | 13F | Capital Investment Advisory Services, LLC | 3.603 | 34,79 | 427 | 50,00 | ||||
| 2025-07-03 | 13F | Collective Family Office Llc | 11.657 | 8,05 | 1.381 | 20,31 | ||||
| 2025-08-06 | 13F | First Horizon Advisors, Inc. | 364 | -11,86 | 43 | 0,00 | ||||
| 2025-08-13 | 13F | Cerity Partners LLC | 2.443 | -31,01 | 289 | -23,14 | ||||
| 2025-08-13 | 13F | First Trust Advisors Lp | 1.968 | -61,05 | 233 | -56,61 | ||||
| 2025-05-15 | 13F | DZ BANK AG Deutsche Zentral Genossenschafts Bank, Frankfurt am Main | 0 | -100,00 | 0 | |||||
| 2025-06-27 | NP | DUBS - Aptus Large Cap Enhanced Yield ETF | 57.414 | 8,79 | 6.074 | -0,30 | ||||
| 2025-09-04 | 13F/A | Advisor Group Holdings, Inc. | 163.741 | 3,74 | 19.393 | 15,55 | ||||
| 2025-07-29 | NP | EBI - Longview Advantage ETF | 0 | -100,00 | 0 | -100,00 | ||||
| 2025-08-12 | 13F | CIBC Private Wealth Group, LLC | 150 | 0,00 | 18 | 21,43 | ||||
| 2025-08-14 | 13F | Fmr Llc | 14.719 | 250,20 | 1.743 | 290,81 | ||||
| 2025-07-17 | 13F | David Kennon Inc | 18.779 | 2,96 | 2.224 | 14,65 | ||||
| 2025-07-25 | 13F | Sequoia Financial Advisors, LLC | 1.840 | 218 | ||||||
| 2025-07-15 | 13F | Retirement Income Solutions, Inc | 7.460 | 0,00 | 883 | 11,35 | ||||
| 2025-08-12 | 13F | Wealthbridge Capital Management, Llc | 140.671 | 6,33 | 16.660 | 18,43 | ||||
| 2025-05-13 | 13F | Watchman Group, Inc. | 0 | -100,00 | 0 | |||||
| 2025-08-08 | 13F | Pnc Financial Services Group, Inc. | 350 | 0,00 | 41 | 10,81 | ||||
| 2025-08-11 | 13F | Principal Securities, Inc. | 4.229 | -0,94 | 501 | 4,60 | ||||
| 2025-07-14 | 13F | Sentinel Pension Advisors Inc | 852.649 | 2,00 | 100.979 | 13,62 | ||||
| 2025-08-15 | 13F/A | Symphony Financial, Ltd. Co. | 22.164 | 2.635 | ||||||
| 2025-08-14 | 13F | Principia Wealth Advisory, LLC | 13.521 | 1.601 | ||||||
| 2025-08-27 | 13F/A | Brinker Capital Investments, LLC | 9.230 | 1.093 | ||||||
| 2025-08-14 | 13F | Toroso Investments, LLC | 553.746 | -12,73 | 65.395 | -3,06 | ||||
| 2025-08-14 | 13F | Herold Advisors, Inc. | 14.526 | -17,23 | 1.720 | -7,77 | ||||
| 2025-07-31 | 13F | Cambridge Investment Research Advisors, Inc. | 2.337 | 16,04 | 0 | |||||
| 2025-08-08 | 13F | Cornerstone Advisors Asset Management, Inc | 14.300 | 0,00 | 1.694 | 11,38 | ||||
| 2025-08-14 | 13F | Bank Of America Corp /de/ | 6.592 | -1,36 | 781 | 9,86 | ||||
| 2025-07-29 | 13F | RPOA Advisors, Inc. | 12.726.372 | -2,40 | 1.507.184 | 8,72 | ||||
| 2025-08-04 | 13F | JDM Financial Group LLC | 235.158 | 10,22 | 27.850 | 22,78 | ||||
| 2025-08-14 | 13F | Old Mission Capital Llc | 3.009 | 356 | ||||||
| 2025-06-30 | NP | SMIDX - SMI Dynamic Allocation Fund | 8.460 | 895 | ||||||
| 2025-08-15 | 13F | Morgan Stanley | 110.223 | 275,36 | 13.054 | 318,10 | ||||
| 2025-08-13 | 13F | EverSource Wealth Advisors, LLC | 195 | 0,00 | 23 | 15,00 | ||||
| 2025-08-13 | 13F | Wills Financial Group LLC | 1.700 | -15,30 | 201 | -5,63 | ||||
| 2025-08-08 | 13F | Accredited Investors Inc. | 1.946 | 230 | ||||||
| 2025-08-14 | 13F | Royal Bank Of Canada | 5.040 | 26,16 | 597 | 40,47 | ||||
| 2025-08-14 | 13F | Hrt Financial Lp | 0 | -100,00 | 0 | |||||
| 2025-08-14 | 13F | McIlrath & Eck, LLC | 8 | 0,00 | 1 | |||||
| 2025-07-29 | 13F | ShoreHaven Wealth Partners, LLC | 4.020 | -3,55 | 476 | 7,45 | ||||
| 2025-08-07 | 13F | Wealth Forward, LLC | 20.232 | -0,08 | 2.396 | 11,34 | ||||
| 2025-07-28 | 13F | Harbour Investments, Inc. | 166 | 0,00 | 20 | 11,76 | ||||
| 2025-07-25 | 13F | Envestnet Portfolio Solutions, Inc. | 0 | -100,00 | 0 | |||||
| 2025-05-13 | 13F | Prime Capital Investment Advisors, LLC | 0 | -100,00 | 0 | |||||
| 2025-07-22 | 13F | Carolina Wealth Advisors, LLC | 894 | 106 | ||||||
| 2025-08-05 | 13F | Advisors Preferred, LLC | 89.643 | 0,00 | 10.607 | 10,57 | ||||
| 2025-07-22 | 13F | Duncan Williams Asset Management, LLC | 3.152 | 373 | ||||||
| 2025-07-25 | 13F | Concurrent Investment Advisors, LLC | 16.918 | 7,36 | 2.004 | 19,58 | ||||
| 2025-08-01 | 13F | Transcend Wealth Collective, Llc | 2.010 | 0,00 | 238 | 11,74 | ||||
| 2025-05-14 | 13F | Hill Investment Group Partners, LLC | 0 | -100,00 | 0 | |||||
| 2025-08-05 | 13F | Key FInancial Inc | 139 | 0,00 | 16 | 14,29 | ||||
| 2025-08-14 | 13F | Mercer Global Advisors Inc /adv | 6.421 | 0,34 | 760 | 11,76 | ||||
| 2025-08-14 | 13F | Mml Investors Services, Llc | 12.712 | 81,70 | 2 | |||||
| 2025-08-04 | 13F | Creekmur Asset Management LLC | 276 | 33 | ||||||
| 2025-07-24 | 13F | IFP Advisors, Inc | 63.259 | 139,90 | 7.492 | 167,25 | ||||
| 2025-07-22 | 13F | Kickstand Ventures, Llc. | 3.152 | -5,15 | 373 | 5,67 | ||||
| 2025-08-11 | 13F | HighTower Advisors, LLC | 3.556 | 0,28 | 421 | 11,67 | ||||
| 2025-08-12 | 13F | Insigneo Advisory Services, Llc | 7.869 | -0,54 | 932 | 10,70 | ||||
| 2025-07-17 | 13F | One Wealth Advisors, LLC | 3.347 | 19,62 | 396 | 33,33 | ||||
| 2025-08-14 | 13F | Betterment LLC | 4.120 | -30,63 | 0 | |||||
| 2025-08-14 | 13F | Stadion Money Management, LLC | 728.410 | -6,40 | 86.027 | 3,97 | ||||
| 2025-07-29 | 13F | Stratos Wealth Partners, LTD. | 14.746 | -46,78 | 1.746 | -40,73 | ||||
| 2025-08-12 | 13F | Global Retirement Partners, LLC | 617 | 26,43 | 73 | 35,19 | ||||
| 2025-08-04 | 13F | Mayflower Financial Advisors, LLC | 4.248 | 5,78 | 503 | 18,08 | ||||
| 2025-08-07 | 13F | BOK Financial Private Wealth, Inc. | 1.905 | 0,00 | 226 | 11,39 | ||||
| 2025-06-30 | NP | SMILX - SMI 50/40/10 Fund | 2.470 | 261 | ||||||
| 2025-08-01 | 13F | Belvedere Trading LLC | Call | 3.600 | 9,09 | 426 | 21,71 | |||
| 2025-07-17 | 13F | Clear Point Advisors Inc. | 3.058 | 12,55 | 362 | 25,69 | ||||
| 2025-08-01 | 13F | Belvedere Trading LLC | Put | 100 | 12 | |||||
| 2025-04-29 | 13F | Resources Investment Advisors, LLC. | 0 | -100,00 | 0 | |||||
| 2025-08-05 | 13F | Sigma Planning Corp | 14.876 | 1.762 | ||||||
| 2025-08-13 | 13F | GM Advisory Group, Inc. | 452.842 | 8,46 | 53.630 | 20,81 | ||||
| 2025-08-14 | 13F | Dean, Jacobson Financial Services, LLC | 3.646 | 432 | ||||||
| 2025-08-12 | 13F | Steward Partners Investment Advisory, Llc | 5.323 | 4,03 | 630 | 15,81 | ||||
| 2025-08-13 | 13F | M&t Bank Corp | 2.492 | -68,12 | 295 | -64,50 | ||||
| 2025-08-14 | 13F | Wells Fargo & Company/mn | 1.958 | -53,15 | 232 | -47,97 | ||||
| 2025-08-11 | 13F | Trajan Wealth LLC | 0 | -100,00 | 0 | |||||
| 2025-05-09 | 13F | Belvedere Trading LLC | 0 | -100,00 | 0 | -100,00 | ||||
| 2025-07-31 | 13F | GenTrust, LLC | 35.370 | 842,95 | 4.189 | 952,26 | ||||
| 2025-08-19 | 13F | Advisory Services Network, LLC | 16.022 | 1.951 | ||||||
| 2025-07-14 | 13F | Park Avenue Securities Llc | 10.768 | 1 | ||||||
| 2025-08-14 | 13F | Two Sigma Investments, Lp | 90.600 | 10.730 | ||||||
| 2025-05-02 | 13F | Wealthfront Advisers Llc | 0 | -100,00 | 0 | -100,00 |