Statistiche di base
| Azioni istituzionali (Long) | 13.530.092 - 39,05% (ex 13D/G) - change of -0,07MM shares -0,53% MRQ |
| Valore istituzionale (Long) | $ 170.500 USD ($1000) |
Proprietà istituzionale e azionisti
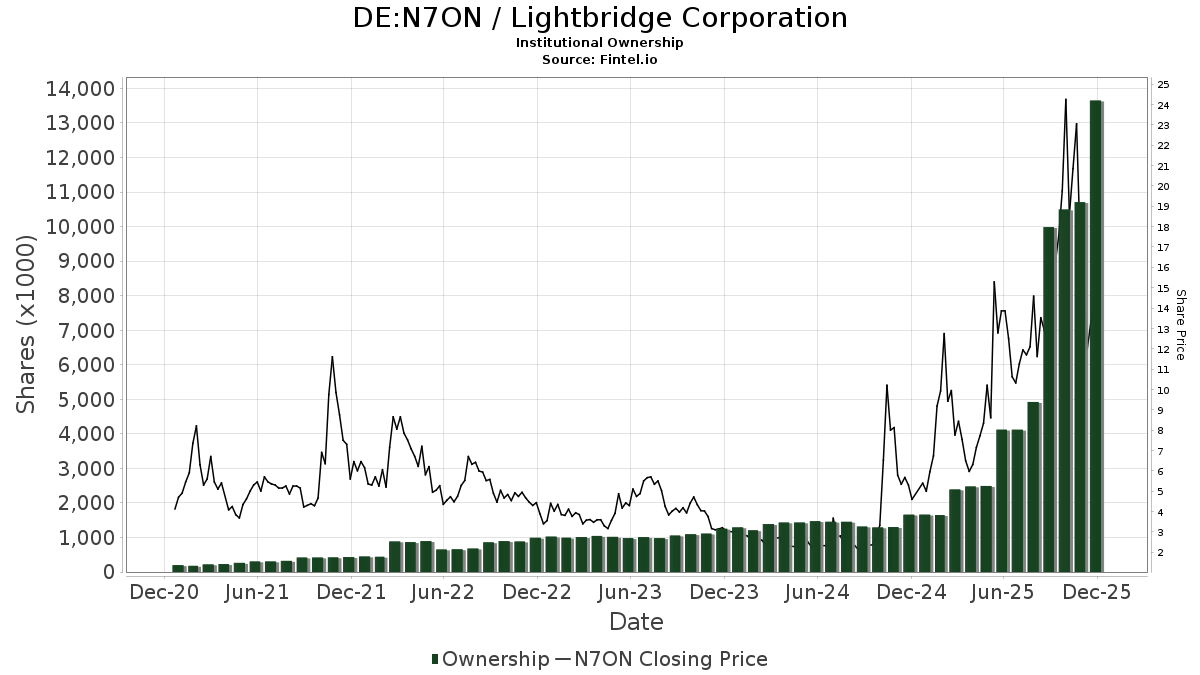
Lightbridge Corporation (DE:N7ON) ha 120 proprietari istituzionali e azionisti che hanno presentato i moduli 13D/G o 13F alla Securities Exchange Commission (SEC). Queste istituzioni detengono un totale di 13,530,092 azioni. I maggiori azionisti includono BlackRock, Inc., State Street Corp, Vanguard Group Inc, Exchange Traded Concepts, Llc, UBS Group AG, Geode Capital Management, Llc, Ameriprise Financial Inc, Renaissance Technologies Llc, Morgan Stanley, and Nuveen, LLC .
(Lightbridge Corporation (DB:N7ON) la struttura proprietaria istituzionale mostra le attuali posizioni nella società da parte di istituzioni e fondi, nonché le ultime variazioni nella dimensione della posizione. I principali azionisti possono essere singoli investitori, fondi comuni, hedge fund o istituzioni. L'allegato 13D indica che l'investitore detiene (o ha detenuto) più del 5% della società e intende (o intendeva) perseguire attivamente un cambiamento nella strategia aziendale. L'allegato 13G indica un investimento passivo superiore al 5%.
The share price as of April 7, 2026 is 8,84 / share. Previously, on April 8, 2025, the share price was 6,52 / share. This represents an increase of 35,61% over that period.
Indice del sentiment dei fondi
L'indice del sentiment dei fondi (anche noto come "indice di accumulo di proprietà") individua i titoli più acquistati dai fondi. È il risultato di un sofisticato modello quantitativo multi-fattore che identifica le società con i più alti livelli di accumulo istituzionale. Il modello utilizza una combinazione dell'aumento totale dei proprietari dichiarati, delle variazioni nelle allocazioni di portafoglio di tali proprietari e di altre metriche. Il punteggio varia da 0 a 100: i numeri più alti indicano un livello di accumulo superiore ad altre società, mentre 50 rappresenta la media.
Frequenza di aggiornamento: giornaliera
Consulta Ownership Explorer per visualizzare l'elenco delle aziende con il ranking più alto.
AI+ Ask Fintel’s AI assistant about Lightbridge Corporation.
Select a question to share a public post with an AI-crafted answer.
Thinking of good questions…
Depositi 13F e NPORT
Le informazioni relative ai depositi 13F sono gratuite. Per accedere alle informazioni relative ai depositi NP è necessario un'abbonamento premium. Le righe verdi indicano le nuove posizioni. Le righe rosse indicano le posizioni chiuse. Fai clic sull'icona del link per visualizzare la cronologia completa delle transazioni.
Esegui l'upgrade
per sbloccare i dati premium ed esportarli in Excel ![]() .
.
| Data di deposito | Fonte | Investitore | Tipo | Prezzo medio (Stima) |
Azioni | Δ Azioni (%) |
Valore dichiarato ($ 1000) |
Δ Valore (%) |
Allocazione del portafoglio (%) |
|
|---|---|---|---|---|---|---|---|---|---|---|
| 2026-02-09 | 13F | Geode Capital Management, Llc | 670.661 | 27,37 | 8.479 | -24,09 | ||||
| 2026-02-17 | 13F | CWM Advisors, LLC | 37.417 | 473 | ||||||
| 2026-02-13 | 13F | Citigroup Inc | 822 | -41,78 | 10 | -65,52 | ||||
| 2026-02-17 | 13F | Millennium Management Llc | 236.449 | -36,97 | 2.989 | -62,44 | ||||
| 2026-02-13 | 13F | Morgan Stanley | 376.981 | 7,94 | 4.765 | -35,67 | ||||
| 2026-01-29 | 13F | UBS Group AG | 681.667 | 17,73 | 8.616 | -29,84 | ||||
| 2026-02-11 | 13F | Rise Advisors, LLC | 0 | -100,00 | 0 | |||||
| 2026-02-17 | 13F | Price T Rowe Associates Inc /md/ | 19.682 | 60,83 | 0 | |||||
| 2026-02-19 | 13F | Invesco Ltd. | 17.284 | 48,25 | 218 | -11,74 | ||||
| 2026-02-06 | 13F | Pnc Financial Services Group, Inc. | 63 | -84,37 | 1 | -100,00 | ||||
| 2026-01-14 | 13F | Exchange Traded Concepts, Llc | 828.550 | 16,09 | 10.473 | -30,82 | ||||
| 2026-01-14 | 13F | Wolff Wiese Magana Llc | 3.000 | 0,00 | 38 | -41,27 | ||||
| 2026-01-27 | 13F | Zurcher Kantonalbank (Zurich Cantonalbank) | 4.681 | 59 | ||||||
| 2026-02-17 | 13F | Aqr Capital Management Llc | 11.997 | 152 | ||||||
| 2026-02-18 | 13F | Caitlin John, LLC | 100 | 33,33 | 1 | 0,00 | ||||
| 2025-11-12 | 13F | Intech Investment Management Llc | 0 | -100,00 | 0 | |||||
| 2026-02-11 | 13F | Ameritas Investment Partners, Inc. | 1.914 | 24 | ||||||
| 2026-02-12 | 13F | Renaissance Technologies Llc | 538.505 | 584,25 | 6.807 | 307,79 | ||||
| 2026-01-16 | 13F | Balboa Wealth Partners | 0 | -100,00 | 0 | -100,00 | ||||
| 2026-02-17 | 13F | Two Sigma Advisers, Lp | 0 | -100,00 | 0 | |||||
| 2026-02-09 | 13F | Legal & General Group Plc | 2.731 | 15,77 | 35 | -32,00 | ||||
| 2025-11-14 | 13F | Wolverine Trading, Llc | Call | 113.000 | 2.570 | |||||
| 2025-11-14 | 13F | Wolverine Trading, Llc | Put | 26.000 | 591 | |||||
| 2026-01-28 | 13F | Universal- Beteiligungs- und Servicegesellschaft mbH | 32.000 | -15,79 | 408 | -49,44 | ||||
| 2026-04-06 | 13F | GAMMA Investing LLC | 313 | 389,06 | 3 | |||||
| 2026-02-13 | 13F | Verition Fund Management LLC | 156.023 | 205,62 | 1.972 | 82,26 | ||||
| 2026-02-03 | 13F | Legacy Wealth Managment, LLC/ID | 0 | -100,00 | 0 | |||||
| 2026-02-03 | 13F | Pilgrim Partners Asia Pte Ltd | 116.600 | 0,00 | 1.474 | -40,44 | ||||
| 2026-02-13 | 13F | Rhumbline Advisers | 29.383 | 4,04 | 371 | -37,96 | ||||
| 2026-01-14 | 13F | ORG Partners LLC | 60 | 0,00 | 1 | -100,00 | ||||
| 2026-01-26 | 13F | Cwm, Llc | 397 | 4,47 | 0 | |||||
| 2026-02-17 | 13F | Ancora Advisors, LLC | 1.000 | 13 | ||||||
| 2026-02-17 | 13F | Capital Fund Management S.a. | 36.455 | 461 | ||||||
| 2026-02-17 | 13F | Jones Financial Companies Lllp | 34.601 | -5,90 | 437 | -44,54 | ||||
| 2026-02-12 | 13F | Quadrant Capital Group Llc | 363 | 0,00 | 5 | -42,86 | ||||
| 2026-01-20 | 13F | Sara-Bay Financial | 0 | -100,00 | 0 | |||||
| 2026-02-12 | 13F | Federated Hermes, Inc. | 2.086 | 266,61 | 26 | 116,67 | ||||
| 2026-02-23 | 13F | Virtu Financial LLC | 47.398 | -5,60 | 1 | -100,00 | ||||
| 2026-01-15 | 13F | LeConte Wealth Management, LLC | 12.222 | 9,58 | 154 | -34,75 | ||||
| 2026-02-12 | 13F | Principal Securities, Inc. | 0 | -100,00 | 0 | -100,00 | ||||
| 2026-02-17 | 13F | Two Sigma Investments, Lp | 214.321 | -63,80 | 2.709 | -78,42 | ||||
| 2026-02-13 | 13F | Kilter Group LLC | 89 | 1 | ||||||
| 2026-02-17 | 13F | Scarborough Advisors, LLC | 279 | 4 | ||||||
| 2026-02-17 | 13F | Royal Bank Of Canada | 54.195 | -10,76 | 685 | -46,86 | ||||
| 2026-01-26 | 13F | Ckw Financial Group | 50 | 0,00 | 0 | |||||
| 2026-02-17 | 13F | Signature Equity Partners, LLC | 315 | 4 | ||||||
| 2026-02-13 | 13F | Police & Firemen's Retirement System of New Jersey | 5.747 | 0,00 | 73 | -40,50 | ||||
| 2026-02-03 | 13F | SBI Securities Co., Ltd. | 1.923 | 61,06 | 24 | -4,00 | ||||
| 2026-02-13 | 13F | National Bank Of Canada /fi/ | 1.792 | 4,49 | 23 | -38,89 | ||||
| 2026-02-17 | 13F | Ameriprise Financial Inc | 628.938 | 11,61 | 7.950 | -33,49 | ||||
| 2026-02-10 | 13F | Close Asset Management Ltd | 4.200 | 0,00 | 0 | |||||
| 2026-02-10 | 13F/A | Northwestern Mutual Wealth Management Co | 280 | 4 | ||||||
| 2026-03-12 | 13F/A | Peak6 Llc | Call | 77.000 | -84,56 | 973 | -90,80 | |||
| 2026-01-28 | 13F | Geneos Wealth Management Inc. | 68.199 | 7,04 | 862 | -36,20 | ||||
| 2026-01-14 | 13F | ORG Wealth Partners, LLC | 810 | 10 | ||||||
| 2026-04-07 | 13F | CoreCap Advisors, LLC | 2 | 0,00 | 0 | |||||
| 2026-02-18 | 13F | GWM Advisors LLC | 0 | -100,00 | 0 | |||||
| 2025-11-13 | 13F | Bank Of Montreal /can/ | 0 | -100,00 | 0 | -100,00 | ||||
| 2026-02-14 | 13F | Rockefeller Capital Management L.P. | 21.666 | 1.200,48 | 274 | 680,00 | ||||
| 2026-02-17 | 13F | Driehaus Capital Management Llc | 0 | -100,00 | 0 | |||||
| 2026-02-17 | 13F | Scientech Research LLC | 0 | -100,00 | 0 | |||||
| 2026-01-15 | 13F | Fortitude Family Office, LLC | 59 | 0,00 | 1 | -100,00 | ||||
| 2026-02-11 | 13F | Simplex Trading, Llc | 12.897 | 18,01 | 163 | |||||
| 2026-02-10 | 13F | Envestnet Asset Management Inc | 22.917 | 290 | ||||||
| 2026-02-10 | 13F | Bnp Paribas Arbitrage, Sa | 251.762 | -49,49 | 3.182 | -69,90 | ||||
| 2026-02-17 | 13F | Wiley Bros.-aintree Capital, Llc | 19.154 | 242 | ||||||
| 2026-02-24 | 13F/A | Pacer Advisors, Inc. | 139.589 | 1.764 | ||||||
| 2026-02-13 | 13F | Kestra Advisory Services, LLC | 0 | -100,00 | 0 | |||||
| 2026-02-17 | 13F | Advisor Group Holdings, Inc. | 7.208 | -21,26 | 91 | -41,29 | ||||
| 2026-02-11 | 13F | Deutsche Bank Ag\ | 19.113 | 29,36 | 242 | -23,00 | ||||
| 2026-02-13 | 13F | Baird Financial Group, Inc. | 0 | -100,00 | 0 | |||||
| 2025-11-13 | 13F | FORA Capital, LLC | 0 | -100,00 | 0 | |||||
| 2026-02-10 | 13F | Goldman Sachs Group Inc | 79.229 | 33,24 | 1.001 | -20,62 | ||||
| 2026-02-17 | 13F | Cetera Investment Advisers | 60.129 | 1,98 | 760 | -39,20 | ||||
| 2026-02-11 | 13F | Franklin Resources Inc | 0 | -100,00 | 0 | |||||
| 2025-11-13 | 13F | Quadrature Capital Ltd | 0 | -100,00 | 0 | |||||
| 2026-02-02 | 13F | Dudley Capital Management, Llc | 30.000 | -12,19 | 379 | -47,65 | ||||
| 2026-02-06 | 13F | Tortoise Investment Management, LLC | 215.937 | 32,05 | 2.729 | -21,31 | ||||
| 2026-02-11 | 13F | Group One Trading, L.p. | 29.537 | -76,04 | 373 | -85,74 | ||||
| 2026-02-12 | 13F | Nuveen, LLC | 325.277 | -18,99 | 4.112 | -51,73 | ||||
| 2026-02-13 | 13F | State Street Corp | 1.847.661 | 317,97 | 23.354 | 149,11 | ||||
| 2026-01-28 | 13F | Chicago Partners Investment Group LLC | 13.905 | 245 | ||||||
| 2026-02-17 | 13F | Wellington Management Group Llp | 11.868 | 150 | ||||||
| 2026-02-17 | 13F | Russell Investments Group, Ltd. | 1.831 | -26,17 | 23 | -55,77 | ||||
| 2026-02-13 | 13F | Flow Traders U.s. Llc | 0 | -100,00 | 0 | |||||
| 2026-02-13 | 13F | Y-Intercept (Hong Kong) Ltd | 0 | -100,00 | 0 | -100,00 | ||||
| 2026-03-04 | 13F | SHP Wealth Management | 763 | 10 | ||||||
| 2026-01-29 | 13F | IMC-Chicago, LLC | 42.545 | 538 | ||||||
| 2026-02-12 | 13F | Dimensional Fund Advisors Lp | 11.391 | -33,09 | 144 | -60,39 | ||||
| 2026-02-12 | 13F | EAM Investors, LLC | 0 | -100,00 | 0 | |||||
| 2026-02-13 | 13F | Caitong International Asset Management Co., Ltd | 1.266 | -45,48 | 16 | -67,35 | ||||
| 2026-01-20 | 13F | Independence Bank of Kentucky | 1 | 0,00 | 0 | |||||
| 2026-02-17 | 13F | Mercer Global Advisors Inc /adv | 0 | -100,00 | 0 | |||||
| 2026-02-17 | 13F | Boothbay Fund Management, Llc | 47.690 | 603 | ||||||
| 2026-02-13 | 13F | Mml Investors Services, Llc | 0 | -100,00 | 0 | |||||
| 2026-02-11 | 13F | Jpmorgan Chase & Co | 12.288 | 6,84 | 155 | -36,21 | ||||
| 2026-02-17 | 13F | Advisory Services Network, LLC | 0 | -100,00 | 0 | |||||
| 2025-11-13 | 13F | Jump Financial, LLC | 0 | -100,00 | 0 | |||||
| 2026-02-09 | 13F | Powell Investment Advisors, LLC | 11.650 | 0,00 | 147 | -40,49 | ||||
| 2026-02-17 | 13F | Citadel Advisors Llc | Put | 94.000 | -1,26 | 1.188 | -41,16 | |||
| 2026-02-17 | 13F | Citadel Advisors Llc | Call | 149.700 | -45,44 | 1.892 | -67,49 | |||
| 2026-02-12 | 13F | Commonwealth Equity Services, Llc | 11.333 | 2,96 | 143 | |||||
| 2026-02-17 | 13F | Citadel Advisors Llc | 43.842 | -87,80 | 554 | -92,73 | ||||
| 2026-01-15 | 13F | Lodestone Wealth Management LLC | 500 | 6 | ||||||
| 2026-02-17 | 13F | Tower Research Capital LLC (TRC) | 2.618 | -11,58 | 33 | -46,77 | ||||
| 2025-11-14 | 13F | Cubist Systematic Strategies, LLC | 43.443 | 921 | ||||||
| 2026-02-17 | 13F | Northern Trust Corp | 236.297 | 19,49 | 2.987 | -28,80 | ||||
| 2026-02-13 | 13F | Mariner, LLC | 34.779 | 440 | ||||||
| 2026-01-23 | 13F | Bellevue Asset Management, Llc | 80 | 0,00 | 1 | 0,00 | ||||
| 2026-01-27 | 13F | GHP Investment Advisors, Inc. | 7 | 0,00 | 0 | |||||
| 2026-02-05 | 13F | Allworth Financial LP | 20 | 1.900,00 | 0 | |||||
| 2026-02-09 | 13F | Themes Management Co LLC | 33.340 | 421 | ||||||
| 2026-02-18 | 13F | CrossGen Wealth, LLC | 2.034 | 26 | ||||||
| 2026-02-13 | 13F | SRS Capital Advisors, Inc. | 0 | -100,00 | 0 | |||||
| 2026-02-09 | 13F | Huntington National Bank | 1.001 | 0,00 | 13 | -42,86 | ||||
| 2026-01-29 | 13F | Vanguard Group Inc | 1.828.494 | 22,93 | 23.112 | -26,74 | ||||
| 2026-02-17 | 13F | Fmr Llc | 812 | 34,21 | 10 | -16,67 | ||||
| 2026-02-06 | 13F/A | Rathbone Brothers plc | 19.232 | 4,62 | 243 | -37,53 | ||||
| 2026-02-12 | 13F | Jane Street Group, Llc | Call | 84.200 | -61,18 | 1.064 | -76,87 | |||
| 2026-02-12 | 13F | Jane Street Group, Llc | 198.085 | -7,69 | 2.504 | -45,00 | ||||
| 2025-12-29 | 13F | Cape Investment Advisory, Inc. | 0 | -100,00 | 0 | -100,00 | ||||
| 2026-02-12 | 13F | Jane Street Group, Llc | Put | 56.600 | -23,41 | 715 | -54,37 | |||
| 2026-02-13 | 13F | Barclays Plc | 41.791 | 38,19 | 528 | -17,63 | ||||
| 2026-02-17 | 13F | XTX Topco Ltd | 21.155 | -18,19 | 267 | -51,28 | ||||
| 2026-02-17 | 13F | MIRAE ASSET GLOBAL ETFS HOLDINGS Ltd. | 12.435 | 26,62 | 157 | -24,52 | ||||
| 2026-02-12 | 13F | MetLife Investment Management, LLC | 15.489 | 30,08 | 196 | -22,62 | ||||
| 2025-11-14 | 13F | OMERS ADMINISTRATION Corp | 0 | -100,00 | 0 | |||||
| 2026-02-13 | 13F | Sterling Capital Management LLC | 172 | 237,25 | 2 | 100,00 | ||||
| 2026-02-13 | 13F | Wells Fargo & Company/mn | 53.542 | 185,21 | 677 | 69,85 | ||||
| 2026-02-17 | 13F | Susquehanna International Group, Llp | 285.360 | -52,54 | 3.607 | -71,72 | ||||
| 2026-02-17 | 13F | Susquehanna International Group, Llp | Put | 212.500 | -31,74 | 2.686 | -59,32 | |||
| 2026-02-04 | 13F | Dogwood Wealth Management LLC | 4 | 0 | ||||||
| 2026-02-05 | 13F | Amalgamated Bank | 842 | 31,56 | 0 | |||||
| 2026-02-17 | 13F | Susquehanna International Group, Llp | Call | 204.400 | -37,30 | 2.584 | -62,64 | |||
| 2026-01-30 | 13F | Us Bancorp \de\ | 5.430 | 69 | ||||||
| 2025-12-02 | 13F | IFP Advisors, Inc | 0 | 0 | ||||||
| 2026-02-10 | 13F | Foundations Investment Advisors, LLC | 70.384 | 890 | ||||||
| 2026-02-17 | 13F | California State Teachers Retirement System | 1.649 | 40,82 | 21 | -16,67 | ||||
| 2026-02-06 | 13F | Leonteq Securities AG | 4.000 | 196,30 | 51 | 78,57 | ||||
| 2026-01-28 | 13F | Eagle Global Advisors Llc | 12.900 | 26,47 | 163 | -24,54 | ||||
| 2025-11-14 | 13F | Arosa Capital Management LP | 0 | -100,00 | 0 | |||||
| 2026-02-11 | 13F | Fox Run Management, L.l.c. | 42.238 | 534 | ||||||
| 2026-04-07 | 13F | Farther Finance Advisors, LLC | 17 | 30,77 | 0 | |||||
| 2026-02-12 | 13F | Federation des caisses Desjardins du Quebec | 600 | -29,41 | 8 | -61,11 | ||||
| 2026-02-17 | 13F | Raymond James Financial Inc | 12.797 | -0,35 | 162 | -40,81 | ||||
| 2026-02-10 | 13F | Bank of New York Mellon Corp | 60.728 | 33,98 | 768 | -20,19 | ||||
| 2026-02-12 | 13F | BlackRock, Inc. | 2.011.591 | 34,91 | 25.427 | -19,60 | ||||
| 2026-02-11 | 13F | Meeder Asset Management Inc | 22.660 | 286 | ||||||
| 2026-02-13 | 13F | Charles Schwab Investment Management Inc | 87.614 | 36,36 | 1.107 | -18,72 | ||||
| 2026-02-17 | 13F | Bank Of America Corp /de/ | 54.516 | 27,96 | 689 | -23,70 | ||||
| 2026-02-11 | 13F | LPL Financial LLC | 61.437 | 46,94 | 777 | -12,42 | ||||
| 2026-02-12 | 13F | New York State Common Retirement Fund | 6.700 | 0,00 | 85 | -40,43 | ||||
| 2025-11-14 | 13F | Sculptor Capital LP | 0 | -100,00 | 0 | -100,00 | ||||
| 2025-11-14 | 13F | Sculptor Capital LP | Put | 0 | -100,00 | 0 | -100,00 | |||
| 2026-02-06 | 13F | EverSource Wealth Advisors, LLC | 49 | 0,00 | 1 | -100,00 | ||||
| 2026-01-21 | 13F | Stone House Investment Management, LLC | 4.872 | 0,00 | 62 | -40,78 | ||||
| 2026-02-25 | 13F | Tempo Wealth, LLC | 63.325 | 800 |
Other Listings
| US:LTBR | 10,32 USD |