Statistiche di base
| Proprietari istituzionali | 161 total, 152 long only, 0 short only, 9 long/short - change of -5,29% MRQ |
| Allocazione media del portafoglio | 0.3566 % - change of -51,11% MRQ |
| Azioni istituzionali (Long) | 104.459.286 (ex 13D/G) - change of -43,88MM shares -29,58% MRQ |
| Valore istituzionale (Long) | $ 1.491.584 USD ($1000) |
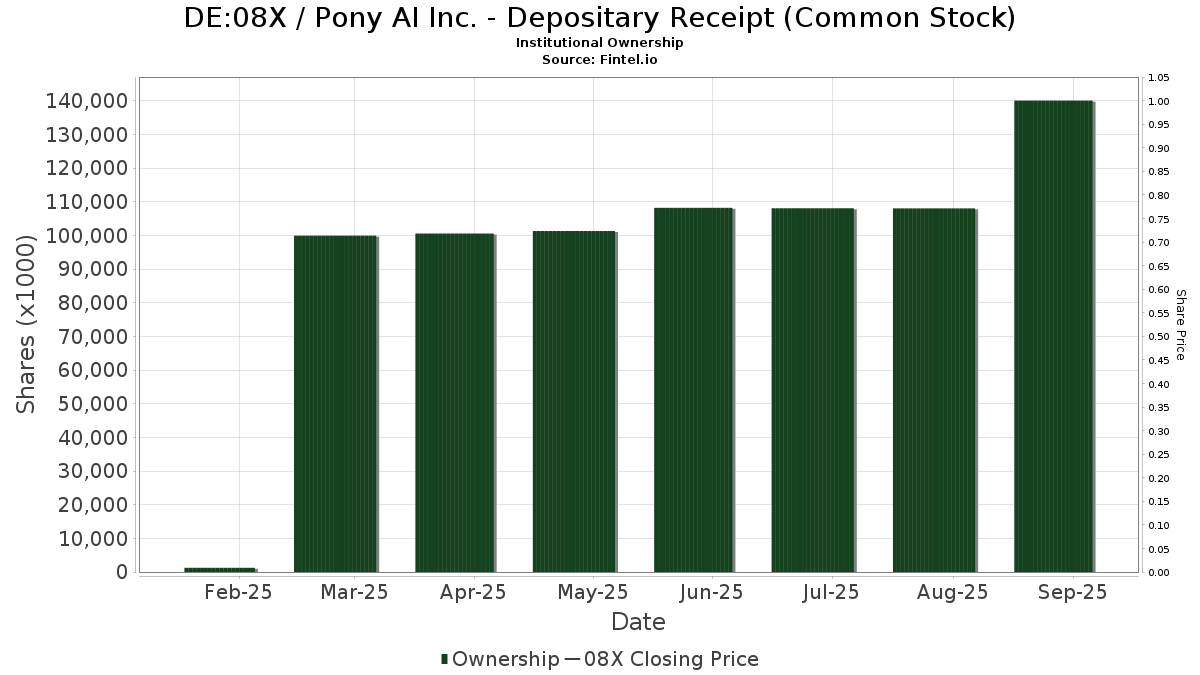
Proprietà istituzionale e azionisti
Pony AI Inc. - Depositary Receipt (Common Stock) (DE:08X) ha 161 proprietari istituzionali e azionisti che hanno presentato i moduli 13D/G o 13F alla Securities Exchange Commission (SEC). Queste istituzioni detengono un totale di 104,459,286 azioni. I maggiori azionisti includono Fmr Llc, Ontario Teachers Pension Plan Board, Baillie Gifford & Co, Point72 Hong Kong Ltd, MIRAE ASSET GLOBAL ETFS HOLDINGS Ltd., Aspex Management (HK) Ltd, Exor Capital LLP, Point72 Asset Management, L.P., Morgan Stanley, and Tiger Global Management Llc .
(Pony AI Inc. - Depositary Receipt (Common Stock) (DUSE:08X) la struttura proprietaria istituzionale mostra le attuali posizioni nella società da parte di istituzioni e fondi, nonché le ultime variazioni nella dimensione della posizione. I principali azionisti possono essere singoli investitori, fondi comuni, hedge fund o istituzioni. L'allegato 13D indica che l'investitore detiene (o ha detenuto) più del 5% della società e intende (o intendeva) perseguire attivamente un cambiamento nella strategia aziendale. L'allegato 13G indica un investimento passivo superiore al 5%.
Indice del sentiment dei fondi
L'indice del sentiment dei fondi (anche noto come "indice di accumulo di proprietà") individua i titoli più acquistati dai fondi. È il risultato di un sofisticato modello quantitativo multi-fattore che identifica le società con i più alti livelli di accumulo istituzionale. Il modello utilizza una combinazione dell'aumento totale dei proprietari dichiarati, delle variazioni nelle allocazioni di portafoglio di tali proprietari e di altre metriche. Il punteggio varia da 0 a 100: i numeri più alti indicano un livello di accumulo superiore ad altre società, mentre 50 rappresenta la media.
Frequenza di aggiornamento: giornaliera
Consulta Ownership Explorer per visualizzare l'elenco delle aziende con il ranking più alto.
AI+ Ask Fintel’s AI assistant about Pony AI Inc. - Depositary Receipt (Common Stock).
Select a question to share a public post with an AI-crafted answer.
Thinking of good questions…
Depositi 13F e NPORT
Le informazioni relative ai depositi 13F sono gratuite. Per accedere alle informazioni relative ai depositi NP è necessario un'abbonamento premium. Le righe verdi indicano le nuove posizioni. Le righe rosse indicano le posizioni chiuse. Fai clic sull'icona del link per visualizzare la cronologia completa delle transazioni.
Esegui l'upgrade
per sbloccare i dati premium ed esportarli in Excel ![]() .
.
| Data di deposito | Fonte | Investitore | Tipo | Prezzo medio (Stima) |
Azioni | Δ Azioni (%) |
Valore dichiarato ($ 1000) |
Δ Valore (%) |
Allocazione del portafoglio (%) |
|
|---|---|---|---|---|---|---|---|---|---|---|
| 2026-02-12 | 13F | Marex Group plc | 566.871 | 8.220 | ||||||
| 2025-09-26 | NP | FBGRX - Fidelity Blue Chip Growth Fund This fund is a listed as child fund of Fmr Llc and if that institution has disclosed ownership in this security, then these positions will not be double counted when calculating total shares and total value | 1.921.873 | 49,95 | 25.830 | 121,71 | ||||
| 2026-02-11 | 13F | Group One Trading, L.p. | 21.705 | -73,32 | 315 | -82,83 | ||||
| 2025-11-14 | 13F | Yaupon Capital Management LP | 0 | -100,00 | 0 | -100,00 | ||||
| 2026-01-12 | 13F | Horizon Financial Services, Llc | 1.000 | 0,00 | 14 | -36,36 | ||||
| 2026-02-17 | 13F | Balyasny Asset Management Llc | Put | 250.000 | 0,00 | 3.625 | -35,52 | |||
| 2026-02-17 | 13F | Balyasny Asset Management Llc | 414.819 | 61,27 | 6.015 | 3,98 | ||||
| 2025-11-13 | 13F | Mission Creek Capital Partners, Inc. | 0 | -100,00 | 0 | |||||
| 2026-02-06 | 13F | EverSource Wealth Advisors, LLC | 0 | -100,00 | 0 | |||||
| 2025-09-23 | NP | MYINX - MainStay MacKay International Opportunities Fund Investor Class | 16.208 | 4,91 | 218 | 55,00 | ||||
| 2026-02-13 | 13F | Walleye Trading LLC | Put | 24.100 | -83,48 | 349 | -89,36 | |||
| 2026-02-17 | 13F | Lighthouse Investment Partners, LLC | 19.828 | -19,78 | 288 | -48,29 | ||||
| 2026-02-13 | 13F | Golden State Wealth Management, LLC | 100 | 0,00 | 1 | -50,00 | ||||
| 2026-02-13 | 13F | Walleye Trading LLC | Call | 176.400 | 51,03 | 2.558 | -2,63 | |||
| 2025-09-25 | NP | TLTE - FlexShares Morningstar Emerging Markets Factor Tilt Index Fund | 2.208 | 30 | ||||||
| 2026-02-17 | 13F | Cresset Asset Management, LLC | 102.991 | 2,49 | 1.493 | -33,94 | ||||
| 2026-02-13 | 13F | Rhumbline Advisers | 5 | 0 | ||||||
| 2026-02-17 | 13F | Cetera Investment Advisers | 25.019 | 111,74 | 363 | 36,60 | ||||
| 2026-02-17 | 13F | Tiger Global Management Llc | 2.900.000 | 683,78 | 42.050 | 405,35 | ||||
| 2025-10-15 | 13F | Cwm, Llc | 0 | -100,00 | 0 | |||||
| 2026-02-17 | 13F | Susquehanna International Group, Llp | 1.026.591 | 14.886 | ||||||
| 2025-09-26 | NP | PGJ - Invesco Golden Dragon China ETF This fund is a listed as child fund of Invesco Ltd. and if that institution has disclosed ownership in this security, then these positions will not be double counted when calculating total shares and total value | 15.399 | 207 | ||||||
| 2026-02-17 | 13F | Susquehanna International Group, Llp | Put | 216.600 | -53,65 | 3.141 | -70,12 | |||
| 2026-02-17 | 13F | Susquehanna International Group, Llp | Call | 210.200 | -92,91 | 3.048 | -95,43 | |||
| 2025-11-13 | 13F | MY.Alpha Management HK Advisors Ltd | 0 | -100,00 | 0 | |||||
| 2026-02-13 | 13F | Hel Ved Capital Management Ltd | 778.879 | 47,52 | 11.294 | -4,89 | ||||
| 2025-11-14 | 13F | Point72 (DIFC) Ltd | 0 | -100,00 | 0 | -100,00 | ||||
| 2026-02-17 | 13F | Millennium Management Llc | 687.817 | 9.973 | ||||||
| 2026-02-13 | 13F | Clear Street Group Inc. | 381.068 | 19,31 | 5.525 | -23,08 | ||||
| 2025-11-10 | 13F | Eleva Capital SAS | 68.462 | -13,10 | 1.540 | 48,12 | ||||
| 2026-01-30 | 13F | Delta Investment Management, LLC | 10.100 | 0,00 | 146 | -35,68 | ||||
| 2026-02-13 | 13F | Walleye Capital LLC | 51.020 | 740 | ||||||
| 2026-02-13 | 13F | Walleye Capital LLC | Call | 65.400 | -64,57 | 948 | -77,16 | |||
| 2026-01-21 | 13F | Sound Income Strategies, LLC | 300 | 5 | ||||||
| 2026-02-11 | 13F | Allianz Asset Management GmbH | 42.287 | 75,08 | 613 | 12,89 | ||||
| 2026-02-12 | 13F | Banco BTG Pactual S.A. | 0 | -100,00 | 0 | |||||
| 2026-02-12 | 13F | Principal Securities, Inc. | 0 | -100,00 | 0 | |||||
| 2026-02-17 | 13F | Symmetry Peak Management Llc | Call | 0 | -100,00 | 0 | ||||
| 2026-02-13 | 13F | Wexford Capital Lp | 98.627 | 2,74 | 1.430 | -33,77 | ||||
| 2026-02-13 | 13F | Walleye Capital LLC | Put | 39.000 | -84,57 | 566 | -90,06 | |||
| 2025-11-07 | 13F | Gf Fund Management Co. Ltd. | 0 | -100,00 | 0 | -100,00 | ||||
| 2025-11-04 | 13F | IMC-Chicago, LLC | 0 | -100,00 | 0 | -100,00 | ||||
| 2026-02-09 | 13F | Themes Management Co LLC | 25.101 | 364 | ||||||
| 2026-02-23 | 13F | Virtu Financial LLC | 50.738 | 92,03 | 1 | |||||
| 2025-09-26 | NP | BKEM - BNY Mellon Emerging Markets Equity ETF | 962 | -43,51 | 13 | -20,00 | ||||
| 2026-02-17 | 13F | D. E. Shaw & Co., Inc. | 54.586 | 29,46 | 791 | -16,56 | ||||
| 2026-02-11 | 13F | Havemeyer Place LP | 11.786 | 171 | ||||||
| 2026-02-13 | 13F | Y-Intercept (Hong Kong) Ltd | 23.787 | -94,37 | 345 | -96,38 | ||||
| 2026-02-13 | 13F | Keystone Investors Pte Ltd | 668.658 | 202,00 | 9.696 | 94,72 | ||||
| 2025-09-26 | NP | FPBFX - Fidelity Pacific Basin Fund This fund is a listed as child fund of Fmr Llc and if that institution has disclosed ownership in this security, then these positions will not be double counted when calculating total shares and total value | 333.056 | 89,56 | 4.476 | 180,28 | ||||
| 2026-02-11 | 13F | Krane Funds Advisors LLC | 35.568 | 516 | ||||||
| 2026-02-17 | 13F | Masters Capital Management Llc | Call | 750.000 | 10.875 | |||||
| 2026-02-17 | 13F | Masters Capital Management Llc | 1.200.000 | 20,00 | 17.400 | -22,63 | ||||
| 2026-02-06 | 13F | Handelsbanken Fonder AB | 13.700 | 0 | ||||||
| 2026-02-13 | 13F | Citigroup Inc | 193.128 | 73,03 | 2.800 | 11,55 | ||||
| 2026-01-30 | 13F | TMT General Partner Ltd | 1.917.414 | -39,20 | 27.803 | -60,80 | ||||
| 2026-02-17 | 13F | Point72 Asset Management, L.P. | 3.209.963 | 43,96 | 46.544 | -7,19 | ||||
| 2026-02-12 | 13F | AlphaCentric Advisors LLC | 25.000 | 362 | ||||||
| 2025-11-17 | 13F | Johns Hopkins University | 0 | -100,00 | 0 | -100,00 | ||||
| 2026-02-12 | 13F | Hrt Financial Lp | 47.353 | -91,48 | 1 | -100,00 | ||||
| 2025-11-14 | 13F | DRW Securities, LLC | Call | 0 | -100,00 | 0 | ||||
| 2026-02-13 | 13F | SC CHINA HOLDING Ltd | 0 | -100,00 | 0 | -100,00 | ||||
| 2026-02-17 | 13F | Capital Fund Management S.a. | Call | 55.900 | -72,89 | 811 | -82,53 | |||
| 2026-02-17 | 13F | Capital Fund Management S.a. | Put | 58.600 | -63,19 | 850 | -76,28 | |||
| 2026-02-13 | 13F | Hudson Bay Capital Management LP | 66.149 | -70,14 | 959 | -80,75 | ||||
| 2026-02-12 | 13F | BlackRock, Inc. | 3.801 | -91,00 | 55 | -94,21 | ||||
| 2026-02-10 | 13F | CIBC World Markets Inc. | 29.754 | -0,43 | 431 | -35,86 | ||||
| 2026-02-17 | 13F | Royal Bank Of Canada | 5.594 | -29,32 | 81 | -54,49 | ||||
| 2026-01-30 | 13F | Pekin Hardy Strauss, Inc. | 0 | -100,00 | 0 | -100,00 | ||||
| 2026-02-13 | 13F | Colony Group, LLC | 21.906 | -6,41 | 318 | -39,73 | ||||
| 2026-02-12 | 13F | Federation des caisses Desjardins du Quebec | 5.953 | -16,23 | 86 | -45,91 | ||||
| 2025-09-26 | NP | FBCG - Fidelity Blue Chip Growth ETF This fund is a listed as child fund of Fmr Llc and if that institution has disclosed ownership in this security, then these positions will not be double counted when calculating total shares and total value | 204.457 | 5,59 | 2.748 | 56,08 | ||||
| 2025-11-07 | 13F | Sierra Ocean, Llc | 0 | -100,00 | 0 | |||||
| 2026-02-10 | 13F | Goldman Sachs Group Inc | 242.724 | -69,24 | 3.519 | -80,17 | ||||
| 2026-01-23 | 13F | Assetmark, Inc | 64 | 72,97 | 1 | |||||
| 2025-11-14 | 13F | Strategic Wealth Partners, Ltd. | 124 | 3 | ||||||
| 2026-01-26 | 13F | Mirae Asset Global Investments Co., Ltd. | 898.409 | 7,37 | 13.027 | -30,78 | ||||
| 2026-02-12 | 13F | Lansforsakringar Fondforvaltning AB (publ) | 84.359 | 49,08 | 1.223 | -3,85 | ||||
| 2026-02-10 | 13F | Daiwa Securities Group Inc. | 4.561 | 2,26 | 0 | |||||
| 2025-11-14 | 13F | Peak6 Llc | 0 | -100,00 | 0 | -100,00 | ||||
| 2025-10-29 | 13F | HHM Wealth Advisors, LLC | 0 | -100,00 | 0 | |||||
| 2026-02-10 | 13F | Exor Capital LLP | 4.107.512 | 72,59 | 59.559 | 11,28 | ||||
| 2026-01-08 | 13F | Neumann Advisory Hong Kong Ltd | 0 | -100,00 | 0 | |||||
| 2026-02-13 | 13F | Pathstone Holdings, LLC | 31.338 | 454 | ||||||
| 2026-02-17 | 13F | Voloridge Investment Management, Llc | 0 | -100,00 | 0 | |||||
| 2026-02-12 | 13F | CIBC Private Wealth Group, LLC | 544 | 0,00 | 8 | -41,67 | ||||
| 2026-02-17 | 13F | Ghisallo Capital Management LLC | 0 | -100,00 | 0 | -100,00 | ||||
| 2025-09-29 | NP | EVAV - Direxion Daily Electric and Autonomous Vehicles Bull 2X Shares | 20.423 | 274 | ||||||
| 2026-02-17 | 13F | Bank Of America Corp /de/ | 296.720 | 553,58 | 4.302 | 321,35 | ||||
| 2026-02-17 | 13F | Quadrature Capital Ltd | 0 | -100,00 | 0 | |||||
| 2026-02-13 | 13F | Peak6 Llc | Call | 0 | -100,00 | 0 | ||||
| 2026-02-11 | 13F | Deutsche Bank Ag\ | 1.151 | 16,62 | 17 | -27,27 | ||||
| 2026-02-17 | 13F | SageView Advisory Group, LLC | 6 | 0 | ||||||
| 2025-11-14 | 13F | Common Fund For Nonprofit Organizations | 0 | -100,00 | 0 | |||||
| 2026-01-07 | 13F | Green Alpha Advisors, LLC | 42.708 | 619 | ||||||
| 2026-02-11 | 13F | LPL Financial LLC | 18.674 | 14,42 | 271 | -26,43 | ||||
| 2025-11-14 | 13F | Polymer Capital Management (US) LLC | Call | 0 | -100,00 | 0 | ||||
| 2026-02-09 | 13F | Harbour Investments, Inc. | 134 | 3,88 | 2 | -50,00 | ||||
| 2025-11-14 | 13F | Polymer Capital Management (US) LLC | 0 | -100,00 | 0 | |||||
| 2026-02-05 | 13F | Bank Julius Baer & Co. Ltd, Zurich | 54.000 | 783 | ||||||
| 2026-02-17 | 13F | Man Group plc | Call | 423.400 | 6.139 | |||||
| 2026-02-17 | 13F | Man Group plc | 148.161 | 168,23 | 2.148 | 72,95 | ||||
| 2026-02-10 | 13F | Bnp Paribas Arbitrage, Sa | 2.100 | 30 | ||||||
| 2025-11-14 | 13F | SRS Capital Advisors, Inc. | 0 | -100,00 | 0 | |||||
| 2026-02-13 | 13F | Verition Fund Management LLC | 915.346 | 13.273 | ||||||
| 2026-02-17 | 13F | Tudor Investment Corp Et Al | Call | 12.100 | 175 | |||||
| 2025-09-26 | NP | FBCGX - Fidelity Blue Chip Growth K6 Fund This fund is a listed as child fund of Fmr Llc and if that institution has disclosed ownership in this security, then these positions will not be double counted when calculating total shares and total value | 419.242 | 43,61 | 5.635 | 112,36 | ||||
| 2026-02-17 | 13F | Tudor Investment Corp Et Al | Put | 13.300 | 193 | |||||
| 2026-02-13 | 13F | Stifel Financial Corp | 83.334 | 1.208 | ||||||
| 2026-02-17 | 13F | D. E. Shaw & Co., Inc. | Put | 0 | -100,00 | 0 | ||||
| 2026-02-06 | 13F | Global Retirement Partners, LLC | 30 | 0 | ||||||
| 2026-02-06 | 13F | Profund Advisors Llc | 45.926 | 334,62 | 666 | 180,59 | ||||
| 2026-02-17 | 13F | D. E. Shaw & Co., Inc. | Call | 0 | -100,00 | 0 | ||||
| 2026-02-06 | 13F | Pnc Financial Services Group, Inc. | 130.000 | 333,33 | 1.885 | 179,67 | ||||
| 2026-02-06 | 13F | Leonteq Securities AG | 2.590 | 0,00 | 38 | -36,21 | ||||
| 2025-11-06 | 13F | Bp Plc | 0 | -100,00 | 0 | -100,00 | ||||
| 2026-02-13 | 13F | Toyota Motor Corp/ | 0 | -100,00 | 0 | -100,00 | ||||
| 2026-02-09 | 13F | Geode Capital Management, Llc | 11.318 | 0,00 | 164 | -35,43 | ||||
| 2026-02-17 | 13F | Advisor Group Holdings, Inc. | 5.649 | 19,63 | 82 | 12,50 | ||||
| 2026-02-13 | 13F | Carlyle Group Inc. | 2.362.447 | 0,00 | 34.255 | -35,53 | ||||
| 2026-01-14 | 13F | Nova Wealth Management, Inc. | 1 | 0,00 | 0 | |||||
| 2026-01-29 | 13F | UBS Group AG | Call | 75.000 | 219,15 | 1.088 | 105,87 | |||
| 2026-01-29 | 13F | UBS Group AG | 1.155.207 | -3,89 | 16.751 | -38,04 | ||||
| 2025-11-14 | 13F | Wolverine Trading, Llc | 77.343 | 128,36 | 1.757 | 280,30 | ||||
| 2025-11-14 | 13F | Wolverine Trading, Llc | Call | 183.100 | 52,71 | 4.160 | 154,12 | |||
| 2026-02-24 | 13F | Bell Investment Advisors, Inc | 38 | 0,00 | 1 | |||||
| 2025-11-14 | 13F | Wolverine Trading, Llc | Put | 144.000 | 48,61 | 3.272 | 147,24 | |||
| 2026-02-17 | 13F | XTX Topco Ltd | 0 | -100,00 | 0 | |||||
| 2026-02-06 | 13F | IFP Advisors, Inc | 6.051 | 784,65 | 88 | 480,00 | ||||
| 2026-02-11 | 13F | Nikko Asset Management Americas, Inc. | 1.974.499 | 28.630 | ||||||
| 2026-02-17 | 13F | Tower Research Capital LLC (TRC) | 3.331 | -52,44 | 48 | -69,43 | ||||
| 2026-02-17 | 13F | Shay Capital LLC | 20.000 | 290 | ||||||
| 2026-02-17 | 13F | Weiss Asset Management LP | 0 | -100,00 | 0 | -100,00 | ||||
| 2026-01-23 | 13F | Baillie Gifford & Co | 6.301.650 | -2,46 | 91.374 | -37,11 | ||||
| 2026-02-17 | 13F | BlueCrest Capital Management Ltd | Call | 0 | -100,00 | 0 | -100,00 | |||
| 2026-02-17 | 13F | FIL Ltd | 2.284.012 | 466,92 | 33.118 | 265,54 | ||||
| 2026-02-13 | 13F | Kestra Advisory Services, LLC | 5.151 | 75 | ||||||
| 2025-11-14 | 13F | Prudential Plc | 0 | -100,00 | 0 | -100,00 | ||||
| 2026-02-17 | 13F | Bamco Inc /ny/ | 2.586.581 | 10,76 | 37.505 | -28,59 | ||||
| 2026-02-13 | 13F | Ontario Teachers Pension Plan Board | 6.492.530 | 0,00 | 94.142 | -35,53 | ||||
| 2026-02-13 | 13F | Bridgefront Capital, LLC | 11.277 | 164 | ||||||
| 2025-10-21 | 13F | Tradewinds Capital Management, LLC | 0 | -100,00 | 0 | |||||
| 2026-02-13 | 13F | Centiva Capital, LP | 0 | -100,00 | 0 | -100,00 | ||||
| 2026-01-15 | 13F | Affinity Wealth Management Llc | 0 | -100,00 | 0 | |||||
| 2026-02-17 | 13F | Covalis Capital Llp | 0 | -100,00 | 0 | |||||
| 2026-02-13 | 13F | Marshall Wace, Llp | 2.502.711 | 36.289 | ||||||
| 2026-02-13 | 13F | Aspex Management (HK) Ltd | 4.140.447 | 0,00 | 60 | -35,48 | ||||
| 2026-02-13 | 13F | Eschler Asset Management LLP | 34.700 | -23,23 | 503 | -50,49 | ||||
| 2026-02-13 | 13F | Barclays Plc | Put | 0 | -100,00 | 0 | -100,00 | |||
| 2026-01-27 | 13F | Zurcher Kantonalbank (Zurich Cantonalbank) | 628 | 9 | ||||||
| 2026-02-17 | 13F | Flight Deck Capital, LP | 853.900 | 26,96 | 12.382 | -18,15 | ||||
| 2026-02-17 | 13F | Schonfeld Strategic Advisors LLC | 533.945 | 1.150,75 | 7.742 | 706,46 | ||||
| 2025-11-12 | 13F | HAP Trading, LLC | Call | 15.500 | 25 | |||||
| 2026-02-13 | 13F | IDG China Capital Fund III Associates L.P. | 0 | -100,00 | 0 | -100,00 | ||||
| 2025-09-26 | NP | FSBDX - Fidelity Series Blue Chip Growth Fund This fund is a listed as child fund of Fmr Llc and if that institution has disclosed ownership in this security, then these positions will not be double counted when calculating total shares and total value | 337.700 | 47,66 | 4.539 | 118,38 | ||||
| 2026-02-17 | 13F | Nomura Holdings Inc | 66.940 | 426,92 | 971 | 240,35 | ||||
| 2026-01-23 | 13F | Farther Finance Advisors, LLC | 380 | 406,67 | 6 | 400,00 | ||||
| 2025-10-24 | 13F | JGP Global Gestao de Recursos Ltda. | 0 | -100,00 | 0 | |||||
| 2025-11-12 | 13F | Erste Asset Management GmbH | 6 | 280 | ||||||
| 2026-02-06 | 13F | Carrhae Capital LLP | 0 | -100,00 | 0 | |||||
| 2026-02-17 | 13F | Temasek Holdings (Private) Ltd | 14.510 | 0,00 | 210 | -35,58 | ||||
| 2025-11-14 | 13F | Luminist Capital LLC | 0 | -100,00 | 0 | -100,00 | ||||
| 2026-02-17 | 13F | Scientech Research LLC | 0 | -100,00 | 0 | |||||
| 2026-02-17 | 13F | Ameriprise Financial Inc | 10.831 | -1,43 | 157 | -36,44 | ||||
| 2026-02-17 | 13F | Citadel Advisors Llc | Put | 456.200 | -52,89 | 6.615 | -69,63 | |||
| 2026-02-17 | 13F | Citadel Advisors Llc | Call | 345.700 | -69,16 | 5.013 | -80,12 | |||
| 2026-02-17 | 13F | Legend Capital Advisors LLC | 21.980 | 319 | ||||||
| 2026-02-17 | 13F | Wellington Management Group Llp | 2.840.863 | 30,96 | 41.193 | -15,57 | ||||
| 2026-02-17 | 13F | Citadel Advisors Llc | 2.607.874 | 14,08 | 37.814 | -26,45 | ||||
| 2026-02-13 | 13F | National Bank Of Canada /fi/ | 0 | -100,00 | 0 | |||||
| 2026-02-03 | 13F | SBI Securities Co., Ltd. | 19.127 | -3,76 | 277 | -37,89 | ||||
| 2026-02-17 | 13F | Two Sigma Investments, Lp | 0 | -100,00 | 0 | |||||
| 2026-02-12 | 13F | Ci Investments Inc. | 0 | -100,00 | 0 | |||||
| 2026-02-17 | 13F | Alliancebernstein L.p. | 218.737 | 40,33 | 3.172 | -9,53 | ||||
| 2026-02-13 | 13F | Toroso Investments, LLC | Put | 0 | -100,00 | 0 | -100,00 | |||
| 2026-02-13 | 13F | Toroso Investments, LLC | 0 | -100,00 | 0 | -100,00 | ||||
| 2025-09-29 | NP | TRFM - AAM Transformers ETF | 0 | -100,00 | 0 | -100,00 | ||||
| 2026-02-17 | 13F | Cantor Fitzgerald, L. P. | 0 | -100,00 | 0 | |||||
| 2026-02-17 | 13F | Mubadala Investment Co PJSC | 0 | -100,00 | 0 | -100,00 | ||||
| 2026-01-09 | 13F | SG Americas Securities, LLC | 543.825 | 10.441,29 | 8 | |||||
| 2026-02-13 | 13F | Schroder Investment Management Group | 152.420 | 9,78 | 2.210 | -29,21 | ||||
| 2026-02-03 | 13F | Mitsubishi UFJ Kokusai Asset Management Co., Ltd. | 142.282 | 24,28 | 2.286 | -11,19 | ||||
| 2026-02-13 | 13F | Caitong International Asset Management Co., Ltd | 0 | -100,00 | 0 | -100,00 | ||||
| 2026-02-06 | 13F | Banque Cantonale Vaudoise | 2.741 | -25,15 | 40 | |||||
| 2026-02-10 | 13F | Quantbot Technologies LP | 5.493 | 80 | ||||||
| 2026-02-13 | 13F | Barclays Plc | 8.809 | -96,84 | 128 | -97,97 | ||||
| 2026-02-04 | 13F | Money Concepts Capital Corp | 93.546 | 2,05 | 1.356 | -34,21 | ||||
| 2026-02-09 | 13F | Legal & General Group Plc | 158.430 | 14,57 | 2.297 | -26,12 | ||||
| 2026-02-13 | 13F | Ubs Oconnor Llc | 0 | -100,00 | 0 | -100,00 | ||||
| 2025-11-14 | 13F | Cubist Systematic Strategies, LLC | 167.997 | 3.778 | ||||||
| 2026-01-16 | 13F | FNY Investment Advisers, LLC | 0 | -100,00 | 0 | |||||
| 2025-11-14 | 13F | Point72 Hong Kong Ltd | 5.522.833 | 124.208 | ||||||
| 2026-02-13 | 13F | State Street Corp | 463.546 | -33,13 | 6.721 | -56,89 | ||||
| 2025-11-14 | 13F | Raymond James Financial Inc | 0 | -100,00 | 0 | |||||
| 2026-02-17 | 13F | MIRAE ASSET GLOBAL ETFS HOLDINGS Ltd. | 4.232.995 | 6,76 | 61.382 | -31,17 | ||||
| 2026-02-17 | 13F | Fmr Llc | 17.615.617 | 6,97 | 255.426 | -31,03 | ||||
| 2026-02-17 | 13F | Price T Rowe Associates Inc /md/ | 30.114 | -17,86 | 0 | |||||
| 2026-02-13 | 13F | Ubs Asset Management Americas Inc | 175.035 | 2.538 | ||||||
| 2025-09-17 | NP | NWXSX - Nationwide International Small Cap Fund Class A | 14.653 | -31,42 | 197 | 1,03 | ||||
| 2026-02-13 | 13F | Intercapital, Llc | 76.400 | 1.108 | ||||||
| 2026-02-12 | 13F | Jane Street Group, Llc | 2.004.782 | -2,81 | 29.069 | -37,34 | ||||
| 2026-02-12 | 13F | Jane Street Group, Llc | Call | 196.200 | -69,76 | 2.845 | -80,51 | |||
| 2026-01-26 | 13F | Provenance Wealth Advisors, LLC | 6.168 | -15,66 | 89 | -45,73 | ||||
| 2026-02-17 | 13F | Armistice Capital, Llc | 468.000 | 87,73 | 6.786 | 21,05 | ||||
| 2026-02-05 | 13F | Baader Bank INC | 229.732 | 0,67 | 3.330 | -34,56 | ||||
| 2026-02-11 | 13F | Jpmorgan Chase & Co | 19.881 | 842,23 | 288 | 512,77 | ||||
| 2026-02-12 | 13F | Jane Street Group, Llc | Put | 541.100 | -44,34 | 7.846 | -64,12 | |||
| 2026-02-19 | 13F | Invesco Ltd. | 68.152 | 340,88 | 988 | 184,73 | ||||
| 2026-02-13 | 13F | First Trust Advisors Lp | 10.028 | -8,74 | 145 | -41,30 | ||||
| 2026-02-06 | 13F | Larson Financial Group LLC | 100 | 0,00 | 1 | -50,00 | ||||
| 2026-02-13 | 13F | Platinum Investment Management Ltd | 16.552 | 240 | ||||||
| 2025-09-25 | NP | AGRFX - AB Growth Fund Class A | 332.847 | -27,13 | 4.473 | 7,73 | ||||
| 2026-02-17 | 13F | Jones Financial Companies Lllp | 2.171 | -1,18 | 31 | -32,61 | ||||
| 2026-02-13 | 13F | Soros Fund Management Llc | Call | 1.000.000 | 14.500 | |||||
| 2026-02-17 | 13F | Evergreen Quality Fund GP, Ltd. | 100.000 | 0,00 | 1.450 | -35,53 | ||||
| 2026-01-23 | 13F | Sumitomo Mitsui Trust Holdings, Inc. | 1.974.499 | 266,23 | 28.630 | 136,12 | ||||
| 2026-02-10 | 13F | Hershey Trust Co | 0 | -100,00 | 0 | |||||
| 2026-02-13 | 13F | Soros Fund Management Llc | 1.231.714 | -40,75 | 17.860 | -61,80 | ||||
| 2026-02-17 | 13F | Capital Fund Management S.a. | 378.529 | -1,95 | 5.489 | -36,79 | ||||
| 2025-09-26 | NP | FEMSX - Fidelity Series Emerging Markets Opportunities Fund This fund is a listed as child fund of Fmr Llc and if that institution has disclosed ownership in this security, then these positions will not be double counted when calculating total shares and total value | 2.512.608 | 61,76 | 33.769 | 139,17 | ||||
| 2026-02-13 | 13F | Wells Fargo & Company/mn | 14.515 | -80,06 | 210 | -87,17 | ||||
| 2026-01-29 | 13F | Renaissance Capital LLC | 16.881 | -49,89 | 245 | -67,77 | ||||
| 2026-02-11 | 13F | Simplex Trading, Llc | 86.008 | 1.247 | ||||||
| 2026-02-13 | 13F | IDG China Venture Capital Fund IV Associates L.P. | 2.216.250 | -76,14 | 32.136 | -84,62 | ||||
| 2026-02-13 | 13F | Tairen Capital Ltd | 15.760 | 229 | ||||||
| 2026-02-12 | 13F | M&G Plc | 444.157 | 6.662 | ||||||
| 2026-01-20 | 13F | Signaturefd, Llc | 0 | -100,00 | 0 | |||||
| 2026-02-11 | 13F | ARK Investment Management LLC | 1.651.452 | 29,76 | 23.946 | -16,34 | ||||
| 2026-02-13 | 13F | Morgan Stanley | 3.024.346 | -8,64 | 43.853 | -41,10 | ||||
| 2026-02-13 | 13F | Hudson Bay Capital Management LP | Call | 2.000 | 29 | |||||
| 2026-02-17 | 13F | Yiheng Capital Management, L.P. | 653.215 | 226,12 | 9.472 | 110,28 | ||||
| 2026-01-29 | 13F | Calamos Advisors LLC | 20.820 | 44,58 | 302 | -6,81 | ||||
| 2025-11-03 | 13F | Washington University | 0 | -100,00 | 0 | -100,00 | ||||
| 2026-02-10 | 13F | Yunqi Capital Ltd | 415.000 | 6.018 | ||||||
| 2026-01-22 | 13F | Financial Consulate, Inc | 100 | 1 | ||||||
| 2026-02-13 | 13F | Manufacturers Life Insurance Company, The | 0 | -100,00 | 0 | -100,00 | ||||
| 2026-02-13 | 13F | Squarepoint Ops LLC | 45.277 | -48,98 | 657 | -67,12 | ||||
| 2026-02-13 | 13F | Ieq Capital, Llc | 23.929 | 94,54 | 347 | 25,36 | ||||
| 2025-11-14 | 13F | Point72 Europe (London) LLP | 0 | -100,00 | 0 | -100,00 | ||||
| 2026-02-11 | 13F | Gordian Capital Singapore Pte Ltd | 1.100 | 1.000,00 | 16 | 650,00 | ||||
| 2026-02-17 | 13F | Electron Capital Partners, LLC | 50.076 | 726 | ||||||
| 2026-02-17 | 13F | Old Mission Capital Llc | 386.835 | 5.609 | ||||||
| 2026-02-17 | 13F | Advisory Services Network, LLC | 0 | -100,00 | 0 | |||||
| 2026-01-15 | 13F | J. Safra Sarasin Holding AG | 0 | -100,00 | 0 | |||||
| 2026-02-13 | 13F | Rafferty Asset Management, LLC | 21.266 | 308 |
Other Listings
| US:PONY | 12,48 USD |