Statistiche di base
| Proprietari istituzionali | 46 total, 46 long only, 0 short only, 0 long/short - change of 6,98% MRQ |
| Allocazione media del portafoglio | 0.1938 % - change of -5,28% MRQ |
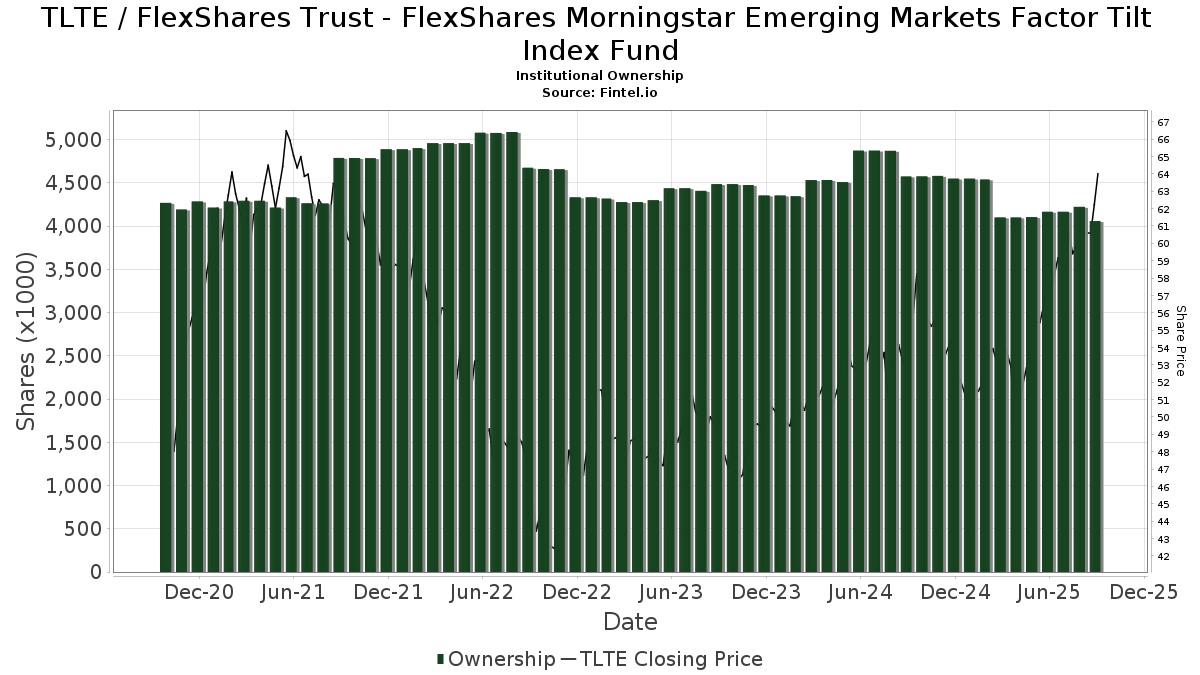
| Azioni istituzionali (Long) | 4.053.340 (ex 13D/G) - change of -0,11MM shares -2,72% MRQ |
| Valore istituzionale (Long) | $ 229.969 USD ($1000) |
Proprietà istituzionale e azionisti
FlexShares Trust - FlexShares Morningstar Emerging Markets Factor Tilt Index Fund (US:TLTE) ha 46 proprietari istituzionali e azionisti che hanno presentato i moduli 13D/G o 13F alla Securities Exchange Commission (SEC). Queste istituzioni detengono un totale di 4,053,340 azioni. I maggiori azionisti includono Northern Trust Corp, Envestnet Asset Management Inc, Jane Street Group, Llc, Sageworth Trust Co, BBALX - Northern Global Tactical Asset Allocation Fund, Mml Investors Services, Llc, Flow Traders U.s. Llc, Citadel Advisors Llc, State Of Wisconsin Investment Board, and Asset Dedication, LLC .
(FlexShares Trust - FlexShares Morningstar Emerging Markets Factor Tilt Index Fund (ARCA:TLTE) la struttura proprietaria istituzionale mostra le attuali posizioni nella società da parte di istituzioni e fondi, nonché le ultime variazioni nella dimensione della posizione. I principali azionisti possono essere singoli investitori, fondi comuni, hedge fund o istituzioni. L'allegato 13D indica che l'investitore detiene (o ha detenuto) più del 5% della società e intende (o intendeva) perseguire attivamente un cambiamento nella strategia aziendale. L'allegato 13G indica un investimento passivo superiore al 5%.
The share price as of September 5, 2025 is 61,02 / share. Previously, on September 9, 2024, the share price was 52,86 / share. This represents an increase of 15,44% over that period.
Indice del sentiment dei fondi
L'indice del sentiment dei fondi (anche noto come "indice di accumulo di proprietà") individua i titoli più acquistati dai fondi. È il risultato di un sofisticato modello quantitativo multi-fattore che identifica le società con i più alti livelli di accumulo istituzionale. Il modello utilizza una combinazione dell'aumento totale dei proprietari dichiarati, delle variazioni nelle allocazioni di portafoglio di tali proprietari e di altre metriche. Il punteggio varia da 0 a 100: i numeri più alti indicano un livello di accumulo superiore ad altre società, mentre 50 rappresenta la media.
Frequenza di aggiornamento: giornaliera
Consulta Ownership Explorer per visualizzare l'elenco delle aziende con il ranking più alto.
Rapporto put/call istituzionale
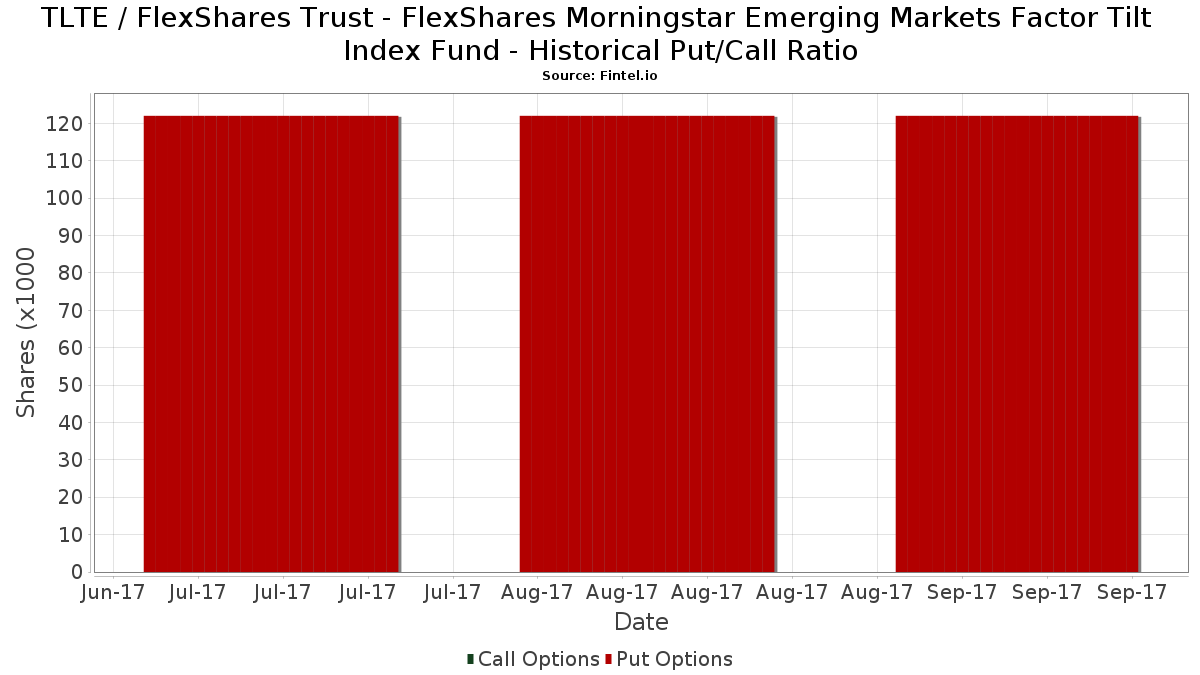
Oltre a segnalare le emissioni standard di titoli azionari e di debito, gli istituti con più di 100 milioni di asset in gestione devono anche dichiarare le loro partecipazioni in opzioni put e call. Poiché le opzioni put indicano generalmente un sentiment negativo e le opzioni call un sentiment positivo, possiamo avere un'idea del sentiment istituzionale complessivo attraverso il rapporto tra put e call. Il grafico a destra mostra il rapporto storico put/call per questo strumento.
L'utilizzo del rapporto put/call come indicatore del sentiment degli investitori consente di superare una delle principali lacune dell'utilizzo della proprietà istituzionale totale, ovvero il fatto che una quantità significativa di asset in gestione viene investita passivamente per seguire gli indici. Generalmente, i fondi a gestione passiva non acquistano opzioni, per cui il rapporto put/call riflette più fedelmente il sentiment dei fondi a gestione attiva.
Depositi 13F e NPORT
Le informazioni relative ai depositi 13F sono gratuite. Per accedere alle informazioni relative ai depositi NP è necessario un'abbonamento premium. Le righe verdi indicano le nuove posizioni. Le righe rosse indicano le posizioni chiuse. Fai clic sull'icona del link per visualizzare la cronologia completa delle transazioni.
Esegui l'upgrade
per sbloccare i dati premium ed esportarli in Excel ![]() .
.
| Data di deposito | Fonte | Investitore | Tipo | Prezzo medio (Stima) |
Azioni | Δ Azioni (%) |
Valore dichiarato ($ 1000) |
Δ Valore (%) |
Allocazione del portafoglio (%) |
|
|---|---|---|---|---|---|---|---|---|---|---|
| 2025-09-04 | 13F/A | Advisor Group Holdings, Inc. | 4.093 | -16,96 | 240 | -6,98 | ||||
| 2025-08-01 | 13F | Envestnet Asset Management Inc | 202.924 | -13,62 | 11.898 | -3,52 | ||||
| 2025-07-31 | 13F | Hanlon Investment Management, Inc. | 6.008 | -23,43 | 352 | -14,36 | ||||
| 2025-08-08 | 13F | Larson Financial Group LLC | 384 | 0,00 | 23 | 10,00 | ||||
| 2025-08-13 | 13F | Jones Financial Companies Lllp | 29 | 0,00 | 2 | 0,00 | ||||
| 2025-07-17 | 13F | Sound Income Strategies, LLC | 5 | 0,00 | 0 | |||||
| 2025-07-11 | 13F | First PREMIER Bank | 9.667 | 0,00 | 1 | |||||
| 2025-08-14 | 13F | UBS Group AG | 3.173 | 107,79 | 186 | 132,50 | ||||
| 2025-08-14 | 13F | Old Mission Capital Llc | 8.416 | 73,67 | 493 | 94,09 | ||||
| 2025-07-28 | 13F | Elmwood Wealth Management, Inc. | 0 | -100,00 | 0 | |||||
| 2025-08-14 | 13F | AllSquare Wealth Management LLC | 284 | 0,00 | 17 | 14,29 | ||||
| 2025-08-14 | 13F | Raymond James Financial Inc | 1.937 | 114 | ||||||
| 2025-07-30 | 13F | Eqis Capital Management, Inc. | 6.053 | -8,68 | 355 | 2,02 | ||||
| 2025-08-14 | 13F | Trace Wealth Advisors, LLC | 24.403 | -0,66 | 1.431 | 10,94 | ||||
| 2025-08-14 | 13F | Susquehanna International Group, Llp | 14.249 | -9,81 | 835 | 0,72 | ||||
| 2025-08-07 | 13F | Allworth Financial LP | 1.040 | 0,00 | 61 | 11,11 | ||||
| 2025-08-04 | 13F | Creative Financial Designs Inc /adv | 15 | 1 | ||||||
| 2025-08-14 | 13F | Bank Of America Corp /de/ | 0 | -100,00 | 0 | |||||
| 2025-07-07 | 13F | Discipline Wealth Solutions, LLC | 6.735 | 395 | ||||||
| 2025-08-14 | 13F | Jane Street Group, Llc | 111.756 | 925,19 | 6.552 | 1.045,45 | ||||
| 2025-08-14 | 13F | Citadel Advisors Llc | 43.339 | 2.541 | ||||||
| 2025-07-28 | 13F | Harbour Investments, Inc. | 241 | 0,00 | 14 | 16,67 | ||||
| 2025-07-25 | 13F | Wealth Architects, LLC | 14.451 | -5,73 | 847 | 5,35 | ||||
| 2025-08-14 | 13F | State Of Wisconsin Investment Board | 33.057 | 0,00 | 1.938 | 11,70 | ||||
| 2025-08-14 | 13F | Comerica Bank | 848 | -56,76 | 50 | -51,96 | ||||
| 2025-07-21 | 13F | Sageworth Trust Co | 104.643 | 6.135 | ||||||
| 2025-08-13 | 13F | Northern Trust Corp | 3.136.681 | -9,70 | 183.908 | 0,86 | ||||
| 2025-08-15 | 13F | Kestra Advisory Services, LLC | 4.205 | -19,97 | 247 | -10,55 | ||||
| 2025-08-06 | 13F | Commonwealth Equity Services, Llc | 17.408 | -8,12 | 1 | |||||
| 2025-07-24 | 13F | IFP Advisors, Inc | 1.272 | 0,00 | 75 | 12,12 | ||||
| 2025-08-14 | 13F | CoreCap Advisors, LLC | 1.281 | -15,78 | 75 | -5,06 | ||||
| 2025-08-15 | 13F | Morgan Stanley | 16.289 | 2,62 | 955 | 14,65 | ||||
| 2025-08-12 | 13F | LPL Financial LLC | 7.024 | -14,65 | 412 | -4,86 | ||||
| 2025-07-29 | 13F | Wealthstream Advisors, Inc. | 17.078 | 0,00 | 1.001 | 11,72 | ||||
| 2025-08-05 | 13F | Bank of New York Mellon Corp | 11.250 | -0,01 | 660 | 11,69 | ||||
| 2025-08-05 | 13F | Cherry Tree Wealth Management, LLC | 883 | 0,00 | 52 | 10,87 | ||||
| 2025-08-12 | 13F | Proequities, Inc. | 0 | 0 | ||||||
| 2025-08-19 | 13F | Asset Dedication, LLC | 25.127 | -0,24 | 1.473 | 11,42 | ||||
| 2025-07-16 | 13F | ORG Partners LLC | 0 | -100,00 | 0 | |||||
| 2025-07-23 | 13F | Nbt Bank N A /ny | 1.112 | 0,00 | 65 | 12,07 | ||||
| 2025-08-07 | 13F | Efficient Advisors, LLC | 9.276 | -52,75 | 544 | -47,28 | ||||
| 2025-08-13 | 13F | Flow Traders U.s. Llc | 44.341 | 3 | ||||||
| 2025-08-08 | 13F | Hartland & Co., LLC | 1.375 | 0,00 | 81 | 11,11 | ||||
| 2025-08-26 | NP | BBALX - Northern Global Tactical Asset Allocation Fund | 84.602 | -8,14 | 4.960 | 2,61 | ||||
| 2025-08-14 | 13F | Wells Fargo & Company/mn | 814 | 81.300,00 | 48 | |||||
| 2025-08-11 | 13F | Cornerstone Planning Group LLC | 193 | 0,00 | 11 | 22,22 | ||||
| 2025-08-14 | 13F | Mml Investors Services, Llc | 59.372 | -8,66 | 3 | 0,00 | ||||
| 2025-08-14 | 13F | Marquette Associates, Inc. | 233 | -28,75 | 14 | -23,53 | ||||
| 2025-08-12 | 13F | Bokf, Na | 2.932 | 172 | ||||||
| 2025-08-05 | 13F | Bank Of Montreal /can/ | 0 | -100,00 | 0 | |||||
| 2025-08-08 | 13F | Cetera Investment Advisers | 12.842 | -4,89 | 753 | 6,21 |