Statistiche di base
| Proprietari istituzionali | 112 total, 108 long only, 0 short only, 4 long/short - change of 0,00% MRQ |
| Allocazione media del portafoglio | 0.0202 % - change of -21,07% MRQ |
| Azioni istituzionali (Long) | 17.382.945 (ex 13D/G) - change of 1,08MM shares 6,61% MRQ |
| Valore istituzionale (Long) | $ 75.419 USD ($1000) |
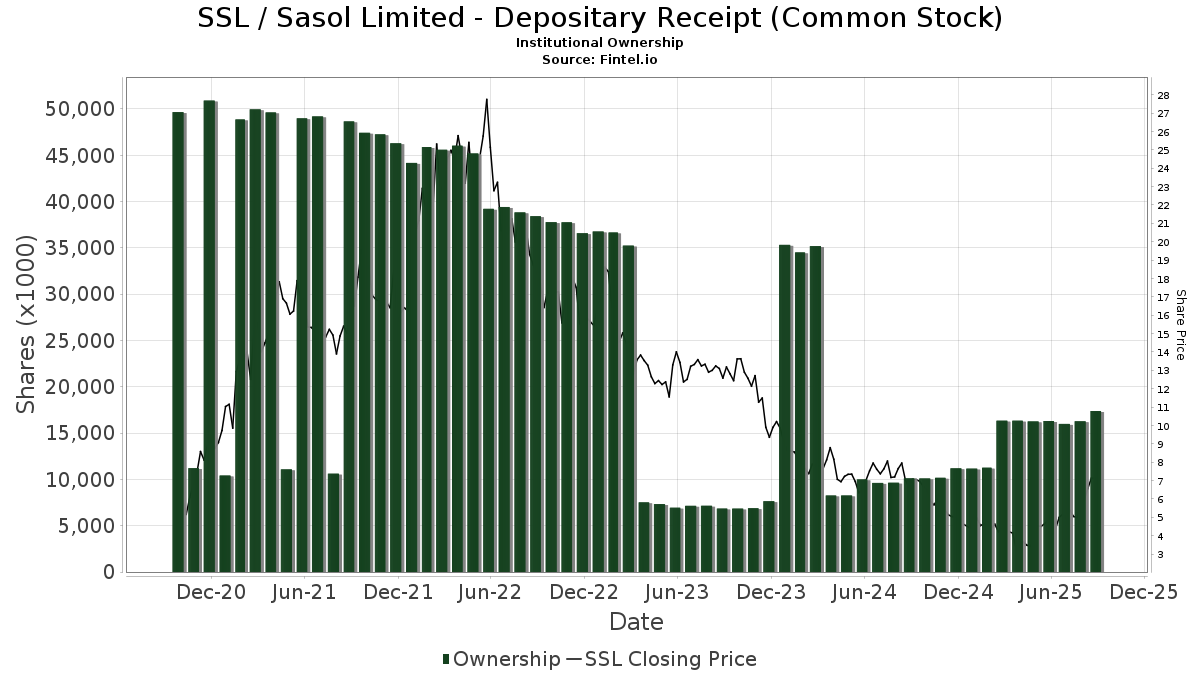
Proprietà istituzionale e azionisti
Sasol Limited - Depositary Receipt (Common Stock) (US:SSL) ha 112 proprietari istituzionali e azionisti che hanno presentato i moduli 13D/G o 13F alla Securities Exchange Commission (SEC). Queste istituzioni detengono un totale di 17,382,945 azioni. I maggiori azionisti includono Morgan Stanley, BlackRock, Inc., Two Sigma Investments, Lp, Two Sigma Advisers, Lp, American Century Companies Inc, Goldman Sachs Group Inc, Connor, Clark & Lunn Investment Management Ltd., AVEM - Avantis Emerging Markets Equity ETF, Dimensional Fund Advisors Lp, and UBS Group AG .
(Sasol Limited - Depositary Receipt (Common Stock) (NYSE:SSL) la struttura proprietaria istituzionale mostra le attuali posizioni nella società da parte di istituzioni e fondi, nonché le ultime variazioni nella dimensione della posizione. I principali azionisti possono essere singoli investitori, fondi comuni, hedge fund o istituzioni. L'allegato 13D indica che l'investitore detiene (o ha detenuto) più del 5% della società e intende (o intendeva) perseguire attivamente un cambiamento nella strategia aziendale. L'allegato 13G indica un investimento passivo superiore al 5%.
The share price as of September 5, 2025 is 7,09 / share. Previously, on September 9, 2024, the share price was 7,00 / share. This represents an increase of 1,29% over that period.
Indice del sentiment dei fondi
L'indice del sentiment dei fondi (anche noto come "indice di accumulo di proprietà") individua i titoli più acquistati dai fondi. È il risultato di un sofisticato modello quantitativo multi-fattore che identifica le società con i più alti livelli di accumulo istituzionale. Il modello utilizza una combinazione dell'aumento totale dei proprietari dichiarati, delle variazioni nelle allocazioni di portafoglio di tali proprietari e di altre metriche. Il punteggio varia da 0 a 100: i numeri più alti indicano un livello di accumulo superiore ad altre società, mentre 50 rappresenta la media.
Frequenza di aggiornamento: giornaliera
Consulta Ownership Explorer per visualizzare l'elenco delle aziende con il ranking più alto.
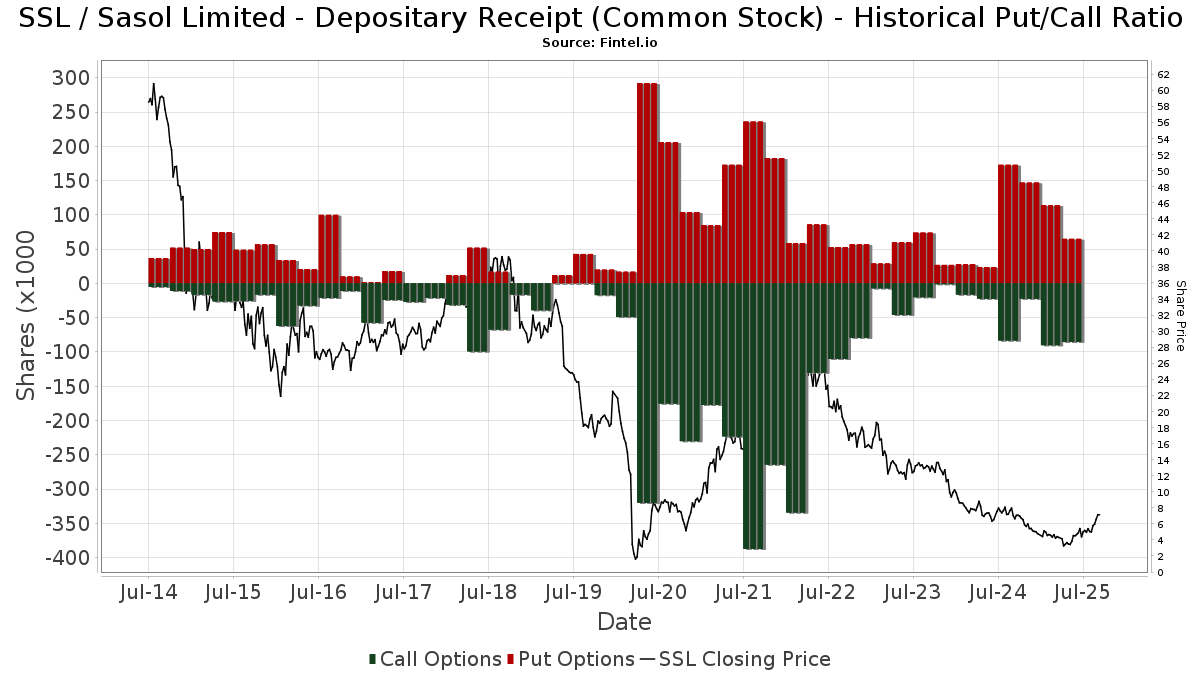
Rapporto put/call istituzionale
Oltre a segnalare le emissioni standard di titoli azionari e di debito, gli istituti con più di 100 milioni di asset in gestione devono anche dichiarare le loro partecipazioni in opzioni put e call. Poiché le opzioni put indicano generalmente un sentiment negativo e le opzioni call un sentiment positivo, possiamo avere un'idea del sentiment istituzionale complessivo attraverso il rapporto tra put e call. Il grafico a destra mostra il rapporto storico put/call per questo strumento.
L'utilizzo del rapporto put/call come indicatore del sentiment degli investitori consente di superare una delle principali lacune dell'utilizzo della proprietà istituzionale totale, ovvero il fatto che una quantità significativa di asset in gestione viene investita passivamente per seguire gli indici. Generalmente, i fondi a gestione passiva non acquistano opzioni, per cui il rapporto put/call riflette più fedelmente il sentiment dei fondi a gestione attiva.
Depositi 13F e NPORT
Le informazioni relative ai depositi 13F sono gratuite. Per accedere alle informazioni relative ai depositi NP è necessario un'abbonamento premium. Le righe verdi indicano le nuove posizioni. Le righe rosse indicano le posizioni chiuse. Fai clic sull'icona del link per visualizzare la cronologia completa delle transazioni.
Esegui l'upgrade
per sbloccare i dati premium ed esportarli in Excel ![]() .
.
| Data di deposito | Fonte | Investitore | Tipo | Prezzo medio (Stima) |
Azioni | Δ Azioni (%) |
Valore dichiarato ($ 1000) |
Δ Valore (%) |
Allocazione del portafoglio (%) |
|
|---|---|---|---|---|---|---|---|---|---|---|
| 2025-07-28 | NP | AVEEX - Avantis Emerging Markets Equity Fund Institutional Class This fund is a listed as child fund of American Century Companies Inc and if that institution has disclosed ownership in this security, then these positions will not be double counted when calculating total shares and total value | 26.634 | 0,00 | 118 | 1,72 | ||||
| 2025-06-26 | NP | DFA INVESTMENT DIMENSIONS GROUP INC - World ex U.S. Core Equity Portfolio Institutional Class Shares | 20.702 | 0,00 | 72 | -25,77 | ||||
| 2025-08-06 | 13F | Savant Capital, LLC | 36.116 | 160 | ||||||
| 2025-08-14 | 13F | Raymond James Financial Inc | 9.484 | -20,33 | 42 | -18,00 | ||||
| 2025-07-08 | 13F | Parallel Advisors, LLC | 17.169 | 119,86 | 76 | 127,27 | ||||
| 2025-08-08 | 13F | Abc Arbitrage Sa | 188.436 | 833 | ||||||
| 2025-08-14 | 13F | Evergreen Capital Management Llc | 23.166 | 102 | ||||||
| 2025-05-05 | 13F | Lindbrook Capital, Llc | 3.168 | -55,96 | 13 | -59,37 | ||||
| 2025-08-14 | 13F | UBS Group AG | 631.731 | -14,31 | 2.792 | -10,46 | ||||
| 2025-08-12 | 13F | XTX Topco Ltd | 0 | -100,00 | 0 | |||||
| 2025-08-13 | 13F | Guggenheim Capital Llc | 19.861 | -5,68 | 88 | -2,25 | ||||
| 2025-04-30 | 13F | Nisa Investment Advisors, Llc | 0 | -100,00 | 0 | |||||
| 2025-08-14 | 13F | Royal Bank Of Canada | 15.936 | -8,13 | 71 | -2,74 | ||||
| 2025-05-15 | 13F | Pinnacle Wealth Planning Services, Inc. | 0 | -100,00 | 0 | |||||
| 2025-08-12 | 13F | Jpmorgan Chase & Co | 59.395 | 7.081,98 | 263 | 8.633,33 | ||||
| 2025-07-25 | 13F | Cwm, Llc | 1.727 | -69,44 | 0 | |||||
| 2025-08-14 | 13F | Two Sigma Securities, Llc | 0 | -100,00 | 0 | |||||
| 2025-07-28 | NP | AVEM - Avantis Emerging Markets Equity ETF This fund is a listed as child fund of American Century Companies Inc and if that institution has disclosed ownership in this security, then these positions will not be double counted when calculating total shares and total value | 735.074 | 26,23 | 3.264 | 28,26 | ||||
| 2025-08-14 | 13F | Bnp Paribas Arbitrage, Sa | 221.995 | 210,48 | 981 | 224,83 | ||||
| 2025-08-08 | 13F | SG Americas Securities, LLC | 76.763 | 0 | ||||||
| 2025-05-08 | 13F | Essential Planning, LLC. | 0 | -100,00 | 0 | |||||
| 2025-08-12 | 13F | Pacer Advisors, Inc. | 142.633 | 128,96 | 635 | 144,79 | ||||
| 2025-08-14 | 13F | Bank Of America Corp /de/ | 537.250 | 206,17 | 2.375 | 219,95 | ||||
| 2025-08-15 | 13F | CI Private Wealth, LLC | 20.740 | -31,20 | 92 | -28,35 | ||||
| 2025-07-14 | 13F | UMA Financial Services, Inc. | 211 | 37,91 | 1 | |||||
| 2025-08-12 | 13F | American Century Companies Inc | 890.502 | 25,48 | 3.936 | 31,16 | ||||
| 2025-08-12 | 13F | Dimensional Fund Advisors Lp | 724.589 | -26,13 | 3.203 | -22,79 | ||||
| 2025-08-13 | 13F | Jump Financial, LLC | 388.598 | 211,33 | 1.718 | 225,81 | ||||
| 2025-08-14 | 13F | Sunbelt Securities, Inc. | 99 | 0,00 | 0 | |||||
| 2025-07-22 | 13F | Net Worth Advisory Group | 21.611 | 5,12 | 96 | 10,47 | ||||
| 2025-04-24 | 13F | PDS Planning, Inc | 0 | -100,00 | 0 | |||||
| 2025-08-12 | 13F | Skopos Labs, Inc. | 2.184 | 0,00 | 9 | 0,00 | ||||
| 2025-08-13 | 13F | Cerity Partners LLC | 43.002 | -25,03 | 190 | -21,49 | ||||
| 2025-05-15 | 13F | Point72 Hong Kong Ltd | 0 | -100,00 | 0 | -100,00 | ||||
| 2025-08-14 | 13F | Group One Trading, L.p. | 9.426 | -47,47 | 42 | -45,33 | ||||
| 2025-08-07 | 13F | Allworth Financial LP | 3.213 | 205,71 | 14 | 366,67 | ||||
| 2025-08-14 | 13F | Mariner, LLC | 206.154 | 236,03 | 911 | 251,74 | ||||
| 2025-08-14 | 13F | Group One Trading, L.p. | Put | 7.200 | -61,08 | 32 | -60,26 | |||
| 2025-08-14 | 13F | Sei Investments Co | 0 | -100,00 | 0 | |||||
| 2025-08-14 | 13F | Group One Trading, L.p. | Call | 10.200 | 920,00 | 45 | 1.025,00 | |||
| 2025-08-15 | 13F | Morgan Stanley | 3.089.253 | 39,02 | 13.655 | 45,27 | ||||
| 2025-08-15 | 13F | Tower Research Capital LLC (TRC) | 5.566 | -46,96 | 25 | -45,45 | ||||
| 2025-08-12 | 13F | Aigen Investment Management, Lp | 0 | -100,00 | 0 | |||||
| 2025-06-26 | NP | Dfa Investment Trust Co - The Emerging Markets Series This fund is a listed as child fund of Dimensional Fund Advisors Lp and if that institution has disclosed ownership in this security, then these positions will not be double counted when calculating total shares and total value | 305.779 | -19,24 | 1.064 | -40,19 | ||||
| 2025-08-11 | 13F | Bell Investment Advisors, Inc | 70 | 0,00 | 0 | |||||
| 2025-07-21 | 13F | Qrg Capital Management, Inc. | 22.781 | 11,33 | 101 | 16,28 | ||||
| 2025-08-08 | 13F | Creative Planning | 246.324 | 157,03 | 1.089 | 168,64 | ||||
| 2025-08-14 | 13F | GWM Advisors LLC | 18.814 | 47,57 | 83 | 56,60 | ||||
| 2025-08-14 | 13F | Point72 Asset Management, L.P. | 512.500 | 23,44 | 2.265 | 28,99 | ||||
| 2025-08-14 | 13F | Wells Fargo & Company/mn | 10.533 | 37,61 | 47 | 43,75 | ||||
| 2025-08-13 | 13F | Walleye Capital LLC | 0 | -100,00 | 0 | -100,00 | ||||
| 2025-07-28 | NP | AVXC - Avantis Emerging Markets ex-China Equity ETF | 6.939 | 37,43 | 31 | 36,36 | ||||
| 2025-08-08 | 13F | SBI Securities Co., Ltd. | 12.852 | 2,87 | 57 | 7,69 | ||||
| 2025-08-14 | 13F | Millennium Management Llc | 32.510 | -97,76 | 144 | -97,67 | ||||
| 2025-05-06 | 13F | Advisors Preferred, LLC | 0 | -100,00 | 0 | |||||
| 2025-07-08 | 13F | Northwest & Ethical Investments L.P. | 0 | -100,00 | 0 | |||||
| 2025-08-13 | 13F | First Trust Advisors Lp | 14.155 | -5,15 | 63 | -1,59 | ||||
| 2025-08-07 | 13F | Connor, Clark & Lunn Investment Management Ltd. | 767.312 | 11,93 | 3.392 | 16,97 | ||||
| 2025-08-14 | 13F | Quartz Partners, LLC | 14.504 | 8,01 | 64 | 14,29 | ||||
| 2025-08-14 | 13F | Aqr Capital Management Llc | 22.987 | 102 | ||||||
| 2025-07-24 | 13F | Ronald Blue Trust, Inc. | 13.245 | -23,12 | 59 | -19,44 | ||||
| 2025-05-15 | 13F | Verition Fund Management LLC | 0 | -100,00 | 0 | -100,00 | ||||
| 2025-05-15 | 13F | Jain Global LLC | 0 | -100,00 | 0 | |||||
| 2025-08-14 | 13F | Susquehanna International Group, Llp | Put | 36.200 | -41,33 | 160 | -38,46 | |||
| 2025-08-14 | 13F | Susquehanna International Group, Llp | 11.756 | -93,96 | 52 | -93,80 | ||||
| 2025-08-12 | 13F | Coldstream Capital Management Inc | 0 | -100,00 | 0 | |||||
| 2025-08-12 | 13F | Pathstone Holdings, LLC | 31.049 | -3,90 | 137 | 0,74 | ||||
| 2025-08-14 | 13F | Susquehanna International Group, Llp | Call | 25.100 | 42,61 | 111 | 48,65 | |||
| 2025-08-12 | 13F | Proequities, Inc. | Put | 0 | 0 | |||||
| 2025-08-13 | 13F | Quadrant Capital Group Llc | 152.631 | 264,80 | 675 | 282,95 | ||||
| 2025-06-30 | NP | CAFRX - Africa Fund | 4.000 | 0,00 | 14 | -27,78 | ||||
| 2025-08-12 | 13F | Proequities, Inc. | Call | 0 | 0 | |||||
| 2025-05-05 | 13F | Creekmur Asset Management LLC | 0 | -100,00 | 0 | |||||
| 2025-08-11 | 13F | Private Advisor Group, LLC | 41.939 | 75,82 | 185 | 85,00 | ||||
| 2025-08-12 | 13F | Proequities, Inc. | 0 | 0 | ||||||
| 2025-08-08 | 13F | Gts Securities Llc | 29.088 | 129 | ||||||
| 2025-07-24 | 13F | Us Bancorp \de\ | 23.635 | 14,71 | 104 | 19,54 | ||||
| 2025-07-25 | 13F | JustInvest LLC | 34.523 | -25,37 | 153 | -22,05 | ||||
| 2025-08-12 | 13F | BlackRock, Inc. | 2.011.911 | 55,03 | 8.893 | 62,00 | ||||
| 2025-08-12 | 13F | Trexquant Investment LP | 0 | -100,00 | 0 | |||||
| 2025-07-30 | NP | APIE - ActivePassive International Equity ETF | 54.732 | 64,07 | 243 | 67,59 | ||||
| 2025-07-16 | 13F | Signaturefd, Llc | 26.790 | 137,54 | 118 | 151,06 | ||||
| 2025-08-12 | 13F | LPL Financial LLC | 129.340 | 121,80 | 572 | 132,11 | ||||
| 2025-08-13 | 13F | Centiva Capital, LP | 0 | -100,00 | 0 | |||||
| 2025-08-13 | 13F | Northern Trust Corp | 162.406 | 0,95 | 718 | 5,44 | ||||
| 2025-08-14 | 13F | Van Eck Associates Corp | 1.176 | -28,34 | 0 | |||||
| 2025-07-14 | 13F | GAMMA Investing LLC | 4.155 | 231,08 | 18 | 260,00 | ||||
| 2025-08-21 | NP | AFK - VanEck Vectors Africa Index ETF | 28.350 | -1,12 | 125 | 3,31 | ||||
| 2025-08-13 | 13F | Barclays Plc | 0 | -100,00 | 0 | |||||
| 2025-08-11 | 13F | Principal Securities, Inc. | 167 | 221,15 | 1 | |||||
| 2025-07-24 | 13F | Jfs Wealth Advisors, Llc | 271 | 1 | ||||||
| 2025-08-14 | 13F | D. E. Shaw & Co., Inc. | 202.856 | -54,32 | 897 | -52,29 | ||||
| 2025-08-14 | 13F | Ariadne Wealth Management, LP | 11.772 | 68 | ||||||
| 2025-07-28 | NP | AVES - Avantis Emerging Markets Value ETF This fund is a listed as child fund of American Century Companies Inc and if that institution has disclosed ownership in this security, then these positions will not be double counted when calculating total shares and total value | 83.985 | 14,17 | 373 | 15,89 | ||||
| 2025-08-14 | 13F | Goldman Sachs Group Inc | 862.405 | 575,68 | 3.812 | 607,05 | ||||
| 2025-08-14 | 13F | Jane Street Group, Llc | 281.722 | 82,11 | 1.245 | 90,37 | ||||
| 2025-05-02 | 13F | Pzena Investment Management Llc | 0 | -100,00 | 0 | |||||
| 2025-05-14 | 13F | EntryPoint Capital, LLC | 0 | -100,00 | 0 | |||||
| 2025-08-12 | 13F | Rhumbline Advisers | 6.235 | -9,57 | 28 | -6,90 | ||||
| 2025-05-15 | 13F | Engineers Gate Manager LP | 0 | -100,00 | 0 | |||||
| 2025-07-18 | 13F | Generali Investments CEE, investicni spolecnost, a.s. | 367.196 | 0,00 | 1.623 | 4,51 | ||||
| 2025-07-25 | 13F | Sequoia Financial Advisors, LLC | 13.875 | 8,47 | 61 | 12,96 | ||||
| 2025-08-14 | 13F | Banco BTG Pactual S.A. | 20.000 | 88 | ||||||
| 2025-08-14 | 13F | Two Sigma Investments, Lp | 1.004.589 | -33,71 | 4.440 | -30,73 | ||||
| 2025-08-14 | 13F | Wetherby Asset Management Inc | 31.130 | -0,16 | 138 | -3,52 | ||||
| 2025-08-11 | 13F | Brown Brothers Harriman & Co | 435 | 2 | ||||||
| 2025-08-14 | 13F | Vident Advisory, LLC | 59.417 | -17,00 | 263 | -13,25 | ||||
| 2025-08-13 | 13F | Renaissance Technologies Llc | 393.800 | -8,84 | 1.741 | -4,76 | ||||
| 2025-08-14 | 13F | Ieq Capital, Llc | 13.580 | 60 | ||||||
| 2025-08-06 | 13F | True Wealth Design, LLC | 43 | -15,69 | 0 | |||||
| 2025-07-15 | 13F | Public Employees Retirement System Of Ohio | 95.728 | 15,87 | 423 | 21,20 | ||||
| 2025-07-09 | 13F | Sivia Capital Partners, LLC | 11.699 | 52 | ||||||
| 2025-08-11 | 13F | Citigroup Inc | 122.476 | 138,37 | 541 | 149,31 | ||||
| 2025-05-13 | 13F | HighTower Advisors, LLC | 0 | -100,00 | 0 | |||||
| 2025-07-30 | 13F | FNY Investment Advisers, LLC | 203.310 | 1 | ||||||
| 2025-05-12 | 13F | Greenwich Wealth Management LLC | 0 | -100,00 | 0 | |||||
| 2025-08-04 | 13F | Hantz Financial Services, Inc. | 0 | -100,00 | 0 | |||||
| 2025-08-08 | 13F | Pnc Financial Services Group, Inc. | 11.518 | 0,18 | 51 | 4,17 | ||||
| 2025-08-14 | 13F | Cubist Systematic Strategies, LLC | 285.377 | 39,36 | 1.261 | 45,61 | ||||
| 2025-08-12 | 13F | Virtu Financial LLC | 27.237 | 46,78 | 0 | |||||
| 2025-08-14 | 13F | Fmr Llc | 17.956 | -57,54 | 79 | -55,62 | ||||
| 2025-06-26 | NP | DFCEX - Emerging Markets Core Equity Portfolio - Institutional Class This fund is a listed as child fund of Dimensional Fund Advisors Lp and if that institution has disclosed ownership in this security, then these positions will not be double counted when calculating total shares and total value | 508.321 | 0,00 | 1.769 | -25,99 | ||||
| 2025-07-11 | 13F | Farther Finance Advisors, LLC | 691 | 230,62 | 3 | |||||
| 2025-07-25 | 13F | Apollon Wealth Management, LLC | 0 | -100,00 | 0 | |||||
| 2025-06-02 | 13F/A | Deutsche Bank Ag\ | 0 | -100,00 | 0 | |||||
| 2025-08-13 | 13F | FORA Capital, LLC | 0 | -100,00 | 0 | |||||
| 2025-08-14 | 13F | Schonfeld Strategic Advisors LLC | 0 | -100,00 | 0 | |||||
| 2025-07-14 | 13F | Abound Wealth Management | 26 | 0,00 | 0 | |||||
| 2025-08-05 | 13F | Simplex Trading, Llc | Call | 16.600 | -57,44 | 0 | ||||
| 2025-08-14 | 13F | Banque Transatlantique SA | 0 | -100,00 | 0 | |||||
| 2025-09-04 | 13F/A | Advisor Group Holdings, Inc. | 4.839 | -14,03 | 21 | -8,70 | ||||
| 2025-07-31 | 13F | Caitong International Asset Management Co., Ltd | 997 | 100,20 | 4 | 100,00 | ||||
| 2025-08-04 | 13F | Assetmark, Inc | 101 | 0 | ||||||
| 2025-08-07 | 13F | Sierra Ocean, Llc | 1.230 | 86,08 | 5 | 150,00 | ||||
| 2025-08-05 | 13F | Simplex Trading, Llc | Put | 100 | -99,39 | 0 | ||||
| 2025-08-05 | 13F | Simplex Trading, Llc | 2.676 | -76,74 | 0 | |||||
| 2025-08-15 | 13F | WealthCollab, LLC | 0 | -100,00 | 0 | |||||
| 2025-08-07 | 13F | Parkside Financial Bank & Trust | 406 | 2 | ||||||
| 2025-08-13 | 13F | EverSource Wealth Advisors, LLC | 8.960 | 347,33 | 40 | 387,50 | ||||
| 2025-07-28 | NP | VCGEX - Emerging Economies Fund | 20.550 | -79,64 | 91 | -80,00 | ||||
| 2025-07-15 | 13F | Ballentine Partners, LLC | 19.572 | 47,28 | 87 | 53,57 | ||||
| 2025-08-14 | 13F | Citadel Advisors Llc | 85.777 | -51,42 | 379 | -49,20 | ||||
| 2025-05-30 | NP | FRDM - Freedom 100 Emerging Markets ETF | 0 | -100,00 | 0 | -100,00 | ||||
| 2025-08-14 | 13F | Citadel Advisors Llc | Put | 22.000 | 24,29 | 97 | 31,08 | |||
| 2025-08-14 | 13F | Integrated Wealth Concepts LLC | 60.514 | 267 | ||||||
| 2025-04-23 | 13F | Legacy Advisors, LLC | 0 | -100,00 | 0 | |||||
| 2025-08-12 | 13F | MAI Capital Management | 2.652 | 12 | ||||||
| 2025-08-14 | 13F | Citadel Advisors Llc | Call | 33.200 | 1,84 | 147 | 6,57 | |||
| 2025-08-14 | 13F | Stifel Financial Corp | 264.506 | 1.169 | ||||||
| 2025-05-14 | 13F | Ameriprise Financial Inc | 0 | -100,00 | 0 | -100,00 | ||||
| 2025-08-14 | 13F | Barometer Capital Management Inc. | 51.821 | 5,93 | 229 | 11,17 | ||||
| 2025-08-14 | 13F | Two Sigma Advisers, Lp | 932.800 | -25,12 | 4.123 | -21,77 | ||||
| 2025-07-21 | 13F | Ameriflex Group, Inc. | 400 | -82,61 | 2 | -88,89 | ||||
| 2025-08-14 | 13F | Federation des caisses Desjardins du Quebec | 700 | -22,22 | 3 | 0,00 | ||||
| 2025-08-14 | 13F | Balyasny Asset Management Llc | 28.262 | -51,21 | 125 | -49,39 | ||||
| 2025-08-13 | 13F | Northwestern Mutual Wealth Management Co | 1.172 | 5 | ||||||
| 2025-08-19 | 13F | Asset Dedication, LLC | 0 | -100,00 | 0 | |||||
| 2025-08-12 | 13F | O'shaughnessy Asset Management, Llc | 0 | -100,00 | 0 | |||||
| 2025-07-28 | NP | NSI - National Security Emerging Markets Index ETF | 16.514 | 38,49 | 73 | 40,38 | ||||
| 2025-07-24 | 13F | IFP Advisors, Inc | 0 | -100,00 | 0 |
Other Listings
| DE:SAO | 6,15 € |