Statistiche di base
| Proprietari istituzionali | 130 total, 124 long only, 1 short only, 5 long/short - change of -5,11% MRQ |
| Allocazione media del portafoglio | 0.1287 % - change of -13,89% MRQ |
| Azioni istituzionali (Long) | 7.681.297 (ex 13D/G) - change of 1,90MM shares 32,97% MRQ |
| Valore istituzionale (Long) | $ 641.159 USD ($1000) |
Proprietà istituzionale e azionisti
VanEck ETF Trust - VanEck Pharmaceutical ETF (US:PPH) ha 130 proprietari istituzionali e azionisti che hanno presentato i moduli 13D/G o 13F alla Securities Exchange Commission (SEC). Queste istituzioni detengono un totale di 7,681,297 azioni. I maggiori azionisti includono Goldman Sachs Group Inc, Morgan Stanley, Healthcare Of Ontario Pension Plan Trust Fund, Wells Fargo & Company/mn, Clal Insurance Enterprises Holdings Ltd, Jane Street Group, Llc, Avalon Trust Co, J.Safra Asset Management Corp, Jpmorgan Chase & Co, and Susquehanna International Group, Llp .
(VanEck ETF Trust - VanEck Pharmaceutical ETF (NasdaqGM:PPH) la struttura proprietaria istituzionale mostra le attuali posizioni nella società da parte di istituzioni e fondi, nonché le ultime variazioni nella dimensione della posizione. I principali azionisti possono essere singoli investitori, fondi comuni, hedge fund o istituzioni. L'allegato 13D indica che l'investitore detiene (o ha detenuto) più del 5% della società e intende (o intendeva) perseguire attivamente un cambiamento nella strategia aziendale. L'allegato 13G indica un investimento passivo superiore al 5%.
The share price as of September 10, 2025 is 89,14 / share. Previously, on September 11, 2024, the share price was 97,10 / share. This represents a decline of 8,20% over that period.

Indice del sentiment dei fondi
L'indice del sentiment dei fondi (anche noto come "indice di accumulo di proprietà") individua i titoli più acquistati dai fondi. È il risultato di un sofisticato modello quantitativo multi-fattore che identifica le società con i più alti livelli di accumulo istituzionale. Il modello utilizza una combinazione dell'aumento totale dei proprietari dichiarati, delle variazioni nelle allocazioni di portafoglio di tali proprietari e di altre metriche. Il punteggio varia da 0 a 100: i numeri più alti indicano un livello di accumulo superiore ad altre società, mentre 50 rappresenta la media.
Frequenza di aggiornamento: giornaliera
Consulta Ownership Explorer per visualizzare l'elenco delle aziende con il ranking più alto.
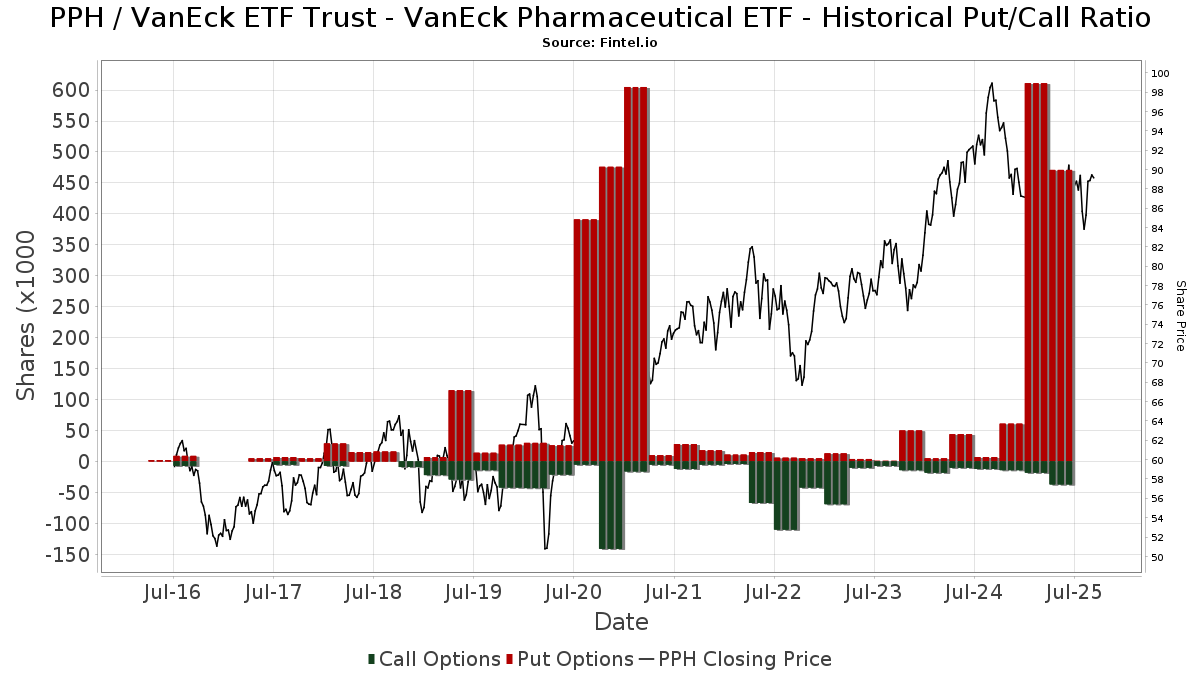
Rapporto put/call istituzionale
Oltre a segnalare le emissioni standard di titoli azionari e di debito, gli istituti con più di 100 milioni di asset in gestione devono anche dichiarare le loro partecipazioni in opzioni put e call. Poiché le opzioni put indicano generalmente un sentiment negativo e le opzioni call un sentiment positivo, possiamo avere un'idea del sentiment istituzionale complessivo attraverso il rapporto tra put e call. Il grafico a destra mostra il rapporto storico put/call per questo strumento.
L'utilizzo del rapporto put/call come indicatore del sentiment degli investitori consente di superare una delle principali lacune dell'utilizzo della proprietà istituzionale totale, ovvero il fatto che una quantità significativa di asset in gestione viene investita passivamente per seguire gli indici. Generalmente, i fondi a gestione passiva non acquistano opzioni, per cui il rapporto put/call riflette più fedelmente il sentiment dei fondi a gestione attiva.
Depositi 13F e NPORT
Le informazioni relative ai depositi 13F sono gratuite. Per accedere alle informazioni relative ai depositi NP è necessario un'abbonamento premium. Le righe verdi indicano le nuove posizioni. Le righe rosse indicano le posizioni chiuse. Fai clic sull'icona del link per visualizzare la cronologia completa delle transazioni.
Esegui l'upgrade
per sbloccare i dati premium ed esportarli in Excel ![]() .
.
| Data di deposito | Fonte | Investitore | Tipo | Prezzo medio (Stima) |
Azioni | Δ Azioni (%) |
Valore dichiarato ($ 1000) |
Δ Valore (%) |
Allocazione del portafoglio (%) |
|
|---|---|---|---|---|---|---|---|---|---|---|
| 2025-08-13 | 13F | Beacon Pointe Advisors, LLC | 2.428 | 0,00 | 214 | -3,62 | ||||
| 2025-08-12 | 13F | Jpmorgan Chase & Co | 255.837 | 2.852,19 | 22.503 | 2.752,09 | ||||
| 2025-08-13 | 13F | Level Four Advisory Services, Llc | 37.495 | 3,11 | 3.298 | -0,45 | ||||
| 2025-08-08 | 13F | SBI Securities Co., Ltd. | 284 | -16,22 | 25 | -20,00 | ||||
| 2025-08-12 | 13F | Steward Partners Investment Advisory, Llc | 16.161 | 0,00 | 1.422 | -3,46 | ||||
| 2025-07-28 | 13F | Mutual Advisors, LLC | 0 | -100,00 | 0 | |||||
| 2025-05-08 | 13F | Private Advisory Group LLC | 0 | -100,00 | 0 | -100,00 | ||||
| 2025-07-22 | 13F | IMC-Chicago, LLC | 0 | -100,00 | 0 | |||||
| 2025-07-15 | 13F | North Star Investment Management Corp. | 1.109 | 0,09 | 98 | -3,96 | ||||
| 2025-08-07 | 13F | Allworth Financial LP | 385 | 10,32 | 34 | 10,00 | ||||
| 2025-05-20 | 13F/A | Colony Group, LLC | 0 | -100,00 | 0 | -100,00 | ||||
| 2025-08-13 | 13F | Jones Financial Companies Lllp | 3.240 | 13,68 | 283 | 9,69 | ||||
| 2025-05-14 | 13F | Oarsman Capital, Inc. | 0 | -100,00 | 0 | -100,00 | ||||
| 2025-07-29 | 13F | Stratos Wealth Advisors, LLC | 4.066 | -0,76 | 358 | -4,29 | ||||
| 2025-08-11 | 13F | Aptus Capital Advisors, LLC | 524 | 0,58 | 46 | -2,13 | ||||
| 2025-08-14 | 13F | DeepCurrents Investment Group LLC | Put | 0 | -100,00 | 0 | ||||
| 2025-07-31 | 13F | Conservest Capital Advisors, Inc. | 5.059 | 0,16 | 445 | -3,48 | ||||
| 2025-08-05 | 13F | Bank Of Montreal /can/ | 11.398 | -26,88 | 1.003 | -29,44 | ||||
| 2025-08-14 | 13F | Two Sigma Investments, Lp | 0 | -100,00 | 0 | |||||
| 2025-08-12 | 13F | MAI Capital Management | 938 | -6,11 | 82 | -9,89 | ||||
| 2025-08-14 | 13F | D. E. Shaw & Co., Inc. | 30.254 | 2.661 | ||||||
| 2025-08-14 | 13F | Stifel Financial Corp | 11.456 | -0,05 | 1.008 | -3,54 | ||||
| 2025-07-22 | 13F | Bank Hapoalim Bm | 3.948 | -2,35 | 0 | |||||
| 2025-08-05 | 13F | Dunhill Financial, LLC | 2.833 | 249 | ||||||
| 2025-08-08 | 13F | Cetera Investment Advisers | 36.017 | 4,01 | 3.168 | 0,41 | ||||
| 2025-08-13 | 13F | Capital Analysts, Inc. | 232 | 0,00 | 0 | |||||
| 2025-08-19 | 13F | Anchor Investment Management, LLC | 58 | 0,00 | 5 | 0,00 | ||||
| 2025-04-29 | 13F | Hm Payson & Co | 99 | 0,00 | 9 | 12,50 | ||||
| 2025-07-25 | 13F | Cwm, Llc | 375 | 167,86 | 0 | |||||
| 2025-08-14 | 13F | Goldman Sachs Group Inc | 2.762.770 | 138,13 | 243.013 | 129,85 | ||||
| 2025-07-14 | 13F | Buska Wealth Management, LLC | 3.297 | -18,11 | 290 | -20,77 | ||||
| 2025-08-04 | 13F | Creative Financial Designs Inc /adv | 2.129 | 18,15 | 187 | 14,02 | ||||
| 2025-04-23 | 13F | Spirepoint Private Client, Llc | 0 | -100,00 | 0 | |||||
| 2025-07-28 | 13F | Harbour Investments, Inc. | 4.450 | 9,71 | 391 | 5,96 | ||||
| 2025-08-11 | 13F | Independent Advisor Alliance | 51.519 | 11,24 | 4.532 | 7,37 | ||||
| 2025-08-14 | 13F | UBS Group AG | 163.718 | -26,26 | 14.401 | -28,82 | ||||
| 2025-07-16 | 13F | Twelve Points Wealth Management LLC | 0 | -100,00 | 0 | |||||
| 2025-08-13 | 13F | Renaissance Technologies Llc | 14.400 | 1.267 | ||||||
| 2025-05-12 | 13F | Pura Vida Investments, Llc | Put | 0 | -100,00 | 0 | ||||
| 2025-08-14 | 13F | Jane Street Group, Llc | Put | 98.100 | 174,79 | 8.629 | 165,23 | |||
| 2025-08-14 | 13F | Jane Street Group, Llc | Call | 2.600 | -10,34 | 229 | -13,64 | |||
| 2025-08-04 | 13F | Canton Hathaway, LLC | 10.000 | 0,00 | 1 | |||||
| 2025-08-14 | 13F | Jane Street Group, Llc | 299.380 | 927,84 | 26.333 | 892,20 | ||||
| 2025-03-12 | 13F | Centaurus Financial, Inc. | 0 | -100,00 | 0 | |||||
| 2025-08-15 | 13F | Tower Research Capital LLC (TRC) | 34.624 | 346.140,00 | 3.046 | |||||
| 2025-07-23 | 13F | Elm3 Financial Group, LLC | 2.439 | -22,08 | 215 | -24,91 | ||||
| 2025-07-28 | 13F | Copia Wealth Management | 5.429 | -11,90 | 478 | -14,97 | ||||
| 2025-08-08 | 13F | Avalon Trust Co | 280.477 | -1,13 | 24.671 | -4,57 | ||||
| 2025-09-10 | 13F | WT Wealth Management | 46.597 | -9,86 | 4.099 | -12,99 | ||||
| 2025-07-08 | 13F | Arlington Trust Co LLC | 85 | 0,00 | 7 | 0,00 | ||||
| 2025-08-12 | 13F | Inscription Capital, LLC | 0 | -100,00 | 0 | |||||
| 2025-05-13 | 13F | SFI Advisors, LLC | 0 | -100,00 | 0 | |||||
| 2025-08-12 | 13F | Park Square Financial Group, LLC | 600 | 0,00 | 53 | -3,70 | ||||
| 2025-08-11 | 13F | Banque Cantonale Vaudoise | 629 | 0,00 | 0 | |||||
| 2025-08-14 | 13F | Wells Fargo & Company/mn | 402.987 | 35.447 | ||||||
| 2025-08-12 | 13F | Accredited Wealth Management, LLC | 100 | 0,00 | 9 | -11,11 | ||||
| 2025-08-12 | 13F | Proequities, Inc. | 0 | 0 | ||||||
| 2025-07-16 | 13F | Signaturefd, Llc | 0 | -100,00 | 0 | |||||
| 2025-08-06 | 13F | Kcm Investment Advisors Llc | 2.893 | -1,03 | 254 | -4,51 | ||||
| 2025-07-28 | 13F | J.Safra Asset Management Corp | 271.620 | 1,71 | 23.759 | -2,38 | ||||
| 2025-08-13 | 13F | Continuum Advisory, LLC | 0 | -100,00 | 0 | |||||
| 2025-08-06 | 13F | AE Wealth Management LLC | 1.004 | -4,02 | 88 | -7,37 | ||||
| 2025-08-11 | 13F | Principal Securities, Inc. | 353 | 38,98 | 31 | 47,62 | ||||
| 2025-07-31 | 13F | Oppenheimer & Co Inc | 11.111 | 2,10 | 977 | -1,41 | ||||
| 2025-08-14 | 13F | Bank Of America Corp /de/ | 59.637 | -66,51 | 5.246 | -67,68 | ||||
| 2025-08-14 | 13F | Wells Fargo & Company/mn | Put | 8.200 | 721 | |||||
| 2025-08-13 | 13F | Fisher Asset Management, LLC | 15.001 | -98,83 | 1.319 | -98,87 | ||||
| 2025-08-14 | 13F | Two Sigma Securities, Llc | 4.480 | 40,09 | 394 | 35,40 | ||||
| 2025-05-30 | NP | ERNZ - TrueShares Active Yield ETF | 5.579 | 508 | ||||||
| 2025-08-14 | 13F | Raymond James Financial Inc | 22.417 | 11,78 | 1.972 | 7,88 | ||||
| 2025-08-14 | 13F | Hrt Financial Lp | 0 | -100,00 | 0 | |||||
| 2025-08-14 | 13F | Aspen Grove Capital, LLC | 25.844 | 0,58 | 2.273 | -2,90 | ||||
| 2025-08-07 | 13F | Montag A & Associates Inc | 660 | 0,00 | 58 | -3,33 | ||||
| 2025-08-12 | 13F | Jefferies Financial Group Inc. | 3.262 | 287 | ||||||
| 2025-09-04 | 13F/A | Advisor Group Holdings, Inc. | 22.125 | 82,35 | 1.946 | 75,95 | ||||
| 2025-07-29 | 13F | TrueMark Investments, LLC | 0 | -100,00 | 0 | |||||
| 2025-08-11 | 13F | Citigroup Inc | 66.024 | 5.807 | ||||||
| 2025-07-23 | 13F | Fluent Financial, LLC | 0 | -100,00 | 0 | |||||
| 2025-07-11 | 13F | Farther Finance Advisors, LLC | 434 | -20,37 | 38 | -20,83 | ||||
| 2025-08-14 | 13F | GWM Advisors LLC | 102 | -98,85 | 9 | -99,01 | ||||
| 2025-08-06 | 13F | Miller Investment Management, LP | 181.536 | -4,27 | 15.968 | -7,60 | ||||
| 2025-07-23 | 13F | Prime Capital Investment Advisors, LLC | 96.870 | -26,43 | 8.521 | -28,99 | ||||
| 2025-08-05 | 13F | Telos Capital Management, Inc. | 4.516 | 2,08 | 397 | -1,49 | ||||
| 2025-04-24 | 13F | Nadler Financial Group, Inc. | 0 | -100,00 | 0 | |||||
| 2025-05-15 | 13F | Old Mission Capital Llc | 0 | -100,00 | 0 | -100,00 | ||||
| 2025-07-21 | 13F | Ntv Asset Management Llc | 7.957 | -13,25 | 700 | -16,29 | ||||
| 2025-05-15 | 13F | Marshall Wace, Llp | 0 | -100,00 | 0 | |||||
| 2025-08-14 | 13F | Sunbelt Securities, Inc. | 1.000 | 86 | ||||||
| 2025-07-07 | 13F | Nova Wealth Management, Inc. | 3.097 | -21,26 | 272 | -24,02 | ||||
| 2025-07-24 | 13F | Us Bancorp \de\ | 414 | -48,64 | 36 | -50,68 | ||||
| 2025-08-14 | 13F | Headlands Technologies LLC | 0 | -100,00 | 0 | -100,00 | ||||
| 2025-04-16 | 13F | Wealth Enhancement Advisory Services, Llc | Put | 0 | -100,00 | 0 | ||||
| 2025-08-14 | 13F | CoreFirst Bank & Trust | 200 | 18 | ||||||
| 2025-08-04 | 13F | Assetmark, Inc | 16 | -76,12 | 1 | -83,33 | ||||
| 2025-08-08 | 13F | Hartland & Co., LLC | 500 | 44 | ||||||
| 2025-04-16 | 13F | Hoey Investments, Inc | 0 | -100,00 | 0 | |||||
| 2025-08-11 | 13F | Blue Bell Private Wealth Management, Llc | 0 | -100,00 | 0 | |||||
| 2025-08-25 | 13F/A | Neuberger Berman Group LLC | 3.593 | 0,00 | 316 | -3,36 | ||||
| 2025-08-15 | 13F | Morgan Stanley | 538.398 | 489,05 | 47.358 | 468,58 | ||||
| 2025-07-09 | 13F | Dynamic Advisor Solutions LLC | 0 | -100,00 | 0 | |||||
| 2025-07-15 | 13F | Capital Investment Advisors, LLC | 0 | -100,00 | 0 | |||||
| 2025-07-31 | 13F | Cambridge Investment Research Advisors, Inc. | 3.153 | -6,96 | 0 | |||||
| 2025-08-12 | 13F | LPL Financial LLC | 48.228 | -0,53 | 4.242 | -3,98 | ||||
| 2025-08-15 | 13F | Equitable Holdings, Inc. | 14.241 | 1,61 | 1.253 | -1,96 | ||||
| 2025-08-11 | 13F | Tidemark, LLC | 486 | 8,00 | 43 | 2,44 | ||||
| 2025-08-14 | 13F | CIBC World Markets Inc. | 4.075 | -8,39 | 358 | -11,60 | ||||
| 2025-07-14 | 13F | U.S. Capital Wealth Advisors, LLC | 2.750 | 5,77 | 242 | 2,12 | ||||
| 2025-07-17 | 13F | Janney Montgomery Scott LLC | 4.805 | -1,03 | 0 | |||||
| 2025-07-30 | 13F | Phoenix Holdings Ltd. | 61.276 | 13,77 | 5.390 | 7,97 | ||||
| 2025-08-11 | 13F | HHM Wealth Advisors, LLC | 1.350 | 0,00 | 119 | -4,07 | ||||
| 2025-08-11 | 13F | TD Waterhouse Canada Inc. | 170 | 0,00 | 15 | 0,00 | ||||
| 2025-08-14 | 13F | DecisionPoint Financial, LLC | 1.000 | 0,00 | 88 | -3,30 | ||||
| 2025-08-26 | NP | LCR - Leuthold Core ETF | 0 | -100,00 | 0 | -100,00 | ||||
| 2025-08-12 | 13F | Tradition Wealth Management, LLC | 6.064 | -6,19 | 533 | -9,51 | ||||
| 2025-04-17 | 13F | Grimes & Company, Inc. | 0 | -100,00 | 0 | |||||
| 2025-07-22 | 13F | Gsa Capital Partners Llp | 2.510 | -11,96 | 0 | |||||
| 2025-08-13 | 13F | Leuthold Group, Llc | 0 | -100,00 | 0 | |||||
| 2025-04-28 | 13F | Lansing Street Advisors | 0 | -100,00 | 0 | -100,00 | ||||
| 2025-07-28 | 13F | Mowery & Schoenfeld Wealth Management, LLC | 13 | 0,00 | 1 | 0,00 | ||||
| 2025-08-12 | 13F | Verity & Verity, LLC | 131.320 | 11.551 | ||||||
| 2025-04-18 | 13F | Edge Financial Advisors LLC | 0 | -100,00 | 0 | |||||
| 2025-08-26 | 13F/A | Thrivent Financial For Lutherans | 20.681 | 2 | ||||||
| 2025-07-24 | 13F | Blair William & Co/il | 12.295 | 34,30 | 1.081 | 29,62 | ||||
| 2025-08-12 | 13F | Trexquant Investment LP | 3.151 | 277 | ||||||
| 2025-05-05 | 13F | Mivtachim The Workers Social Insurance Fund Ltd. (Under Special Management) | 0 | -100,00 | 0 | -100,00 | ||||
| 2025-07-28 | 13F | Axxcess Wealth Management, Llc | 9.114 | 4,78 | 802 | 1,14 | ||||
| 2025-08-05 | 13F | GPS Wealth Strategies Group, LLC | 459 | 0,00 | 40 | -2,44 | ||||
| 2025-05-07 | 13F | Investment Management Corp /va/ /adv | 0 | -100,00 | 0 | |||||
| 2025-07-16 | 13F | AAFMAA Wealth Management & Trust LLC | 39.081 | -6,85 | 3.438 | -10,10 | ||||
| 2025-04-21 | 13F | SILVER OAK SECURITIES, Inc | 0 | -100,00 | 0 | |||||
| 2025-08-14 | 13F | Ameriprise Financial Inc | 3.364 | -1,38 | 296 | -4,84 | ||||
| 2025-07-23 | 13F | Vontobel Holding Ltd. | 3.800 | 0,00 | 334 | -3,47 | ||||
| 2025-08-01 | 13F | Envestnet Asset Management Inc | 4.275 | -14,45 | 376 | -17,36 | ||||
| 2025-08-27 | 13F/A | Brinker Capital Investments, LLC | 33.513 | -5,57 | 2.948 | -8,87 | ||||
| 2025-08-08 | 13F | Hudock, Inc. | 9.217 | 811 | ||||||
| 2025-08-13 | 13F | Healthcare Of Ontario Pension Plan Trust Fund | 512.000 | 0,00 | 45.036 | -3,48 | ||||
| 2025-08-14 | 13F | Verition Fund Management LLC | 4.044 | -20,06 | 356 | -22,99 | ||||
| 2025-07-09 | 13F | Sapient Capital Llc | 2.588 | 0,00 | 228 | -3,40 | ||||
| 2025-08-06 | 13F | Commonwealth Equity Services, Llc | 13.287 | -28,66 | 1 | 0,00 | ||||
| 2025-08-13 | 13F | Quadrature Capital Ltd | 0 | -100,00 | 0 | |||||
| 2025-08-14 | 13F | Royal Bank Of Canada | 35.163 | -47,98 | 3.093 | -49,79 | ||||
| 2025-08-12 | 13F | Global Retirement Partners, LLC | 270 | -7,85 | 24 | -8,00 | ||||
| 2025-08-14 | 13F | Fmr Llc | 1.461 | -2,60 | 129 | -5,88 | ||||
| 2025-08-14 | 13F | Federation des caisses Desjardins du Quebec | 400 | 0,00 | 35 | -2,78 | ||||
| 2025-08-13 | 13F | Flow Traders U.s. Llc | 0 | -100,00 | 0 | |||||
| 2025-08-14 | 13F | Mml Investors Services, Llc | 2.511 | 2,11 | 0 | |||||
| 2025-08-13 | 13F | StoneX Group Inc. | 0 | -100,00 | 0 | -100,00 | ||||
| 2025-08-14 | 13F | J. Goldman & Co LP | Put | 131.800 | -29,44 | 11.593 | -31,90 | |||
| 2025-08-04 | 13F | Arkadios Wealth Advisors | 7.780 | 684 | ||||||
| 2025-07-22 | 13F | Belpointe Asset Management LLC | 5.704 | -1,60 | 502 | -5,11 | ||||
| 2025-05-02 | 13F | Apollon Wealth Management, LLC | 0 | -100,00 | 0 | |||||
| 2025-08-14 | 13F | Citadel Advisors Llc | Put | 13.000 | -77,89 | 1.143 | -78,67 | |||
| 2025-08-14 | 13F | Susquehanna International Group, Llp | Put | 214.400 | -34,81 | 18.859 | -37,08 | |||
| 2025-08-05 | 13F | Westside Investment Management, Inc. | 2.351 | 208 | ||||||
| 2025-08-14 | 13F | Susquehanna International Group, Llp | 53.664 | 105,52 | 4.720 | 98,40 | ||||
| 2025-08-14 | 13F | Susquehanna International Group, Llp | Call | 23.300 | 77,86 | 2.049 | 71,75 | |||
| 2025-07-31 | 13F | Burke & Herbert Bank & Trust Co | 8.865 | 0,00 | 780 | -3,47 | ||||
| 2025-08-14 | 13F | Citadel Advisors Llc | Call | 6.100 | 165,22 | 537 | 156,46 | |||
| 2025-07-16 | 13F | Investment Partners Asset Management, Inc. | 4.219 | -0,28 | 371 | -3,64 | ||||
| 2025-08-14 | 13F | Citadel Advisors Llc | 31.277 | -24,47 | 2.751 | -27,09 | ||||
| 2025-07-24 | 13F | CarsonAllaria Wealth Management, Ltd. | 0 | -100,00 | 0 | |||||
| 2025-07-24 | 13F | IFP Advisors, Inc | 285 | 0,00 | 25 | -3,85 | ||||
| 2025-08-13 | 13F | D L Carlson Investment Group Inc | 0 | -100,00 | 0 | |||||
| 2025-07-21 | 13F | Warner Financial, Inc | 4.636 | 0,61 | 0 | |||||
| 2025-08-08 | 13F | Pnc Financial Services Group, Inc. | 250 | 0,00 | 22 | -4,55 | ||||
| 2025-07-29 | 13F | Activest Wealth Management | 74 | 0,00 | 7 | 0,00 | ||||
| 2025-08-14 | 13F | Comerica Bank | 430 | -21,39 | 38 | -24,49 | ||||
| 2025-08-13 | 13F | Barclays Plc | 0 | -100,00 | 0 | |||||
| 2025-04-16 | 13F | Wealth Enhancement Advisory Services, Llc | 0 | -100,00 | 0 | |||||
| 2025-08-14 | 13F | Camden Capital, LLC | 2.807 | 0,57 | 247 | -3,15 | ||||
| 2025-08-27 | 13F/A | Squarepoint Ops LLC | Call | 5.700 | 501 | |||||
| 2025-08-13 | 13F | Financial Freedom, LLC | 9.006 | 0,17 | 792 | -3,30 | ||||
| 2025-08-27 | 13F/A | Squarepoint Ops LLC | Put | 5.700 | 501 | |||||
| 2025-03-28 | 13F/A | Berkeley, Inc | 0 | -100,00 | 0 | |||||
| 2025-07-10 | 13F | Global Financial Private Client, LLC | 0 | -100,00 | 0 | |||||
| 2025-08-14 | 13F | Bnp Paribas Arbitrage, Sa | 108.629 | 0,00 | 9.555 | -3,48 | ||||
| 2025-05-15 | 13F | Blue Chip Partners, Inc. | 0 | -100,00 | 0 | |||||
| 2025-04-25 | 13F | Almanack Investment Partners, LLC. | 0 | -100,00 | 0 | |||||
| 2025-08-13 | 13F | Northwestern Mutual Wealth Management Co | 12.790 | 76,73 | 1.125 | 70,71 | ||||
| 2025-08-18 | 13F/A | National Bank Of Canada /fi/ | 513 | 0,00 | 45 | -2,17 | ||||
| 2025-08-14 | 13F | Qube Research & Technologies Ltd | 16.190 | 13.856,90 | 1.424 | 14.140,00 | ||||
| 2025-08-12 | 13F | Clal Insurance Enterprises Holdings Ltd | 325.000 | 29 | ||||||
| 2025-05-15 | 13F | Millennium Management Llc | 0 | -100,00 | 0 | -100,00 | ||||
| 2025-07-08 | 13F | Adamsbrown Wealth Consultants Llc | 195.976 | 12,05 | 17.238 | 8,16 | ||||
| 2025-08-06 | 13F | Nvwm, Llc | 38 | 3 | ||||||
| 2025-07-25 | 13F | Atria Wealth Solutions, Inc. | 2.739 | 0,00 | 241 | -3,61 | ||||
| 2025-05-15 | 13F/A | Orion Portfolio Solutions, LLC | 35.490 | 18,78 | 3.234 | 25,45 | ||||
| 2025-07-18 | 13F | SOA Wealth Advisors, LLC. | 0 | -100,00 | 0 |