Statistiche di base
| Proprietari istituzionali | 197 total, 189 long only, 1 short only, 7 long/short - change of 12,57% MRQ |
| Allocazione media del portafoglio | -0.2764 % - change of -207,68% MRQ |
| Azioni istituzionali (Long) | 9.261.278 (ex 13D/G) - change of 1,57MM shares 20,41% MRQ |
| Valore istituzionale (Long) | $ 484.576 USD ($1000) |
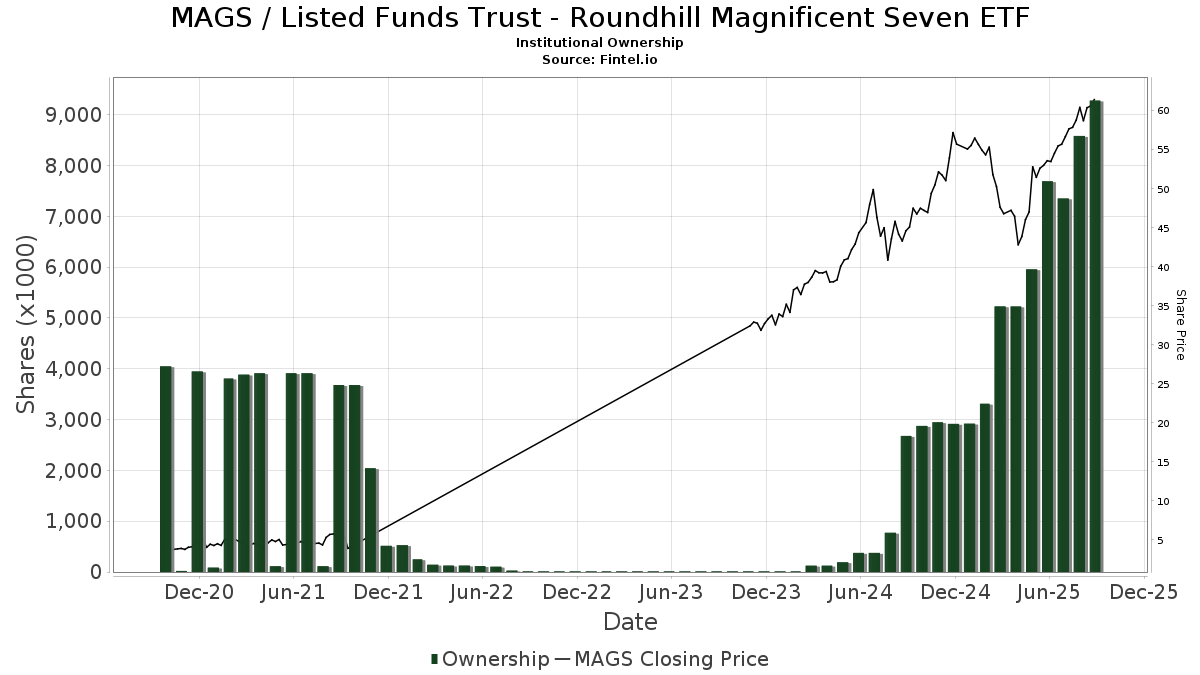
Proprietà istituzionale e azionisti
Listed Funds Trust - Roundhill Magnificent Seven ETF (US:MAGS) ha 197 proprietari istituzionali e azionisti che hanno presentato i moduli 13D/G o 13F alla Securities Exchange Commission (SEC). Queste istituzioni detengono un totale di 9,547,478 azioni. I maggiori azionisti includono J.Safra Asset Management Corp, Money Concepts Capital Corp, Nomura Holdings Inc, Nomura Holdings Inc, Susquehanna International Group, Llp, Jane Street Group, Llc, Susquehanna International Group, Llp, Graypoint LLC, HighTower Advisors, LLC, and Group One Trading, L.p. .
(Listed Funds Trust - Roundhill Magnificent Seven ETF (BATS:MAGS) la struttura proprietaria istituzionale mostra le attuali posizioni nella società da parte di istituzioni e fondi, nonché le ultime variazioni nella dimensione della posizione. I principali azionisti possono essere singoli investitori, fondi comuni, hedge fund o istituzioni. L'allegato 13D indica che l'investitore detiene (o ha detenuto) più del 5% della società e intende (o intendeva) perseguire attivamente un cambiamento nella strategia aziendale. L'allegato 13G indica un investimento passivo superiore al 5%.
The share price as of September 3, 2025 is 60,56 / share. Previously, on September 4, 2024, the share price was 43,26 / share. This represents an increase of 39,99% over that period.
Indice del sentiment dei fondi
L'indice del sentiment dei fondi (anche noto come "indice di accumulo di proprietà") individua i titoli più acquistati dai fondi. È il risultato di un sofisticato modello quantitativo multi-fattore che identifica le società con i più alti livelli di accumulo istituzionale. Il modello utilizza una combinazione dell'aumento totale dei proprietari dichiarati, delle variazioni nelle allocazioni di portafoglio di tali proprietari e di altre metriche. Il punteggio varia da 0 a 100: i numeri più alti indicano un livello di accumulo superiore ad altre società, mentre 50 rappresenta la media.
Frequenza di aggiornamento: giornaliera
Consulta Ownership Explorer per visualizzare l'elenco delle aziende con il ranking più alto.
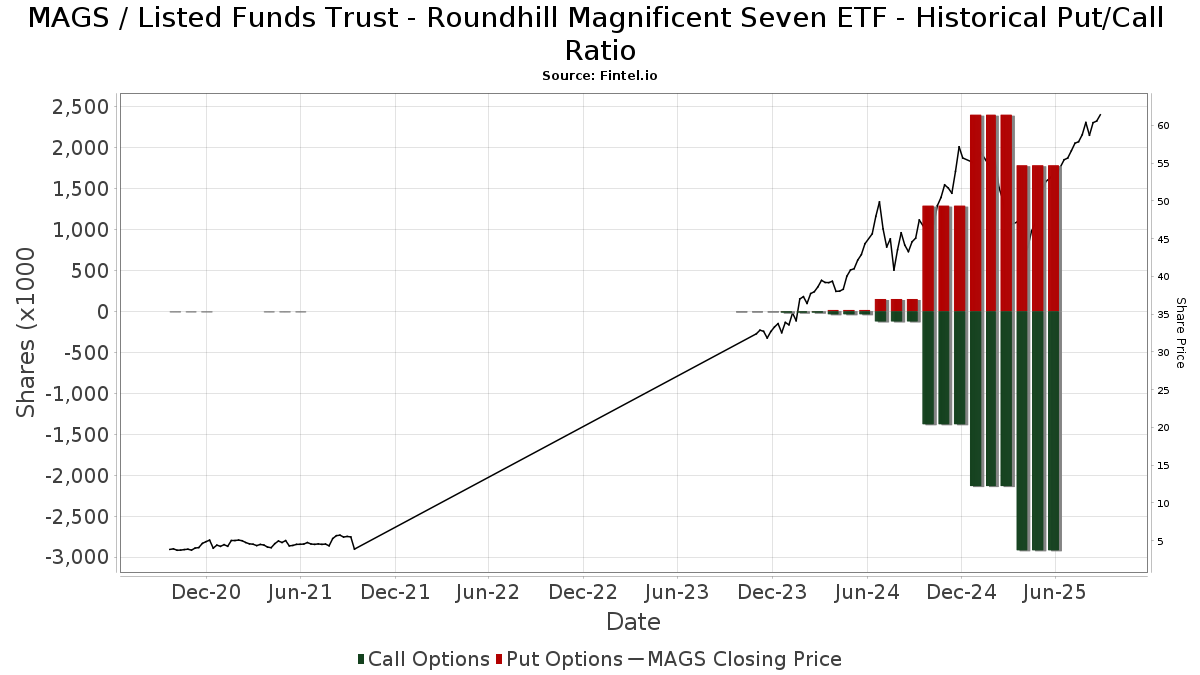
Rapporto put/call istituzionale
Oltre a segnalare le emissioni standard di titoli azionari e di debito, gli istituti con più di 100 milioni di asset in gestione devono anche dichiarare le loro partecipazioni in opzioni put e call. Poiché le opzioni put indicano generalmente un sentiment negativo e le opzioni call un sentiment positivo, possiamo avere un'idea del sentiment istituzionale complessivo attraverso il rapporto tra put e call. Il grafico a destra mostra il rapporto storico put/call per questo strumento.
L'utilizzo del rapporto put/call come indicatore del sentiment degli investitori consente di superare una delle principali lacune dell'utilizzo della proprietà istituzionale totale, ovvero il fatto che una quantità significativa di asset in gestione viene investita passivamente per seguire gli indici. Generalmente, i fondi a gestione passiva non acquistano opzioni, per cui il rapporto put/call riflette più fedelmente il sentiment dei fondi a gestione attiva.
Depositi 13D/G
Presentiamo i depositi 13D/G separatamente dai depositi 13F a causa del diverso trattamento da parte della SEC. I depositi 13D/G possono essere presentati da gruppi di investitori (con un unico leader), mentre i depositi 13F no. Ciò comporta situazioni in cui un investitore può depositare un documento 13D/G riportando un valore per il totale delle azioni (che rappresenta tutte le azioni possedute dal gruppo di investitori), e poi depositare un documento 13F riportando un valore diverso per il totale delle azioni (che rappresenta esclusivamente la propria proprietà). Ciò significa che la proprietà delle azioni nei depositi 13D/G e nei depositi 13F spesso non sono direttamente comparabili, pertanto le presentiamo separatamente.
Nota: a partire dal 16 maggio 2021, non mostriamo più i proprietari che non hanno depositato un documento 13D/G nellultimo anno. In precedenza, mostravamo lintero storico dei depositi 13D/G. In generale, le entità che sono tenute a depositare i documenti 13D/G devono farlo almeno una volta all'anno prima di presentare un deposito di chiusura. Tuttavia, a volte i fondi escono dalle posizioni senza presentare un deposito di chiusura (cioè, procedono a una liquidazione), per cui la visualizzazione dell'intero storico a volte generava confusione sull'attuale proprietà. Per evitare confusione, ora mostriamo solo i proprietari "attuali", ossia quelli che hanno effettuato un deposito nell'ultimo anno.
Upgrade to unlock premium data.
| Data di deposito | Modulo | Investitore | Azioni precedenti |
Ultime azioni |
Δ Azioni (Percentuale) |
Proprietà (Percentuale) |
Δ Proprietà (Percentuale) |
|
|---|---|---|---|---|---|---|---|---|
| 2025-08-18 | MONEY CONCEPTS CAPITAL CORP | 977,740 | 1,221,775 | 24.96 | 3.80 | 26.67 |
Depositi 13F e NPORT
Le informazioni relative ai depositi 13F sono gratuite. Per accedere alle informazioni relative ai depositi NP è necessario un'abbonamento premium. Le righe verdi indicano le nuove posizioni. Le righe rosse indicano le posizioni chiuse. Fai clic sull'icona del link per visualizzare la cronologia completa delle transazioni.
Esegui l'upgrade
per sbloccare i dati premium ed esportarli in Excel ![]() .
.
| Data di deposito | Fonte | Investitore | Tipo | Prezzo medio (Stima) |
Azioni | Δ Azioni (%) |
Valore dichiarato ($ 1000) |
Δ Valore (%) |
Allocazione del portafoglio (%) |
|
|---|---|---|---|---|---|---|---|---|---|---|
| 2025-07-28 | 13F | J.Safra Asset Management Corp | 1.410.466 | 80,89 | 78.394 | 119,23 | ||||
| 2025-07-30 | 13F | Brookstone Capital Management | 125.882 | 1.135,35 | 6.983 | 1.395,07 | ||||
| 2025-08-14 | 13F | Sunbelt Securities, Inc. | 0 | -100,00 | 0 | |||||
| 2025-07-10 | 13F | Focus Financial Network, Inc. | 18.019 | 4,56 | 1.000 | 26,46 | ||||
| 2025-08-12 | 13F | CIBC Private Wealth Group, LLC | 1.100 | 1.000,00 | 61 | 1.425,00 | ||||
| 2025-05-15 | 13F/A | Orion Portfolio Solutions, LLC | 43.991 | -26,31 | 2.017 | -37,90 | ||||
| 2025-08-08 | 13F | Larson Financial Group LLC | 690 | 38 | ||||||
| 2025-07-14 | 13F | BetterWealth, LLC | 5.825 | -16,02 | 323 | 1,57 | ||||
| 2025-08-11 | 13F | HighTower Advisors, LLC | Put | 5.000 | -88,89 | 3 | -99,36 | |||
| 2025-08-14 | 13F | Colony Group, LLC | 4.002 | -51,18 | 222 | -41,07 | ||||
| 2025-08-06 | 13F | Mascagni Wealth Management, Inc. | 10.693 | -2,54 | 593 | 17,89 | ||||
| 2025-08-14 | 13F | Citadel Advisors Llc | Put | 168.100 | -53,02 | 9.325 | -43,17 | |||
| 2025-08-01 | 13F | Brookwood Investment Group LLC | 4.031 | 224 | ||||||
| 2025-08-06 | 13F | Anchor Capital Advisors Llc | 6.927 | -36,90 | 384 | -23,66 | ||||
| 2025-08-11 | 13F | HighTower Advisors, LLC | 413.672 | 19,66 | 22.946 | 44,73 | ||||
| 2025-08-14 | 13F | Citadel Advisors Llc | Call | 254.700 | -58,67 | 14.128 | -50,01 | |||
| 2025-08-14 | 13F/A | Rockefeller Capital Management L.P. | 44.326 | 2.459 | ||||||
| 2025-08-28 | NP | Roundhill ETF Trust - Roundhill Magnificent Seven Covered Call ETF | Short | -286.200 | -15.876 | |||||
| 2025-08-14 | 13F | Citadel Advisors Llc | 153.964 | 27,29 | 8.540 | 53,96 | ||||
| 2025-08-08 | 13F | Gts Securities Llc | 3.627 | 201 | ||||||
| 2025-08-14 | 13F | Wells Fargo & Company/mn | 229 | -83,62 | 13 | -81,25 | ||||
| 2025-05-12 | 13F | Simplex Trading, Llc | 0 | -100,00 | 0 | |||||
| 2025-07-25 | 13F | Alpha Financial Partners, LLC | 9.680 | 537 | ||||||
| 2025-07-24 | 13F | JB Capital LLC | 4.870 | 4,04 | 270 | 26,17 | ||||
| 2025-08-28 | NP | MAGX - Roundhill Daily 2X Long Magnificent Seven ETF | 11 | 1 | ||||||
| 2025-08-14 | 13F | Pinnacle Family Advisors, LLC | 0 | -100,00 | 0 | |||||
| 2025-08-18 | 13F/A | National Bank Of Canada /fi/ | 899 | 112,03 | 50 | 157,89 | ||||
| 2025-08-29 | 13F | Total Investment Management Inc | 1 | 0 | ||||||
| 2025-08-27 | 13F/A | Squarepoint Ops LLC | Put | 0 | -100,00 | 0 | -100,00 | |||
| 2025-08-27 | 13F/A | Squarepoint Ops LLC | Call | 0 | -100,00 | 0 | -100,00 | |||
| 2025-07-29 | 13F | Activest Wealth Management | 2.702 | 305,71 | 150 | 396,67 | ||||
| 2025-08-14 | 13F | Money Concepts Capital Corp | 1.221.775 | 8,33 | 67.772 | 31,02 | ||||
| 2025-07-29 | 13F | Salomon & Ludwin, LLC | 2.000 | 111 | ||||||
| 2025-08-14 | 13F | Gen-Wealth Partners Inc | 82 | 0,00 | 5 | 33,33 | ||||
| 2025-08-14 | 13F | Banque Transatlantique SA | 0 | -100,00 | 0 | |||||
| 2025-07-30 | 13F | Axecap Investments, LLC | 0 | -100,00 | 0 | -100,00 | ||||
| 2025-08-12 | 13F | Park Square Financial Group, LLC | 0 | -100,00 | 0 | |||||
| 2025-05-14 | 13F | Walleye Capital LLC | 0 | -100,00 | 0 | |||||
| 2025-07-30 | 13F | FNY Investment Advisers, LLC | 0 | -100,00 | 0 | |||||
| 2025-07-23 | 13F | Defined Financial Planning LLC | 4.169 | 235 | ||||||
| 2025-08-13 | 13F | Northwestern Mutual Wealth Management Co | 26.712 | 1.418,59 | 1.482 | 1.751,25 | ||||
| 2025-08-15 | 13F | Morgan Stanley | 46.677 | -3,99 | 2.589 | 16,15 | ||||
| 2025-07-14 | 13F | Capital CS Group, LLC | 24.772 | 76,56 | 1.374 | 113,69 | ||||
| 2025-07-10 | 13F | Clare Market Investments LLC | 0 | -100,00 | 0 | |||||
| 2025-08-01 | NP | APSHX - Pinnacle Sherman Multi-Strategy Core Fund Class A | 0 | -100,00 | 0 | -100,00 | ||||
| 2025-08-14 | 13F | Fmr Llc | 0 | -100,00 | 0 | |||||
| 2025-07-15 | 13F | Norden Group Llc | 9.041 | 1,39 | 502 | 22,79 | ||||
| 2025-05-29 | NP | GTAAX - Power Global Tactical Allocation/JAForlines Fund Class A | 42.874 | 1.966 | ||||||
| 2025-05-02 | 13F | Transcendent Capital Group LLC | 0 | -100,00 | 0 | |||||
| 2025-07-24 | 13F | Costello Asset Management, INC | 0 | -100,00 | 0 | |||||
| 2025-08-14 | 13F | AllSquare Wealth Management LLC | 100 | 0,00 | 6 | 25,00 | ||||
| 2025-08-14 | 13F | Two Sigma Securities, Llc | 0 | -100,00 | 0 | |||||
| 2025-07-30 | 13F | IMG Wealth Management, Inc. | 112 | 0,00 | 6 | 20,00 | ||||
| 2025-08-19 | 13F | Advisory Services Network, LLC | 4.117 | 241 | ||||||
| 2025-07-31 | 13F | Oppenheimer & Co Inc | 97.153 | -3,31 | 5.389 | 16,95 | ||||
| 2025-08-05 | 13F | Sigma Planning Corp | 26.448 | 262,75 | 1.467 | 339,22 | ||||
| 2025-07-25 | 13F | Stephens Consulting, LLC | 6 | 0,00 | 0 | |||||
| 2025-07-24 | 13F | Morton Brown Family Wealth, LLC | 8 | 0,00 | 0 | |||||
| 2025-08-14 | 13F | RMB Capital Management, LLC | 0 | -100,00 | 0 | |||||
| 2025-07-10 | 13F | Capital Advisory Group Advisory Services, LLC | 13.966 | 775 | ||||||
| 2025-08-08 | 13F | Avantax Advisory Services, Inc. | 6.370 | 353 | ||||||
| 2025-08-14 | 13F | Ausdal Financial Partners, Inc. | 8.396 | 466 | ||||||
| 2025-08-08 | 13F | Fortis Group Advisors, LLC | 61.705 | 3.615 | ||||||
| 2025-07-25 | 13F | Envestnet Portfolio Solutions, Inc. | 6.624 | -56,09 | 367 | -46,89 | ||||
| 2025-08-15 | 13F | Tower Research Capital LLC (TRC) | 127.645 | 7.080 | ||||||
| 2025-08-13 | 13F | Beacon Pointe Advisors, LLC | 5.030 | 7,92 | 279 | 30,99 | ||||
| 2025-08-14 | 13F | Vienna Asset Management LLC | 16.945 | 940 | ||||||
| 2025-08-14 | 13F | Raymond James Financial Inc | 6.318 | -6,81 | 350 | 12,90 | ||||
| 2025-08-14 | 13F | Massar Capital Management, LP | 56.000 | -42,86 | 3.106 | -30,89 | ||||
| 2025-08-14 | 13F | Jane Street Group, Llc | Call | 722.500 | 40.077 | |||||
| 2025-05-14 | 13F | Change Path, LLC | 0 | -100,00 | 0 | |||||
| 2025-08-06 | 13F | Legacy Wealth Managment, LLC/ID | 704 | -25,19 | 39 | -9,30 | ||||
| 2025-07-09 | 13F | Triumph Capital Management | 17.920 | 18,73 | 994 | 43,64 | ||||
| 2025-08-14 | 13F | Qube Research & Technologies Ltd | 264.521 | -36,57 | 14.673 | -23,25 | ||||
| 2025-07-24 | 13F | Fischer Investment Strategies, Llc | 21.620 | 1,77 | 1.199 | 23,10 | ||||
| 2025-08-12 | 13F | LPL Financial LLC | 51.567 | 272,14 | 2.860 | 350,39 | ||||
| 2025-08-08 | 13F | Kingsview Wealth Management, LLC | 7.004 | 30,50 | 389 | 57,72 | ||||
| 2025-08-14 | 13F | UBS Group AG | 95.914 | 801,79 | 5.320 | 992,40 | ||||
| 2025-08-18 | 13F | Wolverine Trading, Llc | Put | 84.600 | -42,37 | 4.702 | -30,41 | |||
| 2025-05-14 | 13F | Caitlin John, LLC | 0 | -100,00 | 0 | |||||
| 2025-08-18 | 13F | Wolverine Trading, Llc | 18.133 | -7,50 | 1.008 | 11,64 | ||||
| 2025-08-14 | 13F | CIBC World Markets Inc. | 0 | -100,00 | 0 | |||||
| 2025-08-11 | 13F | Private Advisor Group, LLC | 18.907 | 24,97 | 1.049 | 51,23 | ||||
| 2025-07-30 | NP | ENDW - Cambria Endowment Style ETF | 379 | 20 | ||||||
| 2025-04-14 | 13F | IMC-Chicago, LLC | 0 | -100,00 | 0 | |||||
| 2025-07-17 | 13F | Sound Income Strategies, LLC | 1.562 | 0,00 | 87 | 21,13 | ||||
| 2025-08-14 | 13F | Jane Street Group, Llc | Put | 91.500 | 5.076 | |||||
| 2025-04-24 | 13F | Wright Fund Managment, LLC | 0 | -100,00 | 0 | |||||
| 2025-05-01 | 13F | Grant/GrossMendelsohn, LLC | 31.541 | -17,17 | 1.461 | -29,54 | ||||
| 2025-07-15 | 13F | Xcel Wealth Management, LLC | 7.160 | 11,70 | 397 | 35,49 | ||||
| 2025-08-14 | 13F | Tudor Investment Corp Et Al | 0 | -100,00 | 0 | |||||
| 2025-08-13 | 13F | NINE MASTS CAPITAL Ltd | 53.725 | 2.980 | ||||||
| 2025-08-11 | 13F | Strategic Wealth Partners, Ltd. | 4.808 | 15,13 | 267 | 15,65 | ||||
| 2025-08-18 | 13F | Wolverine Trading, Llc | Call | 94.600 | -39,55 | 5.258 | -27,02 | |||
| 2025-07-10 | 13F | Exchange Traded Concepts, Llc | 276.011 | 15.310 | ||||||
| 2025-08-14 | 13F | Diversify Advisory Services, LLC | 6.824 | 54,28 | 413 | 100,49 | ||||
| 2025-07-28 | 13F | WealthPlan Investment Management, LLC | 6.049 | 2,08 | 336 | 23,62 | ||||
| 2025-08-14 | 13F | Paragon Private Wealth Management, LLC | 20.013 | 36,22 | 1.110 | 64,93 | ||||
| 2025-07-23 | 13F | Prime Capital Investment Advisors, LLC | 5.780 | -96,74 | 321 | -96,06 | ||||
| 2025-05-07 | 13F | University Of Texas/texas Am Investment Managment Co | 0 | -100,00 | 0 | |||||
| 2025-08-08 | 13F | Altfest L J & Co Inc | 64.345 | -56,26 | 3.569 | -47,09 | ||||
| 2025-08-14 | 13F | CoreCap Advisors, LLC | 50.323 | 36,79 | 2.791 | 65,44 | ||||
| 2025-08-12 | 13F | Proequities, Inc. | 0 | 0 | ||||||
| 2025-08-04 | 13F | Kovack Advisors, Inc. | 6.584 | 365 | ||||||
| 2025-07-18 | 13F | New Wave Wealth Advisors Llc | 6.407 | 24,99 | 355 | 51,06 | ||||
| 2025-08-01 | 13F | Liberty Wealth Management Llc | 0 | -100,00 | 0 | |||||
| 2025-08-07 | 13F | PFG Advisors | 4.804 | 266 | ||||||
| 2025-08-13 | 13F | Advisor Group Holdings, Inc. | 148.225 | 83,43 | 8.082 | 118,11 | ||||
| 2025-08-11 | 13F | Principal Securities, Inc. | 31.340 | 47,57 | 1.738 | 50,48 | ||||
| 2025-07-16 | 13F | Maridea Wealth Management LLC | 0 | -100,00 | 0 | -100,00 | ||||
| 2025-08-13 | 13F | Victory Financial Group, Llc | 20.372 | 69,48 | 1.130 | 105,08 | ||||
| 2025-08-18 | 13F | Geneos Wealth Management Inc. | 0 | -100,00 | 0 | -100,00 | ||||
| 2025-08-13 | 13F | Oxler Private Wealth LLC | 10.253 | 569 | ||||||
| 2025-08-14 | 13F | Royal Bank Of Canada | 73.058 | 61,37 | 4.053 | 95,23 | ||||
| 2025-08-11 | 13F | Cornerstone Planning Group LLC | 64 | 4 | ||||||
| 2025-07-18 | 13F | PFG Investments, LLC | 9.740 | -3,01 | 540 | 17,39 | ||||
| 2025-08-08 | 13F | Donoghue Forlines LLC | 0 | -100,00 | 0 | |||||
| 2025-08-05 | 13F | Milestone Asset Management, Llc | 9.510 | -11,23 | 528 | 7,33 | ||||
| 2025-08-08 | 13F | City Of London Investment Management Co Ltd | 9.845 | 546 | ||||||
| 2025-07-21 | 13F | Fortis Capital Advisors, LLC | 9.015 | -38,30 | 500 | -25,37 | ||||
| 2025-05-29 | NP | Northern Lights Fund Trust - Sierra Tactical Risk Spectrum 30 Fund Instl Class | 0 | -100,00 | 0 | -100,00 | ||||
| 2025-05-29 | NP | Northern Lights Fund Trust - Sierra Tactical Risk Spectrum 50 Fund Investor Class | 0 | -100,00 | 0 | -100,00 | ||||
| 2025-07-22 | 13F | Unique Wealth, Llc | 8.021 | -0,02 | 445 | 20,98 | ||||
| 2025-07-23 | 13F | Kingswood Wealth Advisors, Llc | 6.800 | 25,93 | 377 | 50,20 | ||||
| 2025-07-15 | 13F | Graypoint LLC | 419.571 | 23.274 | ||||||
| 2025-08-07 | 13F | Midland Wealth Advisors Llc | 116.224 | -0,40 | 6.447 | 20,46 | ||||
| 2025-05-29 | NP | SIRAX - Sierra Tactical All Asset Fund Class A | 0 | -100,00 | 0 | -100,00 | ||||
| 2025-07-30 | 13F | Bogart Wealth, LLC | 452 | 0,00 | 25 | 25,00 | ||||
| 2025-05-29 | NP | Northern Lights Fund Trust - Sierra Tactical Core Growth Fund Investor Class Shares | 0 | -100,00 | 0 | -100,00 | ||||
| 2025-05-29 | NP | Northern Lights Fund Trust - Sierra Tactical Risk Spectrum 70 Fund Investor Class | 0 | -100,00 | 0 | -100,00 | ||||
| 2025-08-08 | 13F | Cetera Investment Advisers | 0 | -100,00 | 0 | |||||
| 2025-08-12 | 13F | Global Retirement Partners, LLC | 111 | 6 | ||||||
| 2025-04-16 | 13F | Wealth Enhancement Advisory Services, Llc | 0 | -100,00 | 0 | |||||
| 2025-07-21 | 13F | Mirae Asset Global Investments Co., Ltd. | 17.950 | -17,58 | 996 | -0,70 | ||||
| 2025-08-12 | 13F | Trexquant Investment LP | 5.608 | 311 | ||||||
| 2025-08-15 | 13F | Kestra Advisory Services, LLC | 22.250 | 26,48 | 1.234 | 53,10 | ||||
| 2025-08-14 | 13F | Ieq Capital, Llc | 32.114 | 233,96 | 1.781 | 303,85 | ||||
| 2025-07-31 | 13F | Carnegie Capital Asset Management, LLC | 8.304 | -42,23 | 461 | -22,82 | ||||
| 2025-07-23 | 13F | IMZ Advisory Inc | 140.182 | 15,41 | 8.017 | 43,93 | ||||
| 2025-07-21 | 13F | Jackson Wealth Management, LLC | 49.950 | 0,83 | 2.771 | 21,96 | ||||
| 2025-08-13 | 13F | Twin Peaks Wealth Advisors, LLC | 929 | 56 | ||||||
| 2025-08-06 | 13F | Prospera Financial Services Inc | 3.680 | 204 | ||||||
| 2025-08-14 | 13F | Mml Investors Services, Llc | 38.873 | -74,60 | 2 | -71,43 | ||||
| 2025-04-30 | 13F | J Hagan Capital, Inc. | 3.757 | 204 | ||||||
| 2025-07-14 | 13F | Iams Wealth Management, Llc | 7.335 | 26,49 | 407 | 53,21 | ||||
| 2025-08-01 | 13F | Envestnet Asset Management Inc | 68.699 | -72,08 | 3.811 | -66,23 | ||||
| 2025-05-14 | 13F | Susquehanna International Group, Llp | 0 | -100,00 | 0 | -100,00 | ||||
| 2025-07-25 | 13F | waypoint wealth counsel | 4.102 | 228 | ||||||
| 2025-08-08 | 13F | Advyzon Investment Management, LLC | 7.923 | -12,50 | 439 | 5,78 | ||||
| 2025-08-12 | 13F | Insigneo Advisory Services, Llc | 12.610 | 26,49 | 699 | 52,95 | ||||
| 2025-08-14 | 13F | Federation des caisses Desjardins du Quebec | 20.780 | 12,10 | 1.152 | 35,53 | ||||
| 2025-08-11 | 13F | Brown Brothers Harriman & Co | 76 | 0,00 | 4 | 33,33 | ||||
| 2025-08-14 | 13F | Mariner, LLC | 180.120 | 6,03 | 9.991 | 28,25 | ||||
| 2025-08-12 | 13F | Integrated Advisors Network LLC | 39.221 | 5,12 | 2.176 | 27,12 | ||||
| 2025-05-14 | 13F | Flow Traders U.s. Llc | 0 | -100,00 | 0 | |||||
| 2025-08-15 | 13F | Cooksen Wealth, LLC | 17.096 | 948 | ||||||
| 2025-08-29 | 13F | Centaurus Financial, Inc. | 31.752 | -2,16 | 2 | 0,00 | ||||
| 2025-08-13 | 13F | Cerity Partners LLC | 9.570 | 13,16 | 531 | 36,95 | ||||
| 2025-08-14 | 13F | Murphy & Mullick Capital Management Corp | 725 | 156,18 | 42 | 250,00 | ||||
| 2025-07-09 | 13F | Reyes Financial Architecture, Inc. | 0 | -100,00 | 0 | |||||
| 2025-05-09 | 13F | Pamalican Asset Management Ltd | 0 | -100,00 | 0 | |||||
| 2025-08-14 | 13F | Balyasny Asset Management Llc | 103.460 | 86,01 | 5.739 | 125,02 | ||||
| 2025-05-16 | 13F | Arete Wealth Advisors, LLC | 0 | -100,00 | 0 | |||||
| 2025-07-14 | 13F | AdvisorNet Financial, Inc | 685 | 38 | ||||||
| 2025-08-06 | 13F | Commonwealth Equity Services, Llc | 218.880 | 2,05 | 12 | 33,33 | ||||
| 2025-07-25 | 13F | Cwm, Llc | 1.899 | 15,16 | 0 | |||||
| 2025-08-15 | 13F | Captrust Financial Advisors | 8.311 | 28,36 | 461 | 55,74 | ||||
| 2025-08-08 | 13F | Hartland & Co., LLC | 6.922 | 384 | ||||||
| 2025-08-14 | 13F | Susquehanna International Group, Llp | Put | 432.200 | -45,98 | 23.974 | -34,66 | |||
| 2025-08-14 | 13F | Susquehanna International Group, Llp | Call | 835.300 | 172,26 | 46.334 | 229,33 | |||
| 2025-08-13 | 13F | Maia Wealth LLC | 4.439 | -35,81 | 246 | -20,65 | ||||
| 2025-08-06 | 13F | Wedbush Securities Inc | 7.326 | 0 | ||||||
| 2025-08-14 | 13F | Talon Private Wealth, LLC | 66.599 | 3.694 | ||||||
| 2025-07-25 | 13F | PrairieView Partners, LLC | 28 | 154,55 | 0 | |||||
| 2025-04-22 | 13F | Castleview Partners, Llc | 0 | -100,00 | 0 | -100,00 | ||||
| 2025-07-15 | 13F | BigSur Wealth Management LLC | 32.000 | -28,89 | 1.775 | -13,96 | ||||
| 2025-07-31 | 13F | Cambridge Investment Research Advisors, Inc. | 183.254 | 56,54 | 10 | 100,00 | ||||
| 2025-05-07 | 13F | Vista Private Wealth Partners. LLC | 0 | -100,00 | 0 | |||||
| 2025-08-12 | 13F | J.w. Cole Advisors, Inc. | 18.682 | 15,06 | 1.036 | 39,25 | ||||
| 2025-07-25 | 13F | Atria Wealth Solutions, Inc. | 118.472 | 72,01 | 6.572 | 108,07 | ||||
| 2025-08-14 | 13F | Hrt Financial Lp | 0 | -100,00 | 0 | |||||
| 2025-05-15 | 13F | Scoggin Management Lp | Call | 0 | -100,00 | 0 | -100,00 | |||
| 2025-08-12 | 13F | Steward Partners Investment Advisory, Llc | 2.420 | -95,29 | 134 | -94,31 | ||||
| 2025-08-28 | 13F | China Universal Asset Management Co., Ltd. | 0 | -100,00 | 0 | |||||
| 2025-07-24 | 13F | Blair William & Co/il | 5.805 | -32,65 | 322 | -18,48 | ||||
| 2025-08-01 | 13F | Belvedere Trading LLC | Call | 8.500 | 471 | |||||
| 2025-04-22 | 13F | Synergy Financial Management, LLC | 0 | -100,00 | 0 | |||||
| 2025-08-01 | 13F | Belvedere Trading LLC | Put | 600 | 33 | |||||
| 2025-07-28 | 13F | RFG Advisory, LLC | 113.982 | -6,70 | 6.323 | 12,85 | ||||
| 2025-08-04 | 13F | Creative Financial Designs Inc /adv | 78 | -32,17 | 4 | -20,00 | ||||
| 2025-08-15 | 13F | Concentric Capital Strategies, LP | 180.825 | -66,40 | 10.030 | -59,36 | ||||
| 2025-07-25 | 13F | Concurrent Investment Advisors, LLC | 21.091 | 1.170 | ||||||
| 2025-08-11 | 13F | Goodman Financial Corp | 4.135 | 229 | ||||||
| 2025-08-12 | 13F | Boxwood Ventures, Inc. | 12.000 | 0,00 | 666 | 20,91 | ||||
| 2025-08-13 | 13F | Financial Freedom, LLC | 7.345 | 145,90 | 407 | 199,26 | ||||
| 2025-08-14 | 13F | Comerica Bank | 254 | 14 | ||||||
| 2025-08-14 | 13F | GWM Advisors LLC | 12.968 | 32,87 | 719 | 60,85 | ||||
| 2025-08-13 | 13F | Townsquare Capital Llc | 0 | -100,00 | 0 | |||||
| 2025-08-06 | 13F | Legacy Investment Solutions, LLC | 704 | 39 | ||||||
| 2025-07-10 | 13F | Three Seasons Wealth, LLC | 6.963 | 0,00 | 386 | 21,00 | ||||
| 2025-04-22 | 13F | FSC Wealth Advisors, LLC | 0 | -100,00 | 0 | |||||
| 2025-07-09 | 13F | Key Client Fiduciary Advisors, LLC | 24.074 | 1,39 | 1.335 | 22,70 | ||||
| 2025-08-13 | 13F | Marshall Wace, Llp | 258.125 | 14.318 | ||||||
| 2025-07-28 | 13F | Evernest Financial Advisors, LLC | 0 | -100,00 | 0 | |||||
| 2025-07-31 | 13F | Sage Mountain Advisors LLC | 6.100 | 338 | ||||||
| 2025-05-13 | 13F | Elevatus Welath Management | 0 | -100,00 | 0 | |||||
| 2025-07-30 | 13F | BlueChip Wealth Advisors LLC | 20.833 | 1.156 | ||||||
| 2025-08-14 | 13F | Jane Street Group, Llc | 0 | -100,00 | 0 | -100,00 | ||||
| 2025-08-14 | 13F | Integrated Wealth Concepts LLC | 12.903 | 716 | ||||||
| 2025-08-27 | 13F/A | Brinker Capital Investments, LLC | 54.283 | 23,40 | 3.011 | 49,28 | ||||
| 2025-07-17 | 13F | Janney Montgomery Scott LLC | 14.966 | -38,11 | 1 | -100,00 | ||||
| 2025-07-07 | 13F | Thurston, Springer, Miller, Herd & Titak, Inc. | 100 | 0,00 | 6 | 25,00 | ||||
| 2025-08-08 | 13F | Creative Planning | 13.804 | -5,09 | 766 | 14,86 | ||||
| 2025-07-23 | 13F | Trifecta Capital Advisors, LLC | 1.000 | 0,00 | 55 | 22,22 | ||||
| 2025-07-22 | 13F | Wealthcare Advisory Partners LLC | 11.151 | 619 | ||||||
| 2025-08-18 | 13F | Tactive Advisors, LLC | 61.426 | 3.407 | ||||||
| 2025-08-19 | 13F | Newbridge Financial Services Group, Inc. | 0 | -100,00 | 0 | |||||
| 2025-05-06 | 13F | WT Wealth Management | 12.888 | 591 | ||||||
| 2025-08-07 | 13F | Runnymede Capital Advisors, Inc. | 0 | -100,00 | 0 | |||||
| 2025-07-22 | 13F | Belpointe Asset Management LLC | 33.792 | -36,69 | 1.874 | -23,42 | ||||
| 2025-08-12 | 13F | Jpmorgan Chase & Co | 67.924 | 3.768 | ||||||
| 2025-07-01 | 13F | Harbor Investment Advisory, Llc | 580 | 32 | ||||||
| 2025-08-06 | 13F | AE Wealth Management LLC | 0 | -100,00 | 0 | |||||
| 2025-06-27 | 13F | Copley Financial Group, Inc. | 42 | 0,00 | 2 | 0,00 | ||||
| 2025-08-05 | 13F | Bank Of Montreal /can/ | 5.461 | -26,93 | 303 | -11,70 | ||||
| 2025-08-14 | 13F | Boothbay Fund Management, Llc | 6.700 | 372 | ||||||
| 2025-08-14 | 13F | Goldman Sachs Group Inc | 24.935 | 146,25 | 1.383 | 198,06 | ||||
| 2025-07-17 | 13F | Catalytic Wealth RIA, LLC | 7.122 | -12,21 | 395 | 6,18 | ||||
| 2025-07-11 | 13F | Farther Finance Advisors, LLC | 8 | 0 | ||||||
| 2025-08-08 | 13F | Foundations Investment Advisors, LLC | 11.815 | 655 | ||||||
| 2025-07-24 | 13F | Us Bancorp \de\ | 599 | 0,00 | 33 | 22,22 | ||||
| 2025-08-14 | 13F | IHT Wealth Management, LLC | 5.054 | -1,46 | 280 | 19,15 | ||||
| 2025-07-25 | 13F | Hazlett, Burt & Watson, Inc. | 704 | 0,00 | 0 | |||||
| 2025-08-13 | 13F | Smith, Moore & Co. | 8.535 | 473 | ||||||
| 2025-08-14 | 13F | Warren Averett Asset Management, LLC | 31.592 | -4,20 | 1.752 | 15,87 | ||||
| 2025-07-29 | 13F | International Assets Investment Management, Llc | 5.430 | 8,47 | 301 | 31,44 | ||||
| 2025-08-08 | 13F | SG Americas Securities, LLC | 13.390 | 1 | ||||||
| 2025-08-12 | 13F | SRS Capital Advisors, Inc. | 2.776 | 77,61 | 154 | 115,49 | ||||
| 2025-07-07 | 13F | Investors Research Corp | 240 | 0,00 | 13 | 18,18 | ||||
| 2025-07-21 | 13F | Ameritas Advisory Services, LLC | 9.053 | 67,93 | 502 | 103,24 | ||||
| 2025-07-21 | 13F | Ameriflex Group, Inc. | 2.090 | -25,94 | 115 | -11,63 | ||||
| 2025-08-05 | 13F | Strategic Financial Concepts, LLC | 6.180 | 343 | ||||||
| 2025-08-08 | 13F | Comprehensive Financial Planning, Inc./PA | 35.790 | 7,83 | 1.985 | 30,42 | ||||
| 2025-08-14 | 13F | Group One Trading, L.p. | 300.373 | 16.662 | ||||||
| 2025-07-14 | 13F | Capital CS Group, LLC | Call | 0 | -100,00 | 0 | -100,00 | |||
| 2025-05-09 | 13F | Belvedere Trading LLC | 0 | -100,00 | 0 | -100,00 | ||||
| 2025-08-14 | 13F | Bnp Paribas | 7.851 | 438 | ||||||
| 2025-08-06 | 13F | First Horizon Advisors, Inc. | 0 | -100,00 | 0 | |||||
| 2025-07-28 | 13F | Harbour Investments, Inc. | 45.726 | 0,30 | 2.536 | 21,34 | ||||
| 2025-08-18 | 13F/A | Nomura Holdings Inc | Call | 1.000.000 | 0,00 | 55.470 | 20,96 | |||
| 2025-07-02 | 13F | HBW Advisory Services LLC | 8.968 | -15,67 | 497 | 2,05 | ||||
| 2025-08-18 | 13F/A | Nomura Holdings Inc | Put | 1.000.000 | 0,00 | 55.470 | 20,96 | |||
| 2025-08-07 | 13F | Kestra Private Wealth Services, Llc | 4.774 | 265 | ||||||
| 2025-08-14 | 13F | Millennium Management Llc | 187.696 | 66,34 | 10.411 | 101,22 | ||||
| 2025-07-16 | 13F | ORG Partners LLC | 35 | 0,00 | 2 | 0,00 | ||||
| 2025-08-14 | 13F | Bank Of America Corp /de/ | 36.855 | 331,05 | 2.044 | 421,43 | ||||
| 2025-04-22 | 13F | Petra Financial Advisors Inc | 0 | -100,00 | 0 | |||||
| 2025-07-15 | 13F | World Equity Group, Inc. | 12.708 | 36,91 | 705 | 65,65 | ||||
| 2025-07-16 | 13F | Twelve Points Wealth Management LLC | 5.050 | 280 | ||||||
| 2025-08-12 | 13F | MAI Capital Management | 43 | 2 | ||||||
| 2025-07-09 | 13F | Krilogy Financial LLC | 10.849 | -29,23 | 602 | -14,51 | ||||
| 2025-08-01 | 13F | Anson Capital, Inc. | 4.443 | 0,00 | 246 | 21,18 | ||||
| 2025-07-08 | 13F | Parallel Advisors, LLC | 285 | -61,22 | 16 | -54,55 | ||||
| 2025-07-18 | 13F | Bartlett & Co. Wealth Management Llc | 0 | -100,00 | 0 | |||||
| 2025-08-12 | 13F | American Asset Management Inc. | 4.518 | 0,00 | 251 | 20,77 | ||||
| 2025-08-04 | 13F | Creekmur Asset Management LLC | 648 | 3,51 | 36 | 25,00 |
Other Listings
| PE:MAGS |