Statistiche di base
| Proprietari istituzionali | 182 total, 182 long only, 0 short only, 0 long/short - change of 5,14% MRQ |
| Allocazione media del portafoglio | 0.2604 % - change of -21,35% MRQ |
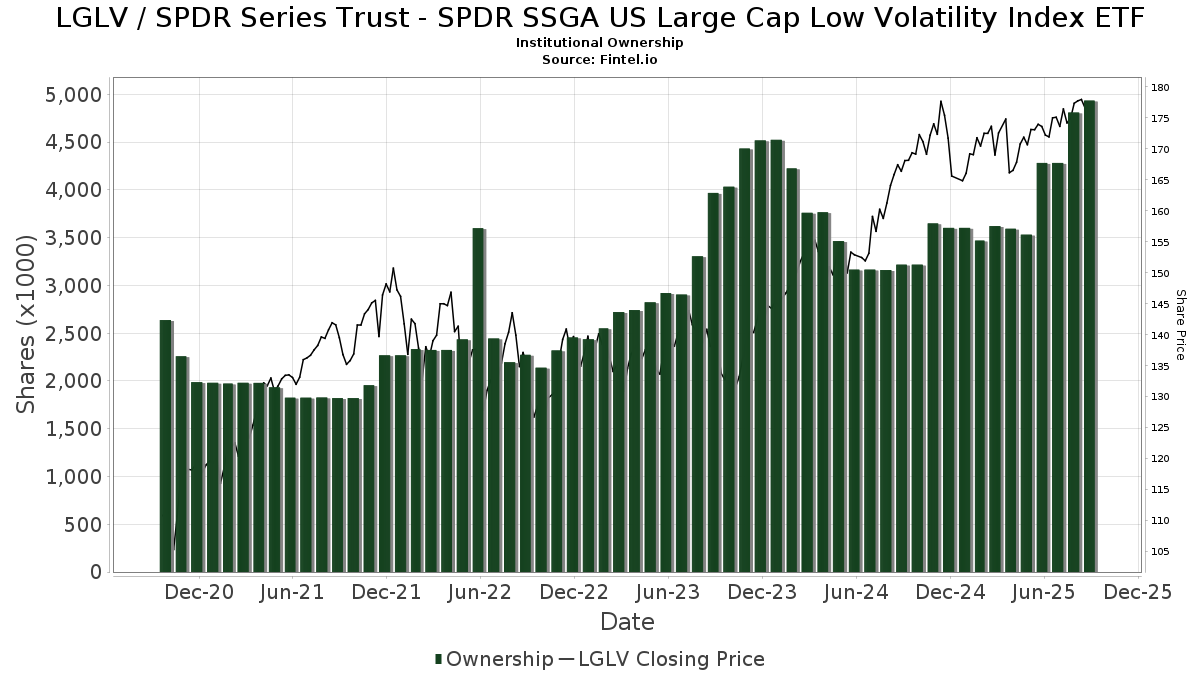
| Azioni istituzionali (Long) | 4.936.891 (ex 13D/G) - change of 0,65MM shares 15,25% MRQ |
| Valore istituzionale (Long) | $ 609.608 USD ($1000) |
Proprietà istituzionale e azionisti
SPDR Series Trust - SPDR SSGA US Large Cap Low Volatility Index ETF (US:LGLV) ha 182 proprietari istituzionali e azionisti che hanno presentato i moduli 13D/G o 13F alla Securities Exchange Commission (SEC). Queste istituzioni detengono un totale di 4,936,891 azioni. I maggiori azionisti includono Cwm, Llc, Syntegra Private Wealth Group, LLC, Baltimore-Washington Financial Advisors, Inc., Gerber Kawasaki Wealth & Investment Management, LPL Financial LLC, Congress Wealth Management LLC / DE /, Jpmorgan Chase & Co, Morgan Stanley, DORVAL Corp, and State Street Corp .
(SPDR Series Trust - SPDR SSGA US Large Cap Low Volatility Index ETF (ARCA:LGLV) la struttura proprietaria istituzionale mostra le attuali posizioni nella società da parte di istituzioni e fondi, nonché le ultime variazioni nella dimensione della posizione. I principali azionisti possono essere singoli investitori, fondi comuni, hedge fund o istituzioni. L'allegato 13D indica che l'investitore detiene (o ha detenuto) più del 5% della società e intende (o intendeva) perseguire attivamente un cambiamento nella strategia aziendale. L'allegato 13G indica un investimento passivo superiore al 5%.
The share price as of September 5, 2025 is 177,30 / share. Previously, on September 9, 2024, the share price was 166,91 / share. This represents an increase of 6,23% over that period.
Indice del sentiment dei fondi
L'indice del sentiment dei fondi (anche noto come "indice di accumulo di proprietà") individua i titoli più acquistati dai fondi. È il risultato di un sofisticato modello quantitativo multi-fattore che identifica le società con i più alti livelli di accumulo istituzionale. Il modello utilizza una combinazione dell'aumento totale dei proprietari dichiarati, delle variazioni nelle allocazioni di portafoglio di tali proprietari e di altre metriche. Il punteggio varia da 0 a 100: i numeri più alti indicano un livello di accumulo superiore ad altre società, mentre 50 rappresenta la media.
Frequenza di aggiornamento: giornaliera
Consulta Ownership Explorer per visualizzare l'elenco delle aziende con il ranking più alto.
Rapporto put/call istituzionale
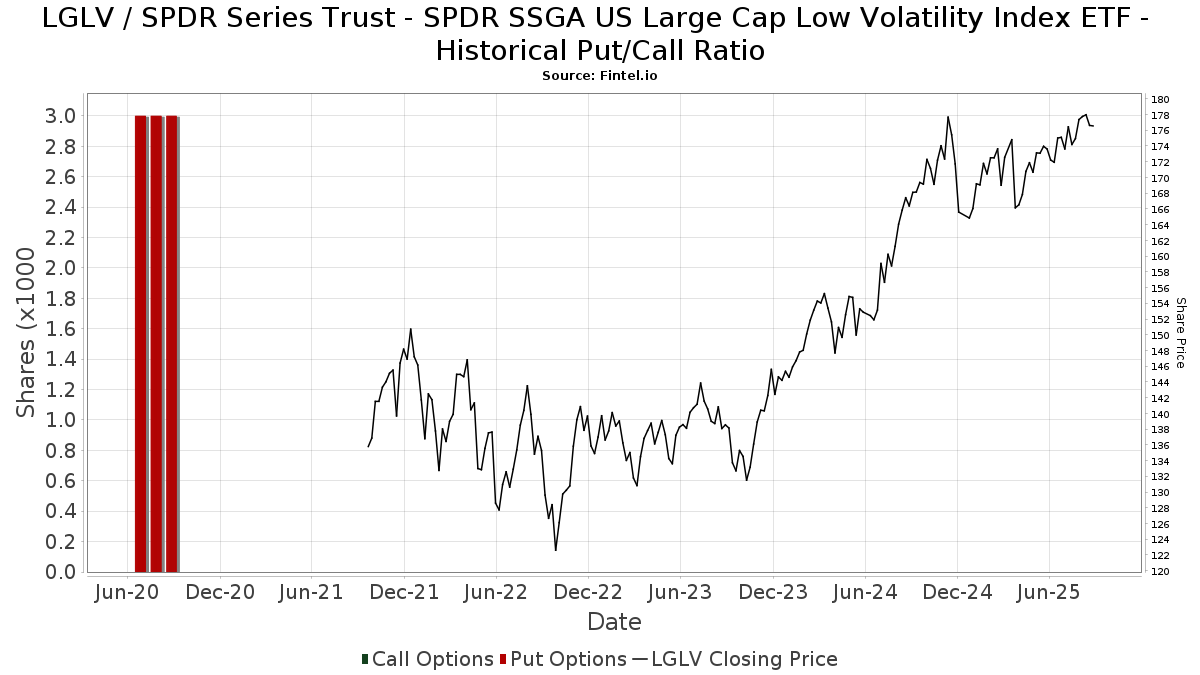
Oltre a segnalare le emissioni standard di titoli azionari e di debito, gli istituti con più di 100 milioni di asset in gestione devono anche dichiarare le loro partecipazioni in opzioni put e call. Poiché le opzioni put indicano generalmente un sentiment negativo e le opzioni call un sentiment positivo, possiamo avere un'idea del sentiment istituzionale complessivo attraverso il rapporto tra put e call. Il grafico a destra mostra il rapporto storico put/call per questo strumento.
L'utilizzo del rapporto put/call come indicatore del sentiment degli investitori consente di superare una delle principali lacune dell'utilizzo della proprietà istituzionale totale, ovvero il fatto che una quantità significativa di asset in gestione viene investita passivamente per seguire gli indici. Generalmente, i fondi a gestione passiva non acquistano opzioni, per cui il rapporto put/call riflette più fedelmente il sentiment dei fondi a gestione attiva.
Depositi 13F e NPORT
Le informazioni relative ai depositi 13F sono gratuite. Per accedere alle informazioni relative ai depositi NP è necessario un'abbonamento premium. Le righe verdi indicano le nuove posizioni. Le righe rosse indicano le posizioni chiuse. Fai clic sull'icona del link per visualizzare la cronologia completa delle transazioni.
Esegui l'upgrade
per sbloccare i dati premium ed esportarli in Excel ![]() .
.
| Data di deposito | Fonte | Investitore | Tipo | Prezzo medio (Stima) |
Azioni | Δ Azioni (%) |
Valore dichiarato ($ 1000) |
Δ Valore (%) |
Allocazione del portafoglio (%) |
|
|---|---|---|---|---|---|---|---|---|---|---|
| 2025-07-31 | 13F | Sage Mountain Advisors LLC | 18.958 | 0,00 | 3.310 | 0,33 | ||||
| 2025-08-05 | 13F | Hutchens & Kramer Investment Management Group, LLC | 3.209 | -5,09 | 564 | -4,25 | ||||
| 2025-07-16 | 13F/A | CX Institutional | 41 | 0,00 | 0 | |||||
| 2025-08-14 | 13F | Avant Capital LLC | 3.246 | 3,34 | 567 | 3,66 | ||||
| 2025-07-30 | 13F | Paul Damon & Associates, Inc. | 6.183 | -0,48 | 1.080 | -0,19 | ||||
| 2025-08-14 | 13F | Mercer Global Advisors Inc /adv | 1.786 | -5,30 | 312 | -5,18 | ||||
| 2025-07-29 | 13F | Stratos Wealth Partners, LTD. | 2.683 | -4,49 | 469 | -4,10 | ||||
| 2025-08-14 | 13F | Qube Research & Technologies Ltd | 90 | 16 | ||||||
| 2025-08-04 | 13F | Integrity Alliance, Llc. | 57.768 | -35,15 | 10.087 | -34,95 | ||||
| 2025-08-05 | 13F | Tsfg, Llc | 3.718 | -0,99 | 1 | |||||
| 2025-07-22 | 13F | Legacy Trust | 0 | -100,00 | 0 | |||||
| 2025-07-29 | 13F | Private Trust Co Na | 901 | -6,24 | 157 | -5,99 | ||||
| 2025-07-21 | 13F | Ameriflex Group, Inc. | 91 | 0,00 | 16 | 0,00 | ||||
| 2025-07-31 | 13F | Cambridge Investment Research Advisors, Inc. | 12.828 | -42,54 | 2 | -33,33 | ||||
| 2025-08-01 | 13F | Brookwood Investment Group LLC | 1.703 | 0,00 | 297 | 0,34 | ||||
| 2025-07-11 | 13F | SILVER OAK SECURITIES, Inc | 0 | -100,00 | 0 | |||||
| 2025-08-08 | 13F | Avantax Advisory Services, Inc. | 4.751 | -41,97 | 830 | -41,78 | ||||
| 2025-08-11 | 13F | Wealthgarden F.s. Llc | 1.665 | -3,42 | 289 | -4,00 | ||||
| 2025-08-27 | 13F | Barnes Wealth Management Group, Inc | 3.713 | 39,90 | 648 | 40,56 | ||||
| 2025-07-16 | 13F | Signaturefd, Llc | 530 | 0,00 | 93 | 0,00 | ||||
| 2025-07-25 | 13F | Atria Wealth Solutions, Inc. | 1.311 | 229 | ||||||
| 2025-08-14 | 13F | Goldman Sachs Group Inc | 10.760 | -65,02 | 1.879 | -64,92 | ||||
| 2025-08-11 | 13F | Western Wealth Management, LLC | 1.341 | 0,00 | 234 | 0,43 | ||||
| 2025-08-12 | 13F | Financial Advocates Investment Management | 6.961 | -2,81 | 1.215 | -2,49 | ||||
| 2025-07-22 | 13F | Iowa State Bank | 1.660 | -31,09 | 290 | -31,03 | ||||
| 2025-07-29 | 13F | Portland Financial Advisors Inc | 6.062 | 0,00 | 1.058 | 0,28 | ||||
| 2025-08-12 | 13F | Steward Partners Investment Advisory, Llc | 1.501 | -3,22 | 262 | -2,60 | ||||
| 2025-08-11 | 13F | Berkeley, Inc | 2.740 | 0,18 | 478 | 0,42 | ||||
| 2025-05-12 | 13F | Independent Advisor Alliance | 0 | -100,00 | 0 | |||||
| 2025-08-14 | 13F | IHT Wealth Management, LLC | 8.270 | 3,79 | 1.444 | 4,18 | ||||
| 2025-07-16 | 13F | Independent Wealth Network Inc. | 5.970 | -2,56 | 1.042 | -2,25 | ||||
| 2025-08-14 | 13F | Harwood Advisory Group, LLC | 2.254 | -19,64 | 394 | -15,12 | ||||
| 2025-08-13 | 13F | Millington Financial Advisors, LLC | 1.734 | -2,42 | 306 | 3,39 | ||||
| 2025-08-14 | 13F | Bank Of America Corp /de/ | 91.399 | 4,63 | 15.959 | 4,98 | ||||
| 2025-08-06 | 13F | Wedbush Securities Inc | 3.890 | -4,14 | 1 | |||||
| 2025-08-18 | 13F | Geneos Wealth Management Inc. | 369 | 5,43 | 64 | 6,67 | ||||
| 2025-07-31 | 13F | Moloney Securities Asset Management, LLC | 1.379 | -5,87 | 241 | -5,51 | ||||
| 2025-08-26 | 13F/A | Thrivent Financial For Lutherans | 2.261 | 0 | ||||||
| 2025-08-11 | 13F | Vista Cima Wealth Management LLC | 3.044 | 0,00 | 532 | 0,38 | ||||
| 2025-08-14 | 13F | Comerica Bank | 311 | -1,27 | 54 | 0,00 | ||||
| 2025-08-14 | 13F | Daiwa Securities Group Inc. | 9.500 | -5,19 | 2 | 0,00 | ||||
| 2025-08-15 | 13F | Equitable Holdings, Inc. | 0 | -100,00 | 0 | |||||
| 2025-07-30 | 13F | Advantage Trust Co | 219 | 38 | ||||||
| 2025-08-13 | 13F | Fisher Asset Management, LLC | 1.227 | 0,00 | 214 | 0,47 | ||||
| 2025-08-12 | 13F | Jpmorgan Chase & Co | 175.531 | 148,74 | 30.649 | 149,56 | ||||
| 2025-07-09 | 13F | Riversedge Advisors, Llc | 4.936 | -17,86 | 862 | -17,61 | ||||
| 2025-07-17 | 13F | ERn Financial, LLC | 0 | -100,00 | 0 | |||||
| 2025-08-08 | 13F | Fortis Group Advisors, LLC | 7.210 | -2,96 | 1.251 | -3,33 | ||||
| 2025-08-11 | 13F | First American Trust, Fsb | 32.117 | 3,78 | 5.608 | 4,10 | ||||
| 2025-08-06 | 13F | Paladin Advisory Group, LLC | 304 | 0,00 | 53 | 1,92 | ||||
| 2025-08-06 | 13F | Founders Financial Securities Llc | 74.041 | 81,50 | 12.928 | 87,44 | ||||
| 2025-08-14 | 13F | Abound Financial, Llc | 4.558 | -2,25 | 796 | -1,97 | ||||
| 2025-08-14 | 13F | Mariner, LLC | 10.089 | 19,47 | 1.762 | 19,88 | ||||
| 2025-07-09 | 13F | Reyes Financial Architecture, Inc. | 40 | 0,00 | 7 | 0,00 | ||||
| 2025-08-13 | 13F | Jones Financial Companies Lllp | 2.409 | 44,25 | 418 | 45,30 | ||||
| 2025-08-06 | 13F | Atlantic Union Bankshares Corp | 17 | 3 | ||||||
| 2025-07-25 | 13F | Cwm, Llc | 1.380.611 | 69,48 | 241 | 70,92 | ||||
| 2025-08-15 | 13F | Tower Research Capital LLC (TRC) | 472 | -79,97 | 82 | -80,00 | ||||
| 2025-07-28 | 13F | Harbour Investments, Inc. | 4.237 | 2,96 | 740 | 3,21 | ||||
| 2025-08-14 | 13F | Aqr Capital Management Llc | 67.466 | 3,39 | 11.780 | 3,73 | ||||
| 2025-08-14 | 13F | Prestige Wealth Management Group LLC | 0 | -100,00 | 0 | |||||
| 2025-08-14 | 13F | Sei Investments Co | 25.127 | -6,77 | 4.387 | -6,46 | ||||
| 2025-07-22 | 13F | McNaughton Wealth Management, LLC | 15.834 | 4,38 | 2.765 | 4,70 | ||||
| 2025-07-21 | 13F | Investment Planning Advisors, Inc. | 1.300 | 0,00 | 227 | 0,00 | ||||
| 2025-08-12 | 13F | SRS Capital Advisors, Inc. | 619 | 0,49 | 108 | 0,93 | ||||
| 2025-08-14 | 13F | GWM Advisors LLC | 667 | -76,93 | 116 | -76,94 | ||||
| 2025-04-21 | 13F | Nelson, Van Denburg & Campbell Wealth Management Group, LLC | 0 | -100,00 | 0 | |||||
| 2025-08-08 | 13F | Capital Investment Advisory Services, LLC | 17 | 0,00 | 3 | 0,00 | ||||
| 2025-07-28 | 13F | Cypress Wealth Services, LLC | 5.166 | 0,00 | 902 | 0,33 | ||||
| 2025-07-11 | 13F | Mallini Complete Financial Planning LLC | 430 | 2,63 | ||||||
| 2025-08-11 | 13F | Private Advisor Group, LLC | 6.537 | 0,23 | 1.141 | 0,53 | ||||
| 2025-07-24 | 13F | Stonebridge Financial Group, LLC | 1.330 | 232 | ||||||
| 2025-08-01 | 13F | Envestnet Asset Management Inc | 13.241 | 14,52 | 2.312 | 14,91 | ||||
| 2025-08-08 | 13F | Thrive Capital Management, LLC | 5.256 | 918 | ||||||
| 2025-08-14 | 13F | Old Mission Capital Llc | 0 | -100,00 | 0 | |||||
| 2025-08-14 | 13F | Stifel Financial Corp | 1.442 | -66,37 | 252 | -66,35 | ||||
| 2025-08-08 | 13F | Good Life Advisors, LLC | 2.350 | 410 | ||||||
| 2025-05-15 | 13F | Gts Securities Llc | 0 | -100,00 | 0 | |||||
| 2025-08-14 | 13F | Two Sigma Investments, Lp | 21.410 | 3.738 | ||||||
| 2025-04-11 | 13F | Signal Advisors Wealth, LLC | 0 | -100,00 | 0 | |||||
| 2025-08-06 | 13F | Ethos Financial Group, LLC | 37.037 | 88,81 | 6.467 | 89,45 | ||||
| 2025-08-13 | 13F | Gateway Wealth Partners, LLC | 4.710 | 822 | ||||||
| 2025-08-18 | 13F | Front Row Advisors LLC | 60 | 0,00 | 10 | 0,00 | ||||
| 2025-08-14 | 13F | Win Advisors, Inc | 0 | -100,00 | 0 | |||||
| 2025-08-06 | 13F | AE Wealth Management LLC | 2.353 | -4,31 | 411 | -3,98 | ||||
| 2025-08-07 | 13F | Efficient Advisors, LLC | 4.671 | -34,83 | 816 | -34,64 | ||||
| 2025-07-30 | 13F | Caliber Wealth Management, LLC / KS | 11.309 | -22,23 | 1.975 | -21,98 | ||||
| 2025-08-14 | 13F | Federation des caisses Desjardins du Quebec | 100 | 0,00 | 17 | 0,00 | ||||
| 2025-08-14 | 13F | Legacy Advisory Services, LLC | 10.813 | 0,30 | 1.888 | 0,64 | ||||
| 2025-08-14 | 13F | Royal Bank Of Canada | 1.542 | 2,59 | 269 | 3,07 | ||||
| 2025-07-30 | 13F | Bogart Wealth, LLC | 1.067 | -0,74 | 186 | -0,53 | ||||
| 2025-07-22 | 13F | Merit Financial Group, LLC | 1.967 | -0,56 | 343 | -0,29 | ||||
| 2025-07-11 | 13F | Farther Finance Advisors, LLC | 3.171 | -52,56 | 554 | -52,49 | ||||
| 2025-08-12 | 13F | J.w. Cole Advisors, Inc. | 3.518 | 8,48 | 614 | 8,87 | ||||
| 2025-07-25 | 13F | Commonwealth Financial Services, LLC | 2.311 | 0,00 | 403 | 0,25 | ||||
| 2025-05-19 | 13F | Heck Capital Advisors, LLC | 0 | 0 | ||||||
| 2025-07-22 | 13F | Miracle Mile Advisors, LLC | 7.168 | -8,66 | 1.252 | -8,35 | ||||
| 2025-08-11 | 13F | Aptus Capital Advisors, LLC | 2.186 | 0,09 | 382 | 0,26 | ||||
| 2025-07-28 | 13F | Mutual Advisors, LLC | 3.561 | -0,28 | 629 | 4,49 | ||||
| 2025-07-15 | 13F | Norden Group Llc | 8.655 | -3,73 | 1.511 | -3,39 | ||||
| 2025-08-14 | 13F | Wiley Bros.-aintree Capital, Llc | 2.154 | 0,47 | 376 | 2,17 | ||||
| 2025-08-06 | 13F | Commonwealth Equity Services, Llc | 16.447 | -1,82 | 3 | 0,00 | ||||
| 2025-07-10 | 13F | High Net Worth Advisory Group LLC | 2.400 | 0,00 | 419 | 0,48 | ||||
| 2025-08-13 | 13F | VestGen Advisors, LLC | 50.039 | 8.740 | ||||||
| 2025-08-01 | 13F | Advisory Alpha, LLC | 1.362 | -3,75 | 238 | -3,66 | ||||
| 2025-08-12 | 13F | Proequities, Inc. | 0 | 0 | ||||||
| 2025-07-30 | 13F | Insight Advisors, LLC/ PA | 2.740 | -7,40 | 479 | -7,18 | ||||
| 2025-08-14 | 13F | Ieq Capital, Llc | 92.605 | 0,00 | 16.170 | 0,33 | ||||
| 2025-08-14 | 13F | UBS Group AG | 13.564 | 8,24 | 2.368 | 8,62 | ||||
| 2025-07-30 | 13F | Brookstone Capital Management | 2.812 | -10,62 | 491 | -10,24 | ||||
| 2025-08-14 | 13F | CoreCap Advisors, LLC | 31 | 0,00 | 5 | 0,00 | ||||
| 2025-08-08 | 13F | Thoroughbred Financial Services, Llc | 10.139 | -8,15 | 2 | 0,00 | ||||
| 2025-05-15 | 13F | WPG Advisers, LLC | 0 | -100,00 | 0 | |||||
| 2025-07-28 | 13F | Rosenberg Matthew Hamilton | 97 | -17,80 | 17 | -20,00 | ||||
| 2025-08-11 | 13F | Blue Bell Private Wealth Management, Llc | 160 | 0,00 | 28 | 0,00 | ||||
| 2025-07-24 | 13F | Blair William & Co/il | 323 | 56 | ||||||
| 2025-07-30 | 13F | Syntegra Private Wealth Group, LLC | 698.710 | 8,15 | 122.002 | 8,50 | ||||
| 2025-08-14 | 13F | Horizon Investments, LLC | 73.961 | 76,78 | 12.914 | 77,37 | ||||
| 2025-07-30 | 13F | Strategic Blueprint, LLC | 4.915 | -0,95 | 858 | -0,58 | ||||
| 2025-07-15 | 13F | Aspire Capital Advisors LLC | 1.912 | 54,32 | 334 | 54,88 | ||||
| 2025-08-14 | 13F | Ameriprise Financial Inc | 27.248 | 468,38 | 4.623 | 454,20 | ||||
| 2025-07-14 | 13F | Park Avenue Securities Llc | 1.639 | 0 | ||||||
| 2025-07-30 | 13F | Journey Advisory Group, LLC | 21.005 | 2,84 | 3.668 | 3,18 | ||||
| 2025-08-18 | 13F | Arq Wealth Advisors, Llc | 2.742 | 0,00 | 477 | 0,00 | ||||
| 2025-07-14 | 13F | Painted Porch Advisors LLC | 22 | 0,00 | 4 | 0,00 | ||||
| 2025-08-06 | 13F/A | Flagship Private Wealth, LLC | 6.445 | 1,72 | 1.125 | 2,09 | ||||
| 2025-07-30 | 13F | Pacific Sun Financial Corp | 1.150 | 0,00 | 201 | 0,00 | ||||
| 2025-08-12 | 13F | BlackRock, Inc. | 346 | 0,00 | 60 | 0,00 | ||||
| 2025-08-13 | 13F | Vermillion & White Wealth Management Group, LLC | 37 | -21,28 | 7 | -25,00 | ||||
| 2025-07-24 | 13F | Us Bancorp \de\ | 43 | 2,38 | 7 | 0,00 | ||||
| 2025-08-07 | 13F | Hughes Financial Services, LLC | 1.155 | 0,00 | 202 | 0,50 | ||||
| 2025-07-23 | 13F | Valmark Advisers, Inc. | 26.132 | 12,29 | 4.563 | 12,64 | ||||
| 2025-07-30 | 13F | Prosperity Financial Group, Inc. | 1.621 | 283 | ||||||
| 2025-07-29 | 13F | Elevation Capital Advisory, LLC | 0 | -100,00 | 0 | |||||
| 2025-07-25 | 13F | Apollon Financial, LLC | 5.155 | 106,61 | 900 | 107,37 | ||||
| 2025-07-17 | 13F | Janney Montgomery Scott LLC | 1.400 | 0,00 | 0 | |||||
| 2025-09-04 | 13F/A | Advisor Group Holdings, Inc. | 28.001 | 37,27 | 4.890 | 37,71 | ||||
| 2025-08-14 | 13F/A | Skopos Labs, Inc. | 60 | 10 | ||||||
| 2025-08-06 | 13F | RFG - Bristol Wealth Advisors, LLC | 4.960 | 866 | ||||||
| 2025-08-13 | 13F | Milestone Investment Advisors LLC | 8.967 | -4,59 | 1.566 | -4,28 | ||||
| 2025-05-12 | 13F | Sandy Spring Bank | 16 | 0,00 | 3 | 0,00 | ||||
| 2025-07-24 | 13F | Ulland Investment Advisors, LLC | 187 | 289,58 | 0 | |||||
| 2025-08-13 | 13F | BCJ Capital Management, LLC | 1.603 | 0,50 | 280 | 0,72 | ||||
| 2025-08-04 | 13F | Assetmark, Inc | 128 | -5,19 | 22 | -4,35 | ||||
| 2025-08-05 | 13F | Magnolia Capital Advisors Llc | 42.893 | 7.490 | ||||||
| 2025-07-21 | 13F | Empirical Financial Services, LLC d.b.a. Empirical Wealth Management | 3.855 | -1,28 | 673 | -0,88 | ||||
| 2025-07-28 | 13F | DORVAL Corp | 114.883 | 2,61 | 20.060 | 2,50 | ||||
| 2025-07-29 | 13F | Signature Estate & Investment Advisors Llc | 1.438 | -6,32 | 251 | -5,99 | ||||
| 2025-08-13 | 13F | GeoWealth Management, LLC | 0 | -100,00 | 0 | |||||
| 2025-07-10 | 13F | HF Advisory Group, LLC | 30.370 | 4,27 | 5.303 | 4,60 | ||||
| 2025-07-09 | 13F | Pallas Capital Advisors LLC | 11.617 | 2.028 | ||||||
| 2025-08-14 | 13F | Gerber Kawasaki Wealth & Investment Management | 259.539 | -0,60 | 45.318 | -0,28 | ||||
| 2025-07-15 | 13F | Sheets Smith Wealth Management | 4.798 | 0,00 | 838 | 0,24 | ||||
| 2025-07-08 | 13F | Nbc Securities, Inc. | 408 | 0,00 | 0 | |||||
| 2025-08-12 | 13F | O'shaughnessy Asset Management, Llc | 294 | -23,24 | 51 | -22,73 | ||||
| 2025-08-14 | 13F | Citadel Advisors Llc | 1.364 | 238 | ||||||
| 2025-08-15 | 13F | Morgan Stanley | 168.069 | -0,08 | 29.347 | 0,25 | ||||
| 2025-08-14 | 13F | Cardiff Park Advisors, Llc | 2.719 | 0,00 | 475 | 0,21 | ||||
| 2025-08-12 | 13F | Calton & Associates, Inc. | 1.323 | 4,50 | 231 | 4,55 | ||||
| 2025-07-21 | 13F | Ameritas Advisory Services, LLC | 0 | -100,00 | 0 | |||||
| 2025-08-18 | 13F | Second Line Capital, LLC | 2.186 | 0,09 | 382 | 0,26 | ||||
| 2025-08-13 | 13F | EverSource Wealth Advisors, LLC | 9 | 0,00 | 2 | 0,00 | ||||
| 2025-08-15 | 13F | WFA of San Diego, LLC | 6 | -96,15 | 1 | -96,15 | ||||
| 2025-07-22 | 13F | Olistico Wealth, LLC | 57 | 0,00 | 10 | 0,00 | ||||
| 2025-08-13 | 13F | JBR Co Financial Management Inc | 2.531 | 442 | ||||||
| 2025-08-13 | 13F | Baltimore-Washington Financial Advisors, Inc. | 279.627 | 1,46 | 48.826 | 1,79 | ||||
| 2025-08-12 | 13F | Cornerstone Wealth Management, LLC | 1.678 | 8,40 | 293 | 8,55 | ||||
| 2025-08-11 | 13F | HighTower Advisors, LLC | 2.360 | 0,00 | 412 | 0,49 | ||||
| 2025-08-11 | 13F | Tidemark, LLC | 33 | -42,11 | 6 | -44,44 | ||||
| 2025-08-14 | 13F | State Street Corp | 103.795 | 99,15 | 18.124 | 99,81 | ||||
| 2025-07-22 | 13F | Financial Insights, Inc. | 7.219 | -2,97 | 1.261 | -2,63 | ||||
| 2025-08-05 | 13F | Dunhill Financial, LLC | 0 | 0 | ||||||
| 2025-08-08 | 13F | Cornerstone Advisors Asset Management, Inc | 0 | -100,00 | 0 | |||||
| 2025-07-10 | 13F | Wealth Enhancement Advisory Services, Llc | 21.295 | -22,48 | 3.747 | -21,65 | ||||
| 2025-04-15 | 13F | Eagle Capital Management, LLC | 0 | -100,00 | 0 | |||||
| 2025-07-21 | 13F | Barrett & Company, Inc. | 1.054 | 0,00 | 184 | 0,55 | ||||
| 2025-08-05 | 13F | Roffman Miller Associates Inc /pa/ | 12.094 | 0,40 | 2.112 | 0,72 | ||||
| 2025-07-22 | 13F | Accel Wealth Management | 1.375 | 0,00 | 240 | 0,42 | ||||
| 2025-08-14 | 13F | Mml Investors Services, Llc | 2.883 | 21,19 | 1 | |||||
| 2025-08-14 | 13F | Jane Street Group, Llc | 0 | -100,00 | 0 | |||||
| 2025-08-14 | 13F | Mission Creek Capital Partners, Inc. | 5.816 | -4,40 | 1.015 | -4,06 | ||||
| 2025-08-05 | 13F | Flynn Zito Capital Management, Llc | 1.175 | 0,51 | 205 | 0,99 | ||||
| 2025-08-13 | 13F | Northwestern Mutual Wealth Management Co | 6.558 | -3,94 | 1.145 | -3,62 | ||||
| 2025-08-14 | 13F | Wells Fargo & Company/mn | 89 | 36,92 | 15 | 36,36 | ||||
| 2025-05-15 | 13F | Sykon Capital Llc | 0 | -100,00 | 0 | -100,00 | ||||
| 2025-08-08 | 13F | Comprehensive Financial Planning, Inc./PA | 252 | 0,80 | 44 | 0,00 | ||||
| 2025-08-12 | 13F | LPL Financial LLC | 195.209 | 15,43 | 34.085 | 15,81 | ||||
| 2025-08-04 | 13F | Spire Wealth Management | 168 | 32,28 | 29 | 31,82 | ||||
| 2025-08-19 | 13F | Newbridge Financial Services Group, Inc. | 306 | 0,00 | 53 | 0,00 | ||||
| 2025-08-14 | 13F | Susquehanna International Group, Llp | 8.739 | 61,83 | 1.526 | 62,41 | ||||
| 2025-08-08 | 13F | Foundations Investment Advisors, LLC | 0 | -100,00 | 0 | |||||
| 2025-08-14 | 13F | Atomi Financial Group, Inc. | 3.786 | -2,12 | 661 | -1,78 | ||||
| 2025-08-08 | 13F | Cetera Investment Advisers | 13.755 | 55,02 | 2.402 | 55,51 | ||||
| 2025-07-10 | 13F | ARS Wealth Advisors Group, LLC | 2.342 | 0,30 | 409 | 0,49 | ||||
| 2025-08-08 | 13F | Bouchey Financial Group Ltd | 1.400 | 0,00 | 244 | 0,41 | ||||
| 2025-08-14 | 13F | Integrated Wealth Concepts LLC | 4.796 | 0,99 | 837 | 1,33 | ||||
| 2025-04-23 | 13F | Fourth Dimension Wealth, LLC | 0 | -100,00 | 0 | |||||
| 2025-08-14 | 13F | Fmr Llc | 2.525 | 14,15 | 441 | 14,29 | ||||
| 2025-08-14 | 13F | Harvest Investment Services, LLC | 3.272 | 0,62 | 571 | 1,06 | ||||
| 2025-08-07 | 13F | CENTRAL TRUST Co | 378 | 0,00 | 66 | 1,54 | ||||
| 2025-08-14 | 13F | EP Wealth Advisors, Inc. | 1.525 | 7,02 | 266 | 7,26 | ||||
| 2025-08-14 | 13F | Raymond James Financial Inc | 31.507 | 0,83 | 5.501 | 1,16 | ||||
| 2025-08-13 | 13F | Congress Wealth Management LLC / DE / | 187.919 | -9,05 | 32.813 | -8,76 | ||||
| 2025-07-25 | 13F | NorthRock Partners, LLC | 64 | 0,00 | 11 | 0,00 | ||||
| 2025-08-04 | 13F | Creative Financial Designs Inc /adv | 3.531 | -2,99 | 617 | -2,69 | ||||
| 2025-07-14 | 13F | AdvisorNet Financial, Inc | 1.375 | 49,62 | 240 | 50,94 | ||||
| 2025-07-15 | 13F | Regatta Capital Group, Llc | 5.639 | 985 | ||||||
| 2025-05-02 | 13F | Transcendent Capital Group LLC | 0 | -100,00 | 0 | |||||
| 2025-08-13 | 13F | Townsquare Capital Llc | 0 | -100,00 | 0 |