Statistiche di base
| Proprietari istituzionali | 106 total, 105 long only, 0 short only, 1 long/short - change of 22,99% MRQ |
| Allocazione media del portafoglio | 0.2307 % - change of 4,90% MRQ |
| Azioni istituzionali (Long) | 2.512.213 (ex 13D/G) - change of 0,28MM shares 12,36% MRQ |
| Valore istituzionale (Long) | $ 223.349 USD ($1000) |
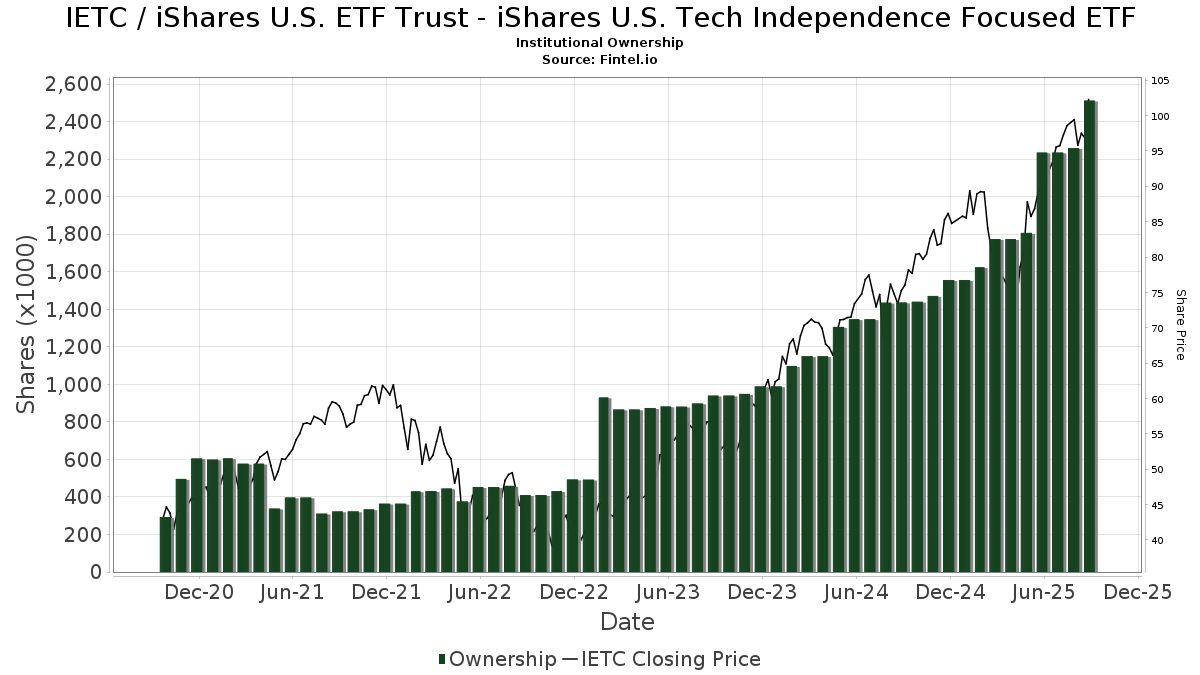
Proprietà istituzionale e azionisti
iShares U.S. ETF Trust - iShares U.S. Tech Independence Focused ETF (US:IETC) ha 106 proprietari istituzionali e azionisti che hanno presentato i moduli 13D/G o 13F alla Securities Exchange Commission (SEC). Queste istituzioni detengono un totale di 2,512,213 azioni. I maggiori azionisti includono Kozak & Associates, Inc., Mirae Asset Global Investments Co., Ltd., Beacon Harbor Wealth Advisors, Inc., Gradient Investments LLC, Jpmorgan Chase & Co, LPL Financial LLC, Mml Investors Services, Llc, Raymond James Financial Inc, Integrated Wealth Concepts LLC, and Apexium Financial, Lp .
(iShares U.S. ETF Trust - iShares U.S. Tech Independence Focused ETF (BATS:IETC) la struttura proprietaria istituzionale mostra le attuali posizioni nella società da parte di istituzioni e fondi, nonché le ultime variazioni nella dimensione della posizione. I principali azionisti possono essere singoli investitori, fondi comuni, hedge fund o istituzioni. L'allegato 13D indica che l'investitore detiene (o ha detenuto) più del 5% della società e intende (o intendeva) perseguire attivamente un cambiamento nella strategia aziendale. L'allegato 13G indica un investimento passivo superiore al 5%.
The share price as of September 5, 2025 is 98,37 / share. Previously, on September 9, 2024, the share price was 72,38 / share. This represents an increase of 35,91% over that period.
Indice del sentiment dei fondi
L'indice del sentiment dei fondi (anche noto come "indice di accumulo di proprietà") individua i titoli più acquistati dai fondi. È il risultato di un sofisticato modello quantitativo multi-fattore che identifica le società con i più alti livelli di accumulo istituzionale. Il modello utilizza una combinazione dell'aumento totale dei proprietari dichiarati, delle variazioni nelle allocazioni di portafoglio di tali proprietari e di altre metriche. Il punteggio varia da 0 a 100: i numeri più alti indicano un livello di accumulo superiore ad altre società, mentre 50 rappresenta la media.
Frequenza di aggiornamento: giornaliera
Consulta Ownership Explorer per visualizzare l'elenco delle aziende con il ranking più alto.
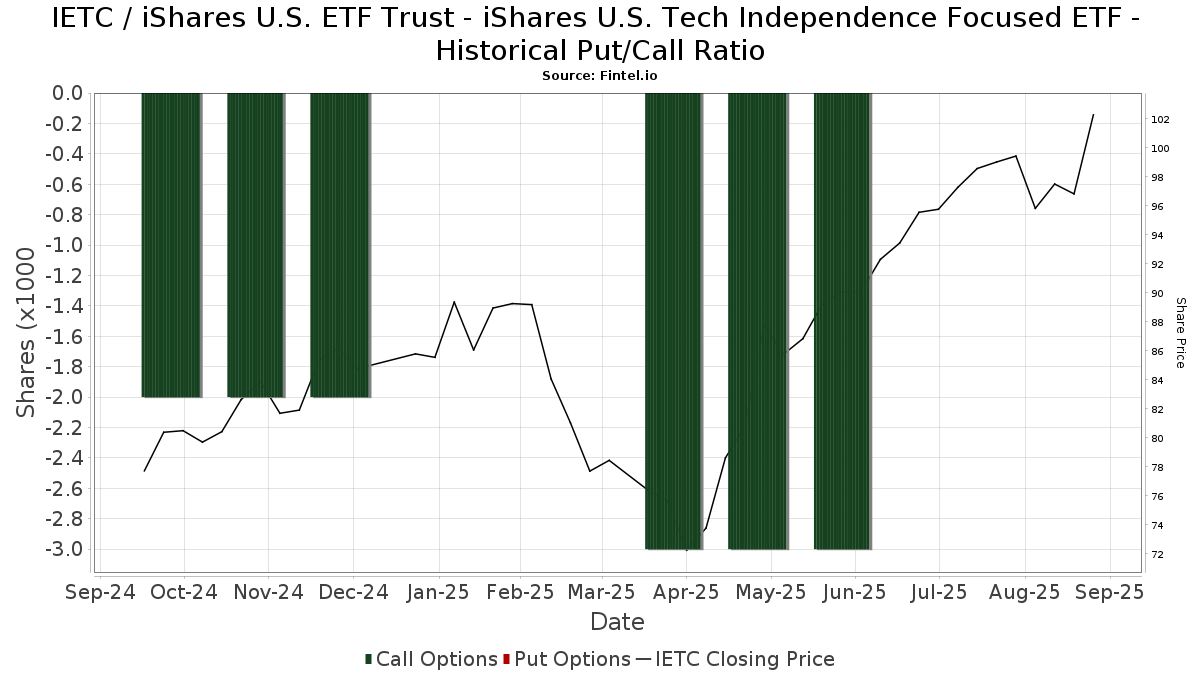
Rapporto put/call istituzionale
Oltre a segnalare le emissioni standard di titoli azionari e di debito, gli istituti con più di 100 milioni di asset in gestione devono anche dichiarare le loro partecipazioni in opzioni put e call. Poiché le opzioni put indicano generalmente un sentiment negativo e le opzioni call un sentiment positivo, possiamo avere un'idea del sentiment istituzionale complessivo attraverso il rapporto tra put e call. Il grafico a destra mostra il rapporto storico put/call per questo strumento.
L'utilizzo del rapporto put/call come indicatore del sentiment degli investitori consente di superare una delle principali lacune dell'utilizzo della proprietà istituzionale totale, ovvero il fatto che una quantità significativa di asset in gestione viene investita passivamente per seguire gli indici. Generalmente, i fondi a gestione passiva non acquistano opzioni, per cui il rapporto put/call riflette più fedelmente il sentiment dei fondi a gestione attiva.
Depositi 13F e NPORT
Le informazioni relative ai depositi 13F sono gratuite. Per accedere alle informazioni relative ai depositi NP è necessario un'abbonamento premium. Le righe verdi indicano le nuove posizioni. Le righe rosse indicano le posizioni chiuse. Fai clic sull'icona del link per visualizzare la cronologia completa delle transazioni.
Esegui l'upgrade
per sbloccare i dati premium ed esportarli in Excel ![]() .
.
| Data di deposito | Fonte | Investitore | Tipo | Prezzo medio (Stima) |
Azioni | Δ Azioni (%) |
Valore dichiarato ($ 1000) |
Δ Valore (%) |
Allocazione del portafoglio (%) |
|
|---|---|---|---|---|---|---|---|---|---|---|
| 2025-08-05 | 13F | Sigma Planning Corp | 8.667 | 13,35 | 815 | 42,06 | ||||
| 2025-07-10 | 13F | Sovran Advisors, LLC | 3.232 | 306 | ||||||
| 2025-07-02 | 13F | Central Pacific Bank - Trust Division | 71 | 0,00 | 7 | 20,00 | ||||
| 2025-05-12 | 13F | Fmr Llc | 0 | -100,00 | 0 | |||||
| 2025-07-29 | 13F | Mattson Financial Services, LLC | 22.382 | 10,51 | 2.104 | 38,63 | ||||
| 2025-08-04 | 13F | Assetmark, Inc | 21.624 | 70,24 | 2.033 | 113,67 | ||||
| 2025-08-12 | 13F | Steward Partners Investment Advisory, Llc | 267 | 25 | ||||||
| 2025-08-14 | 13F | Citadel Advisors Llc | 0 | -100,00 | 0 | |||||
| 2025-05-15 | 13F | Mariner, LLC | 0 | -100,00 | 0 | |||||
| 2025-08-13 | 13F | Northwestern Mutual Wealth Management Co | 45.676 | 740,10 | 4.294 | 954,79 | ||||
| 2025-08-06 | 13F | Mascagni Wealth Management, Inc. | 4.840 | 455 | ||||||
| 2025-08-12 | 13F | Proequities, Inc. | 0 | 0 | ||||||
| 2025-08-01 | 13F | Bessemer Group Inc | 2.165 | 0 | ||||||
| 2025-08-01 | 13F | Belvedere Trading LLC | Call | 3.900 | 367 | |||||
| 2025-08-01 | 13F | Belvedere Trading LLC | Put | 200 | 19 | |||||
| 2025-07-25 | 13F | Atria Wealth Solutions, Inc. | 55.773 | -4,40 | 5.243 | 19,90 | ||||
| 2025-07-08 | 13F | Gradient Investments LLC | 123.960 | 16,34 | 11.652 | 45,94 | ||||
| 2025-07-30 | 13F | TFB Advisors LLC | 4.080 | 34,65 | 384 | 68,72 | ||||
| 2025-08-15 | 13F | Equitable Holdings, Inc. | 8.508 | 2,43 | 800 | 28,46 | ||||
| 2025-08-05 | 13F | Tsfg, Llc | 100 | 0,00 | 0 | |||||
| 2025-07-24 | 13F | IFP Advisors, Inc | 45 | 4 | ||||||
| 2025-07-22 | 13F | Sutton Place Investors Llc | 27.491 | 0,42 | 2.584 | 25,99 | ||||
| 2025-08-11 | 13F | Regal Investment Advisors LLC | 4.428 | 0,05 | 416 | 25,68 | ||||
| 2025-07-28 | 13F | Private Wealth Asset Management, LLC | 267 | 0,00 | 25 | 25,00 | ||||
| 2025-08-14 | 13F | GWM Advisors LLC | 6.677 | 1.012,83 | 628 | 1.325,00 | ||||
| 2025-08-12 | 13F | Jpmorgan Chase & Co | 103.959 | 228,16 | 9.772 | 311,63 | ||||
| 2025-08-12 | 13F | BlackRock, Inc. | 62 | 0,00 | 6 | 25,00 | ||||
| 2025-07-21 | 13F | Ameritas Advisory Services, LLC | 12.951 | -26,95 | 1.217 | -18,43 | ||||
| 2025-08-14 | 13F | Hilltop Holdings Inc. | 2.167 | 204 | ||||||
| 2025-08-01 | 13F | Rossby Financial, LCC | 8 | 0,00 | 1 | |||||
| 2025-08-14 | 13F | Wells Fargo & Company/mn | 0 | 0 | ||||||
| 2025-07-29 | 13F | Hoese & Co LLP | 1.165 | 110 | ||||||
| 2025-07-08 | 13F | RMR Wealth Builders | 8.398 | -0,34 | 789 | 25,04 | ||||
| 2025-07-23 | 13F | Lansing Street Advisors | 12.331 | 5,82 | 1.159 | 32,76 | ||||
| 2025-08-13 | 13F | Continuum Advisory, LLC | 0 | -100,00 | 0 | |||||
| 2025-08-14 | 13F | Wiley Bros.-aintree Capital, Llc | 9.339 | 13,75 | 878 | 42,14 | ||||
| 2025-07-31 | 13F | Cambridge Investment Research Advisors, Inc. | 30.224 | 16,86 | 3 | 100,00 | ||||
| 2025-08-14 | 13F | Icon Wealth Advisors, LLC | 4.715 | 0,11 | 443 | 25,85 | ||||
| 2025-08-11 | 13F | Principal Securities, Inc. | 1.187 | 3.993,10 | 112 | 5.450,00 | ||||
| 2025-08-05 | 13F | Simplex Trading, Llc | 0 | -100,00 | 0 | |||||
| 2025-07-10 | 13F | Wealth Enhancement Advisory Services, Llc | 2.465 | 234 | ||||||
| 2025-08-08 | 13F | Creative Planning | 5.265 | -0,49 | 495 | 24,75 | ||||
| 2025-07-09 | 13F | Pallas Capital Advisors LLC | 2.383 | -81,44 | 224 | -76,80 | ||||
| 2025-08-08 | 13F | Beacon Harbor Wealth Advisors, Inc. | 129.257 | 12.150 | ||||||
| 2025-07-08 | 13F | Zrc Wealth Management, Llc | 1 | 0,00 | 0 | |||||
| 2025-08-08 | 13F | KM Capital Management Ltd. | 16.548 | -6,78 | 1.556 | 16,92 | ||||
| 2025-08-14 | 13F | Glen Eagle Advisors, LLC | 5.631 | 1,24 | 529 | 27,16 | ||||
| 2025-07-17 | 13F | Sound Income Strategies, LLC | 176 | 0,00 | 17 | 23,08 | ||||
| 2025-08-12 | 13F | Vestor Capital, Llc | 2.034 | 0 | ||||||
| 2025-08-04 | 13F | Spire Wealth Management | 20 | 0,00 | 2 | 0,00 | ||||
| 2025-07-22 | 13F | Bay Harbor Wealth Management, LLC | 5.849 | 0,00 | 550 | 25,34 | ||||
| 2025-08-06 | 13F | AE Wealth Management LLC | 10.959 | 16,02 | 1.030 | 45,69 | ||||
| 2025-08-14 | 13F | Comerica Bank | 317 | 30 | ||||||
| 2025-08-08 | 13F | Advisors Capital Management, LLC | 14.661 | 2,13 | 1.378 | 28,19 | ||||
| 2025-07-11 | 13F | Farther Finance Advisors, LLC | 398 | -5,01 | 37 | 19,35 | ||||
| 2025-08-08 | 13F | Comprehensive Financial Planning, Inc./PA | 4.793 | 13,61 | 451 | 42,41 | ||||
| 2025-07-08 | 13F | Ehrlich Financial Group | 2.790 | 262 | ||||||
| 2025-07-18 | 13F | Parsons Capital Management Inc/ri | 3.288 | 0,00 | 309 | 25,61 | ||||
| 2025-08-14 | 13F | Mml Investors Services, Llc | 98.609 | -4,83 | 9 | 28,57 | ||||
| 2025-07-24 | 13F | Fischer Investment Strategies, Llc | 2.932 | 276 | ||||||
| 2025-08-08 | 13F | Larson Financial Group LLC | 137 | 21,24 | 13 | 50,00 | ||||
| 2025-08-12 | 13F | LPL Financial LLC | 100.891 | 73,12 | 9.484 | 117,15 | ||||
| 2025-07-23 | 13F | BankPlus Trust Department | 71 | 0,00 | 7 | 20,00 | ||||
| 2025-08-13 | 13F | BCJ Capital Management, LLC | 54.527 | 20,18 | 5.126 | 50,74 | ||||
| 2025-08-14 | 13F | Federation des caisses Desjardins du Quebec | 708 | 0,00 | 67 | 24,53 | ||||
| 2025-08-14 | 13F | Kovitz Investment Group Partners, LLC | 5.125 | 482 | ||||||
| 2025-08-14 | 13F | McIlrath & Eck, LLC | 293 | 0,00 | 28 | 28,57 | ||||
| 2025-08-11 | 13F | Western Wealth Management, LLC | 2.258 | 212 | ||||||
| 2025-08-07 | 13F | Cascade Financial Partners, LLC | 2.250 | 212 | ||||||
| 2025-08-12 | 13F | Global Retirement Partners, LLC | 10.613 | 998 | ||||||
| 2025-07-23 | 13F | Ironwood Financial, llc | 11.018 | 0,00 | 826 | 0,00 | ||||
| 2025-08-13 | 13F | WCG Wealth Advisors LLC | 10.736 | 1.009 | ||||||
| 2025-08-14 | 13F | Jane Street Group, Llc | 11.875 | 1.116 | ||||||
| 2025-08-14 | 13F | Integrated Wealth Concepts LLC | 71.020 | -5,76 | 6.676 | 18,20 | ||||
| 2025-08-08 | 13F | Cetera Investment Advisers | 3.622 | 11,07 | 340 | 39,34 | ||||
| 2025-08-01 | 13F | Envestnet Asset Management Inc | 10.977 | 31,92 | 1.032 | 65,49 | ||||
| 2025-08-14 | 13F | Old Mission Capital Llc | 3.199 | 301 | ||||||
| 2025-08-13 | 13F | GeoWealth Management, LLC | 49.695 | 143,85 | 4.671 | 205,89 | ||||
| 2025-07-24 | 13F | Us Bancorp \de\ | 50 | 0,00 | 5 | 33,33 | ||||
| 2025-08-05 | 13F | Lord & Richards Wealth Management, LLC | 0 | -100,00 | 0 | |||||
| 2025-08-14 | 13F | Two Sigma Investments, Lp | 17.500 | -77,45 | 1.645 | -71,71 | ||||
| 2025-08-15 | 13F | Morgan Stanley | 3.096 | -5,03 | 291 | 19,26 | ||||
| 2025-05-13 | 13F | Bank Of Montreal /can/ | 0 | -100,00 | 0 | |||||
| 2025-08-13 | 13F | Cerity Partners LLC | 4.395 | 0,05 | 413 | 25,53 | ||||
| 2025-07-28 | 13F | Harbour Investments, Inc. | 91 | 0,00 | 9 | 33,33 | ||||
| 2025-07-07 | 13F | Nova Wealth Management, Inc. | 3.140 | 232,28 | 295 | 321,43 | ||||
| 2025-07-10 | 13F | Worth Asset Management, LLC | 2.768 | 260 | ||||||
| 2025-08-14 | 13F | Raymond James Financial Inc | 85.517 | 0,93 | 8.039 | 26,60 | ||||
| 2025-05-13 | 13F | UBS Group AG | 0 | -100,00 | 0 | |||||
| 2025-07-25 | 13F | Cwm, Llc | 256 | 0,00 | 0 | |||||
| 2025-07-10 | 13F | Signal Advisors Wealth, LLC | 2.657 | 250 | ||||||
| 2025-08-13 | 13F | Jones Financial Companies Lllp | 1.431 | 3.477,50 | 133 | 4.333,33 | ||||
| 2025-09-04 | 13F/A | Advisor Group Holdings, Inc. | 38.972 | 20,93 | 3.648 | 51,01 | ||||
| 2025-07-21 | 13F | Mirae Asset Global Investments Co., Ltd. | 140.751 | -30,74 | 13.231 | -13,41 | ||||
| 2025-07-15 | 13F | Financial Partners Group, Inc | 4.234 | 2,64 | 398 | 28,80 | ||||
| 2025-07-17 | 13F | HB Wealth Management, LLC | 2.500 | 235 | ||||||
| 2025-07-22 | 13F | Apexium Financial, Lp | 66.932 | 323,81 | 6.292 | 431,78 | ||||
| 2025-07-30 | 13F | Financial Perspectives, Inc | 10.708 | 4,52 | 1.007 | 23,44 | ||||
| 2025-07-18 | 13F | Truist Financial Corp | 20.427 | 0,19 | 1.920 | 25,74 | ||||
| 2025-08-13 | 13F | Haverford Trust Co | 3.115 | 0,00 | 293 | 25,32 | ||||
| 2025-08-14 | 13F | Stifel Financial Corp | 48.758 | -42,19 | 4.583 | -27,50 | ||||
| 2025-08-06 | 13F | Kcm Investment Advisors Llc | 9.636 | 0,00 | 906 | 25,35 | ||||
| 2025-08-14 | 13F | Royal Bank Of Canada | 6.374 | 15,16 | 599 | 44,34 | ||||
| 2025-08-14 | 13F | Susquehanna International Group, Llp | 21.932 | -66,62 | 2.062 | -58,14 | ||||
| 2025-07-10 | 13F | Kozak & Associates, Inc. | 682.461 | 0,48 | 65.209 | 29,76 | ||||
| 2025-07-15 | 13F | Patriot Investment Management Inc. | 11.009 | 1,28 | 1.035 | 27,03 | ||||
| 2025-07-23 | 13F | Richardson Capital Management LLC | 1.008 | 1,41 | 95 | 27,03 | ||||
| 2025-08-04 | 13F | Keybank National Association/oh | 27.304 | 2.567 | ||||||
| 2025-08-07 | 13F | Efficient Advisors, LLC | 17.985 | 62,69 | 1.691 | 104,11 | ||||
| 2025-08-15 | 13F | Tower Research Capital LLC (TRC) | 24.021 | 69,09 | 2.258 | 112,12 | ||||
| 2025-08-07 | 13F | Montag A & Associates Inc | 2.691 | -30,88 | 253 | -13,40 | ||||
| 2025-08-25 | 13F | Fulcrum Equity Management | 0 | -100,00 | 0 | |||||
| 2025-07-10 | 13F | Shira Ridge Wealth Management | 17.203 | -0,71 | 1.617 | 24,58 | ||||
| 2025-07-31 | 13F | Moloney Securities Asset Management, LLC | 7.735 | 0,00 | 727 | 25,56 | ||||
| 2025-08-15 | 13F | Kestra Advisory Services, LLC | 3.820 | 359 | ||||||
| 2025-08-06 | 13F | Commonwealth Equity Services, Llc | 11.269 | -9,88 | 1 | |||||
| 2025-08-14 | 13F | Goldman Sachs Group Inc | 24.717 | 70,15 | 2.323 | 113,51 | ||||
| 2025-08-07 | 13F | Allworth Financial LP | 1.600 | 0,00 | 150 | 22,95 |