HPP.PRC - Hudson Pacific Properties, Inc. - Preferred Stock Azioni - Prezzo delle azioni, proprietà istituzionale, azionisti (NYSE)

Hudson Pacific Properties, Inc. - Preferred Stock
US ˙ NYSE

Statistiche di base
Proprietari istituzionali 20 total, 20 long only, 0 short only, 0 long/short - change of 0,00% MRQ
Allocazione media del portafoglio 0.4632 % - change of 9,52% MRQ
Azioni istituzionali (Long) 5.780.522 (ex 13D/G) - change of 0,01MM shares 0,20% MRQ
Valore istituzionale (Long) $ 79.466 USD ($1000)
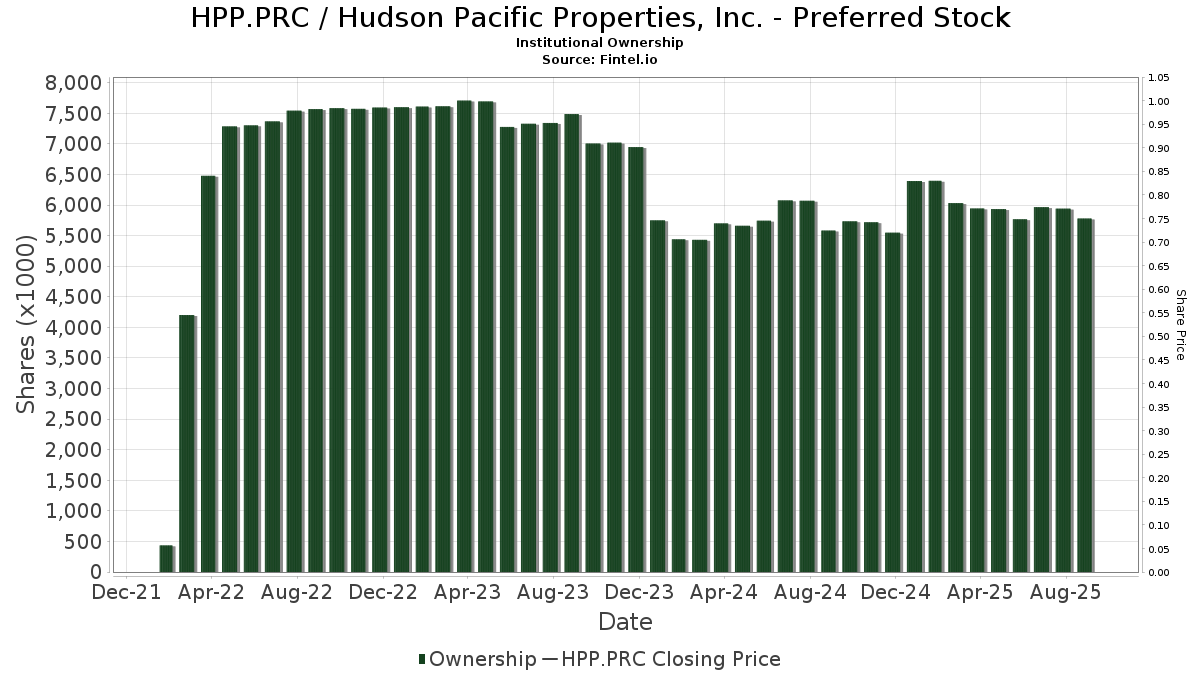
Proprietà istituzionale e azionisti

Hudson Pacific Properties, Inc. - Preferred Stock (US:HPP.PRC) ha 20 proprietari istituzionali e azionisti che hanno presentato i moduli 13D/G o 13F alla Securities Exchange Commission (SEC). Queste istituzioni detengono un totale di 5,780,522 azioni. I maggiori azionisti includono PFF - iShares Preferred and Income Securities ETF, PFFA - Virtus InfraCap U.S. Preferred Stock ETF, FRIFX - Fidelity Real Estate Income Fund, PGX - Invesco Preferred ETF, PFXF - VanEck Vectors Preferred Securities ex Financials ETF, KIFYX - Westwood Salient Select Income Fund Institutional Shares, PFFD - Global X U.S. Preferred ETF, Neuberger Berman Real Estate Securities Income Fund Inc, PFFR - InfraCap REIT Preferred ETF, and John Hancock Financial Opportunities Fund .

(Hudson Pacific Properties, Inc. - Preferred Stock (NYSE:HPP.PRC) la struttura proprietaria istituzionale mostra le attuali posizioni nella società da parte di istituzioni e fondi, nonché le ultime variazioni nella dimensione della posizione. I principali azionisti possono essere singoli investitori, fondi comuni, hedge fund o istituzioni. L'allegato 13D indica che l'investitore detiene (o ha detenuto) più del 5% della società e intende (o intendeva) perseguire attivamente un cambiamento nella strategia aziendale. L'allegato 13G indica un investimento passivo superiore al 5%.

HPP.PRC / Hudson Pacific Properties, Inc. - Preferred Stock Institutional Ownership
Indice del sentiment dei fondi

L'indice del sentiment dei fondi (anche noto come "indice di accumulo di proprietà") individua i titoli più acquistati dai fondi. È il risultato di un sofisticato modello quantitativo multi-fattore che identifica le società con i più alti livelli di accumulo istituzionale. Il modello utilizza una combinazione dell'aumento totale dei proprietari dichiarati, delle variazioni nelle allocazioni di portafoglio di tali proprietari e di altre metriche. Il punteggio varia da 0 a 100: i numeri più alti indicano un livello di accumulo superiore ad altre società, mentre 50 rappresenta la media.

Frequenza di aggiornamento: giornaliera

Consulta Ownership Explorer per visualizzare l'elenco delle aziende con il ranking più alto.

Rapporto put/call istituzionale

Oltre a segnalare le emissioni standard di titoli azionari e di debito, gli istituti con più di 100 milioni di asset in gestione devono anche dichiarare le loro partecipazioni in opzioni put e call. Poiché le opzioni put indicano generalmente un sentiment negativo e le opzioni call un sentiment positivo, possiamo avere un'idea del sentiment istituzionale complessivo attraverso il rapporto tra put e call. Il grafico a destra mostra il rapporto storico put/call per questo strumento.

L'utilizzo del rapporto put/call come indicatore del sentiment degli investitori consente di superare una delle principali lacune dell'utilizzo della proprietà istituzionale totale, ovvero il fatto che una quantità significativa di asset in gestione viene investita passivamente per seguire gli indici. Generalmente, i fondi a gestione passiva non acquistano opzioni, per cui il rapporto put/call riflette più fedelmente il sentiment dei fondi a gestione attiva.

HPP.PRC / Hudson Pacific Properties, Inc. - Preferred Stock Historical Put/Call Ratio
Depositi 13F e NPORT

Le informazioni relative ai depositi 13F sono gratuite. Per accedere alle informazioni relative ai depositi NP è necessario un'abbonamento premium. Le righe verdi indicano le nuove posizioni. Le righe rosse indicano le posizioni chiuse. Fai clic sull'icona del link per visualizzare la cronologia completa delle transazioni.

Esegui l'upgrade per sbloccare i dati premium ed esportarli in Excel .

Data di deposito Fonte Investitore Tipo Prezzo medio
(Stima)
Azioni Δ Azioni
(%)
Valore
dichiarato
($ 1000)
Δ Valore
(%)
Allocazione del portafoglio
(%)
2025-06-25 NP PFFR - InfraCap REIT Preferred ETF 149.098 -8,39 1.983 -12,64
2025-07-22 NP GPRF - Goldman Sachs Access U.S. Preferred Stock and Hybrid Securities ETF 6.814 29,45 84 20,00
2025-07-30 NP RIET - Hoya Capital High Dividend Yield ETF 23.786 28,99 294 18,15
2025-06-25 NP PFFA - Virtus InfraCap U.S. Preferred Stock ETF 1.143.274 0,91 15.206 -3,79
2025-08-26 NP Griffin Institutional Access Real Estate Fund 28.000 -34,50 416 -25,98
2025-08-29 NP SOAAX - Spirit Of America Real Estate Income And Growth Fund Class A 4.000 0,00 59 13,46
2025-08-21 NP PFXF - VanEck Vectors Preferred Securities ex Financials ETF 520.419 -10,82 7.733 0,70
2025-06-26 NP FRIFX - Fidelity Real Estate Income Fund This fund is a listed as child fund of Fmr Llc and if that institution has disclosed ownership in this security, then these positions will not be double counted when calculating total shares and total value 686.200 0,00 9.126 -3,91
2025-08-22 NP FSRRX - Fidelity Strategic Real Return Fund This fund is a listed as child fund of Fmr Llc and if that institution has disclosed ownership in this security, then these positions will not be double counted when calculating total shares and total value 18.100 0,00 269 12,55
2025-06-24 NP Neuberger Berman Real Estate Securities Income Fund Inc 186.404 27,32 2.479 21,40
2025-06-26 NP FSREX - Fidelity Series Real Estate Income Fund This fund is a listed as child fund of Fmr Llc and if that institution has disclosed ownership in this security, then these positions will not be double counted when calculating total shares and total value 22.900 0,00 305 -3,80
2025-04-29 NP PFFD - Global X U.S. Preferred ETF This fund is a listed as child fund of Mirae Asset Global Investments Co., Ltd. and if that institution has disclosed ownership in this security, then these positions will not be double counted when calculating total shares and total value 335.387 -0,98 4.518 -6,27
2025-08-28 NP Cohen & Steers Total Return Realty Fund Inc 4.697 0,00 70 13,11
2025-05-29 NP John Hancock Financial Opportunities Fund 118.838 0,00 1.564 -6,24
2025-07-29 NP PGX - Invesco Preferred ETF This fund is a listed as child fund of Invesco Ltd. and if that institution has disclosed ownership in this security, then these positions will not be double counted when calculating total shares and total value 652.303 -4,63 8.049 -12,62
2025-06-25 NP KIFYX - Westwood Salient Select Income Fund Institutional Shares 406.228 65,47 5.403 57,77
2025-08-26 NP PFF - iShares Preferred and Income Securities ETF This fund is a listed as child fund of BlackRock Inc. and if that institution has disclosed ownership in this security, then these positions will not be double counted when calculating total shares and total value 1.375.123 -5,71 20.434 6,48
2025-08-28 NP Cohen & Steers Quality Income Realty Fund Inc 40.939 0,00 608 13,01
2025-08-28 NP IPPP - Preferred-Plus ETF 3.012 0,00 45 12,82
2025-08-04 13F Iat Reinsurance Co Ltd. 55.000 0,00 829 12,79
Fintel data has been cited in the following publications:
Daily Mail Fox Business Business Insider Wall Street Journal The Washington Post Bloomberg Financial Times Globe and Mail
NASDAQ.com Reuters The Guardian Associated Press FactCheck.org Snopes Politifact
Federal Register The Intercept Forbes Fortune Magazine TheStreet Time Magazine Canadian Broadcasting Corporation International Business Times
Cambridge University Press Investopedia MarketWatch NY Daily News Entrepreneur Newsweek Barron's El Economista