Statistiche di base
| Proprietari istituzionali | 194 total, 194 long only, 0 short only, 0 long/short - change of 0,00% MRQ |
| Allocazione media del portafoglio | 0.0312 % - change of -4,71% MRQ |
| Azioni istituzionali (Long) | 24.967.498 (ex 13D/G) - change of 1,52MM shares 6,47% MRQ |
| Valore istituzionale (Long) | $ 121.248 USD ($1000) |
Proprietà istituzionale e azionisti
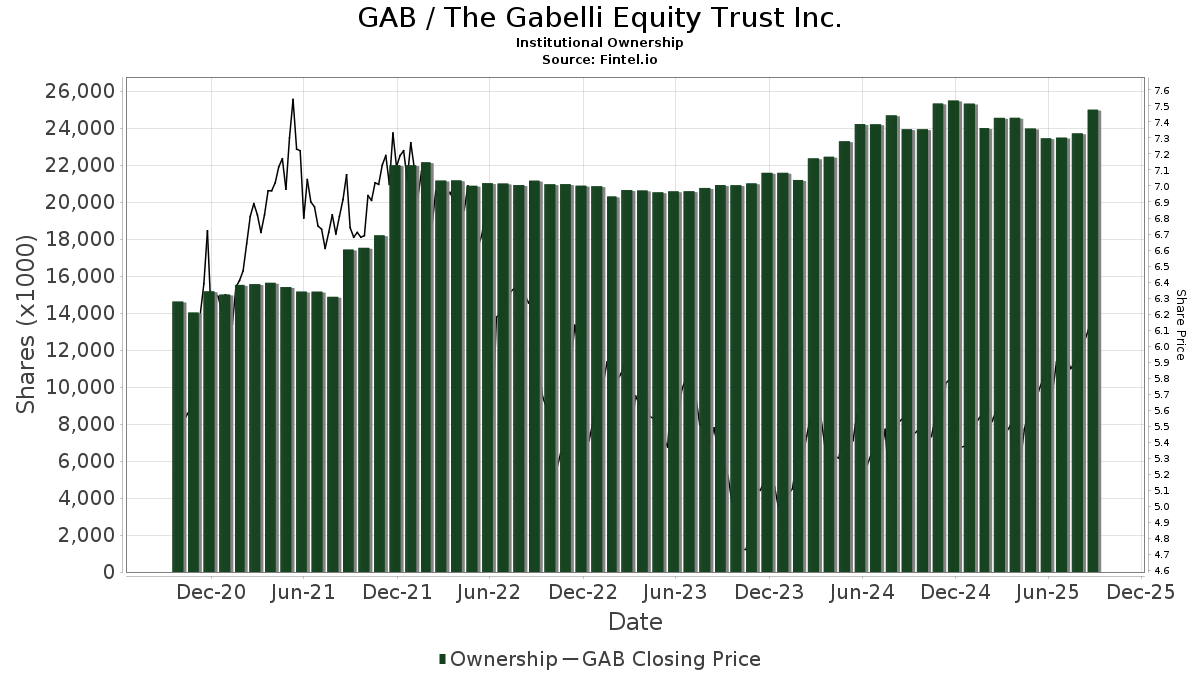
The Gabelli Equity Trust Inc. (US:GAB) ha 194 proprietari istituzionali e azionisti che hanno presentato i moduli 13D/G o 13F alla Securities Exchange Commission (SEC). Queste istituzioni detengono un totale di 24,967,498 azioni. I maggiori azionisti includono LPL Financial LLC, Morgan Stanley, Commonwealth Equity Services, Llc, J.w. Cole Advisors, Inc., Philadelphia Trust Co, Gamco Investors, Inc. Et Al, Cetera Investment Advisers, Raymond James Financial Inc, Bank Of America Corp /de/, and Royal Bank Of Canada .
(The Gabelli Equity Trust Inc. (NYSE:GAB) la struttura proprietaria istituzionale mostra le attuali posizioni nella società da parte di istituzioni e fondi, nonché le ultime variazioni nella dimensione della posizione. I principali azionisti possono essere singoli investitori, fondi comuni, hedge fund o istituzioni. L'allegato 13D indica che l'investitore detiene (o ha detenuto) più del 5% della società e intende (o intendeva) perseguire attivamente un cambiamento nella strategia aziendale. L'allegato 13G indica un investimento passivo superiore al 5%.
The share price as of September 9, 2025 is 6,18 / share. Previously, on September 10, 2024, the share price was 5,52 / share. This represents an increase of 11,87% over that period.
Indice del sentiment dei fondi
L'indice del sentiment dei fondi (anche noto come "indice di accumulo di proprietà") individua i titoli più acquistati dai fondi. È il risultato di un sofisticato modello quantitativo multi-fattore che identifica le società con i più alti livelli di accumulo istituzionale. Il modello utilizza una combinazione dell'aumento totale dei proprietari dichiarati, delle variazioni nelle allocazioni di portafoglio di tali proprietari e di altre metriche. Il punteggio varia da 0 a 100: i numeri più alti indicano un livello di accumulo superiore ad altre società, mentre 50 rappresenta la media.
Frequenza di aggiornamento: giornaliera
Consulta Ownership Explorer per visualizzare l'elenco delle aziende con il ranking più alto.
Rapporto put/call istituzionale
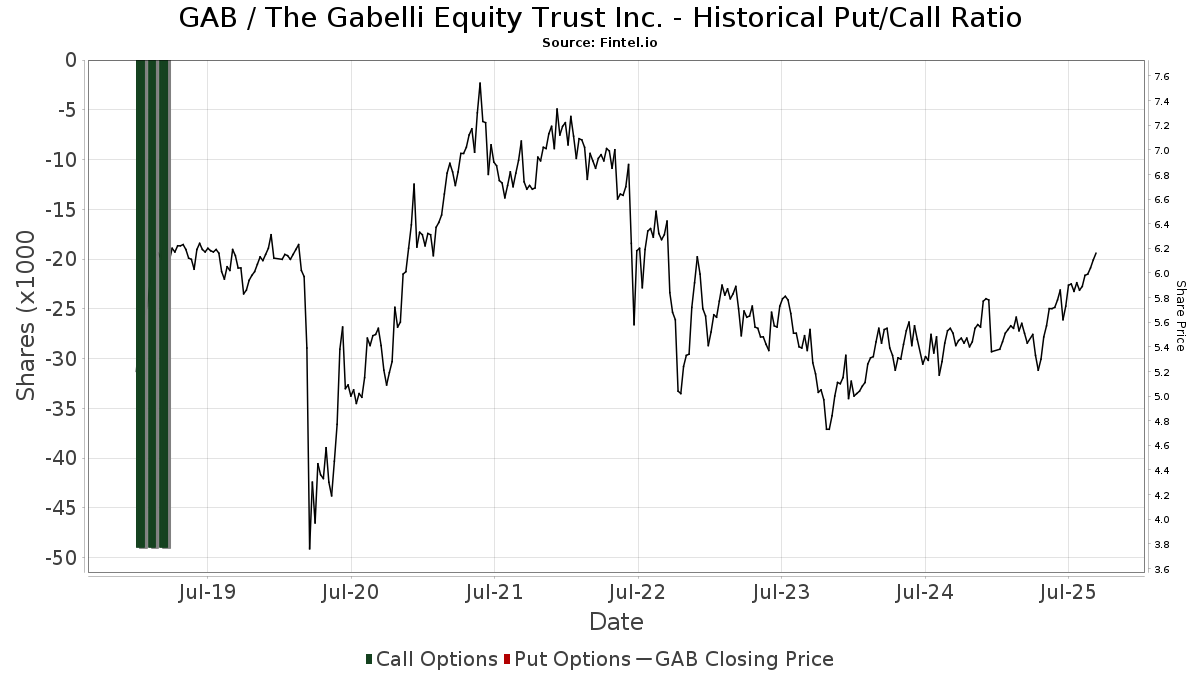
Oltre a segnalare le emissioni standard di titoli azionari e di debito, gli istituti con più di 100 milioni di asset in gestione devono anche dichiarare le loro partecipazioni in opzioni put e call. Poiché le opzioni put indicano generalmente un sentiment negativo e le opzioni call un sentiment positivo, possiamo avere un'idea del sentiment istituzionale complessivo attraverso il rapporto tra put e call. Il grafico a destra mostra il rapporto storico put/call per questo strumento.
L'utilizzo del rapporto put/call come indicatore del sentiment degli investitori consente di superare una delle principali lacune dell'utilizzo della proprietà istituzionale totale, ovvero il fatto che una quantità significativa di asset in gestione viene investita passivamente per seguire gli indici. Generalmente, i fondi a gestione passiva non acquistano opzioni, per cui il rapporto put/call riflette più fedelmente il sentiment dei fondi a gestione attiva.
Depositi 13F e NPORT
Le informazioni relative ai depositi 13F sono gratuite. Per accedere alle informazioni relative ai depositi NP è necessario un'abbonamento premium. Le righe verdi indicano le nuove posizioni. Le righe rosse indicano le posizioni chiuse. Fai clic sull'icona del link per visualizzare la cronologia completa delle transazioni.
Esegui l'upgrade
per sbloccare i dati premium ed esportarli in Excel ![]() .
.
| Data di deposito | Fonte | Investitore | Tipo | Prezzo medio (Stima) |
Azioni | Δ Azioni (%) |
Valore dichiarato ($ 1000) |
Δ Valore (%) |
Allocazione del portafoglio (%) |
|
|---|---|---|---|---|---|---|---|---|---|---|
| 2025-08-12 | 13F | MAI Capital Management | 1.166 | 0,00 | 7 | 0,00 | ||||
| 2025-08-14 | 13F | Colony Group, LLC | 12.190 | -44,35 | 71 | -41,67 | ||||
| 2025-07-23 | 13F | Kingswood Wealth Advisors, Llc | 64.836 | 4,85 | 377 | 10,88 | ||||
| 2025-08-11 | 13F | TD Waterhouse Canada Inc. | 9.150 | 0,00 | 54 | 8,16 | ||||
| 2025-08-14 | 13F | Mml Investors Services, Llc | 92.767 | -0,11 | 1 | |||||
| 2025-08-05 | 13F | Wellington Shields Capital Management, LLC | 13.857 | 0,00 | 81 | 5,26 | ||||
| 2025-07-21 | 13F | Montz Harcus Wealth Management LLC | 15.896 | 2,60 | 93 | 8,24 | ||||
| 2025-07-31 | 13F | Darden Wealth Group Inc | 57.000 | -8,06 | 332 | -2,93 | ||||
| 2025-08-14 | 13F | Ameriprise Financial Inc | 13.605 | 79 | ||||||
| 2025-08-08 | 13F | Creative Planning | 460.823 | 0,03 | 2.682 | 5,63 | ||||
| 2025-07-11 | 13F | SILVER OAK SECURITIES, Inc | 60.770 | -5,74 | 354 | -0,28 | ||||
| 2025-07-18 | 13F | PFG Investments, LLC | 92.692 | 7,10 | 539 | 13,24 | ||||
| 2025-08-08 | 13F | Cornerstone Advisors, LLC | 2.200 | 0,00 | 13 | 0,00 | ||||
| 2025-08-01 | 13F | Financial Counselors Inc | 0 | -100,00 | 0 | |||||
| 2025-08-12 | 13F | Virtu Financial LLC | 35.102 | 0 | ||||||
| 2025-08-04 | 13F | Assetmark, Inc | 648 | 0,00 | 4 | 0,00 | ||||
| 2025-07-17 | 13F | Sound Income Strategies, LLC | 104 | 0,00 | 1 | |||||
| 2025-07-16 | 13F | West Branch Capital LLC | 22 | 0,00 | 0 | |||||
| 2025-07-24 | 13F | Us Bancorp \de\ | 1.654 | 0,00 | 10 | 0,00 | ||||
| 2025-08-08 | 13F | Cetera Investment Advisers | 601.262 | 4,82 | 3.499 | 10,73 | ||||
| 2025-08-13 | 13F | Baird Financial Group, Inc. | 32.548 | 6,55 | 189 | 12,50 | ||||
| 2025-08-22 | NP | Cornerstone Strategic Value Fund Inc | 2.200 | 0,00 | 13 | 0,00 | ||||
| 2025-07-24 | 13F | IFP Advisors, Inc | 2.170 | -13,20 | 13 | -7,69 | ||||
| 2025-08-14 | 13F | CoreCap Advisors, LLC | 9.562 | -23,49 | 56 | -19,12 | ||||
| 2025-07-21 | 13F | Empirical Financial Services, LLC d.b.a. Empirical Wealth Management | 114.937 | 0,00 | 669 | 5,53 | ||||
| 2025-08-14 | 13F | Raymond James Financial Inc | 554.382 | 8,08 | 3.227 | 14,15 | ||||
| 2025-07-01 | 13F | Kera Capital Partners, Inc. | 105.780 | 0,00 | 616 | 5,67 | ||||
| 2025-08-15 | 13F | Morgan Stanley | 2.464.758 | 1,64 | 14.345 | 7,36 | ||||
| 2025-08-11 | 13F | Private Advisor Group, LLC | 179.301 | -5,06 | 1.044 | 0,29 | ||||
| 2025-05-02 | 13F | Capital A Wealth Management, LLC | 0 | -100,00 | 0 | |||||
| 2025-07-15 | 13F | Beacon Investment Advisory Services, Inc. | 19.000 | 0,00 | 111 | 5,77 | ||||
| 2025-08-06 | 13F | Wedbush Securities Inc | 113.984 | -6,17 | 1 | |||||
| 2025-08-06 | 13F | Pekin Hardy Strauss, Inc. | 27.879 | 2,39 | 162 | 8,00 | ||||
| 2025-04-28 | 13F | Mutual Advisors, LLC | 0 | -100,00 | 0 | -100,00 | ||||
| 2025-08-12 | 13F | Global Retirement Partners, LLC | 1.902 | 9,06 | 11 | 22,22 | ||||
| 2025-08-05 | 13F | American Capital Advisory, LLC | 2.525 | 0,00 | 15 | 7,69 | ||||
| 2025-08-13 | 13F | Guggenheim Capital Llc | 358.969 | 38,61 | 2.089 | 46,39 | ||||
| 2025-07-16 | 13F | Novem Group | 10.489 | 0,00 | 61 | 7,02 | ||||
| 2025-07-14 | 13F | Golden State Equity Partners | 95.820 | -1,40 | 558 | 4,11 | ||||
| 2025-08-14 | 13F | Royal Bank Of Canada | 527.685 | 2,16 | 3.071 | 7,91 | ||||
| 2025-08-14 | 13F | Wells Fargo & Company/mn | 455.912 | -0,33 | 2.653 | 5,28 | ||||
| 2025-04-25 | 13F | Smallwood Wealth Investment Management, LLC | 1.125 | 6 | ||||||
| 2025-07-25 | 13F | LRI Investments, LLC | 16.347 | 0,00 | 95 | 5,56 | ||||
| 2025-08-06 | 13F | Savant Capital, LLC | 12.297 | 0,00 | 72 | 5,97 | ||||
| 2025-08-11 | 13F | HighTower Advisors, LLC | 71.096 | 0,44 | 414 | 5,90 | ||||
| 2025-08-14 | 13F | Citadel Advisors Llc | 25.675 | -3,44 | 149 | 2,05 | ||||
| 2025-07-30 | 13F | Insight Advisors, LLC/ PA | 21.842 | 0,00 | 127 | 5,83 | ||||
| 2025-07-17 | 13F | Eagle Wealth Strategies Llc | 18.624 | 0,00 | 108 | 5,88 | ||||
| 2025-08-14 | 13F | TCG Advisory Services, LLC | 15.203 | 0,00 | 88 | 6,02 | ||||
| 2025-07-15 | 13F | Fifth Third Bancorp | 4.000 | -9,32 | 23 | -4,17 | ||||
| 2025-07-25 | 13F | Johnson Investment Counsel Inc | 15.129 | -3,71 | 88 | 2,33 | ||||
| 2025-07-28 | 13F | Evernest Financial Advisors, LLC | 19.855 | -45,91 | 116 | -43,07 | ||||
| 2025-07-21 | 13F | Cornell Pochily Investment Advisors, Inc. | 29.580 | 172 | ||||||
| 2025-08-12 | 13F | Leigh Baldwin & Co., Llc | 86.084 | 0,00 | 501 | 5,70 | ||||
| 2025-05-15 | 13F | Glenmede Trust Co Na | 15.473 | 0,00 | 85 | 2,41 | ||||
| 2025-08-12 | 13F | Advisors Asset Management, Inc. | 208.465 | -0,53 | 1.213 | 5,11 | ||||
| 2025-08-01 | 13F | Motco | 22.318 | -26,39 | 130 | -22,75 | ||||
| 2025-07-30 | 13F | Brookstone Capital Management | 25.770 | -4,22 | 150 | 0,68 | ||||
| 2025-08-14 | 13F | DecisionPoint Financial, LLC | 0 | -100,00 | 0 | |||||
| 2025-07-17 | 13F | Park Place Capital Corp | 0 | -100,00 | 0 | |||||
| 2025-08-01 | 13F | MorganRosel Wealth Management, LLC | 6.246 | 36 | ||||||
| 2025-08-13 | 13F | Scotia Capital Inc. | 459.571 | 0,32 | 2.675 | 5,94 | ||||
| 2025-08-14 | 13F | Great Valley Advisor Group, Inc. | 24.475 | 0,55 | 142 | 5,97 | ||||
| 2025-05-12 | 13F | Independent Advisor Alliance | 0 | -100,00 | 0 | |||||
| 2025-07-18 | 13F | Bartlett & Co. Wealth Management Llc | 902 | 0,00 | 5 | 25,00 | ||||
| 2025-08-07 | 13F | Midland Wealth Advisors Llc | 26.748 | 0,00 | 156 | 5,44 | ||||
| 2025-07-24 | 13F | Aurora Private Wealth, Inc. | 11.014 | 2,60 | 0 | |||||
| 2025-07-17 | 13F | HCR Wealth Advisors | 75.353 | 0,00 | 439 | 5,54 | ||||
| 2025-08-14 | 13F | MidWestOne Financial Group, Inc. | 19.142 | 0,00 | 111 | 5,71 | ||||
| 2025-07-25 | 13F | Cwm, Llc | 12.802 | 0,00 | 0 | |||||
| 2025-08-08 | 13F | Meridian Wealth Management, LLC | 16.264 | 15,64 | 95 | 22,08 | ||||
| 2025-08-15 | 13F | Captrust Financial Advisors | 89.087 | 1,30 | 518 | 7,02 | ||||
| 2025-09-04 | 13F/A | Advisor Group Holdings, Inc. | 211.300 | 11,35 | 1.229 | 17,51 | ||||
| 2025-04-21 | 13F | Institute for Wealth Management, LLC. | 0 | -100,00 | 0 | -100,00 | ||||
| 2025-04-25 | 13F | Red Tortoise LLC | 0 | -100,00 | 0 | |||||
| 2025-08-05 | 13F | Wellington Shields & Co., LLC | 5.428 | 0,00 | 32 | 6,90 | ||||
| 2025-08-06 | 13F | RFG - Bristol Wealth Advisors, LLC | 14.053 | -9,04 | 82 | -4,71 | ||||
| 2025-05-05 | 13F | Hazlett, Burt & Watson, Inc. | 0 | -100,00 | 0 | |||||
| 2025-07-31 | 13F | Oppenheimer & Co Inc | 121.605 | 5,91 | 708 | 11,87 | ||||
| 2025-08-01 | 13F | Ashton Thomas Private Wealth, LLC | 20.302 | -51,55 | 118 | -48,70 | ||||
| 2025-08-07 | 13F | Kestra Private Wealth Services, Llc | 28.038 | 0,70 | 163 | 6,54 | ||||
| 2025-08-14 | 13F | UBS Group AG | 379.728 | 10,42 | 2.210 | 16,68 | ||||
| 2025-07-25 | 13F | Concord Wealth Partners | 303 | 0,00 | 2 | 0,00 | ||||
| 2025-08-05 | 13F | Sigma Planning Corp | 12.942 | 0,43 | 75 | 5,63 | ||||
| 2025-08-13 | 13F | Northwestern Mutual Wealth Management Co | 1.371 | -82,54 | 8 | -83,72 | ||||
| 2025-08-14 | 13F | Bank Of America Corp /de/ | 531.315 | 4,71 | 3.092 | 10,63 | ||||
| 2025-05-08 | 13F | Sound View Wealth Advisors Group, LLC | 0 | -100,00 | 0 | |||||
| 2025-08-06 | 13F | Texas Yale Capital Corp. | 11.000 | 2,80 | 64 | 10,34 | ||||
| 2025-08-14 | 13F | Mariner, LLC | 27.160 | -9,04 | 158 | -3,66 | ||||
| 2025-07-29 | 13F | Aire Advisors, Llc | 11.813 | 69 | ||||||
| 2025-07-30 | 13F | Cornerstone Advisory, LLC | 18.021 | 1,45 | 105 | 6,12 | ||||
| 2025-05-09 | 13F | Shaker Financial Services, LLC | 0 | -100,00 | 0 | |||||
| 2025-08-11 | 13F | Elequin Capital Lp | 26.873 | 156 | ||||||
| 2025-08-11 | 13F | Principal Securities, Inc. | 4.147 | 5,44 | 24 | 14,29 | ||||
| 2025-08-11 | 13F | Capital Square, LLC | 18.747 | 0,00 | 111 | 6,80 | ||||
| 2025-07-01 | 13F | Legacy Wealth Management, LLC / MS | 52.739 | 184,29 | 307 | 200,00 | ||||
| 2025-08-04 | 13F | Bay Colony Advisory Group, Inc d/b/a Bay Colony Advisors | 24.230 | 0,98 | 141 | 7,63 | ||||
| 2025-08-13 | 13F | Rsm Us Wealth Management Llc | 92.100 | 0,00 | 536 | 5,72 | ||||
| 2025-08-14 | 13F | Gen-Wealth Partners Inc | 5.235 | -24,51 | 30 | -21,05 | ||||
| 2025-08-14 | 13F | CIBC World Markets Inc. | 81.459 | 4,51 | 474 | 10,49 | ||||
| 2025-08-01 | 13F | Boyd Watterson Asset Management Llc/oh | 5.280 | 0,00 | 31 | 3,45 | ||||
| 2025-05-13 | 13F | Bank Of Montreal /can/ | 0 | -100,00 | 0 | |||||
| 2025-08-06 | 13F | Modera Wealth Management, LLC | 17.200 | 0,00 | 100 | 6,38 | ||||
| 2025-07-28 | 13F | Triton Wealth Management, PLLC | 11.031 | 0,51 | 66 | 6,56 | ||||
| 2025-08-14 | 13F | Cohen & Steers, Inc. | 400.000 | 0,00 | 2 | 0,00 | ||||
| 2025-07-17 | 13F | Janney Montgomery Scott LLC | 147.684 | 6,85 | 1 | |||||
| 2025-08-14 | 13F | Comerica Bank | 16.537 | 1.653.600,00 | 96 | |||||
| 2025-08-04 | 13F | Spire Wealth Management | 1.000 | 0,00 | 6 | 0,00 | ||||
| 2025-08-14 | 13F/A | Rockefeller Capital Management L.P. | 204.703 | 1,27 | 1.191 | 7,01 | ||||
| 2025-08-14 | 13F | Wealth Preservation Advisors, LLC | 1.500 | 0,00 | 9 | 0,00 | ||||
| 2025-07-29 | 13F | International Assets Investment Management, Llc | 397.426 | 0,00 | 2.313 | 5,66 | ||||
| 2025-08-05 | 13F | Mission Wealth Management, Lp | 37.574 | 0,00 | 219 | 5,31 | ||||
| 2025-05-16 | 13F | Coppell Advisory Solutions LLC | 0 | -100,00 | 0 | |||||
| 2025-07-11 | 13F | Kapstone Financial Advisors LLC | 21.080 | 80,94 | 123 | 90,63 | ||||
| 2025-07-14 | 13F | Armstrong Advisory Group, Inc | 2.727 | 16 | ||||||
| 2025-08-14 | 13F | GWM Advisors LLC | 32.406 | -11,71 | 189 | -6,93 | ||||
| 2025-08-06 | 13F | Vantage Financial Partners, LLC | 15.269 | -29,15 | 89 | -25,42 | ||||
| 2025-08-14 | 13F | Benjamin Edwards Inc | 32.542 | 2,32 | 189 | 8,00 | ||||
| 2025-08-14 | 13F | Mendel Capital Management LLC | 25.638 | 0,00 | 149 | 5,67 | ||||
| 2025-08-06 | 13F | Chancellor Financial Group WB LP | 19.010 | 1,70 | 111 | 7,84 | ||||
| 2025-08-06 | 13F | Commonwealth Equity Services, Llc | 1.878.662 | -0,72 | 11 | 0,00 | ||||
| 2025-05-09 | 13F | Exencial Wealth Advisors, Llc | 0 | -100,00 | 0 | |||||
| 2025-07-21 | 13F | Ameritas Advisory Services, LLC | 9.856 | -60,12 | 57 | -58,09 | ||||
| 2025-08-13 | 13F | Philadelphia Trust Co | 1.141.144 | -0,27 | 7 | 0,00 | ||||
| 2025-07-22 | 13F/A | Kingstone Capital Partners Texas, LLC | 26.996 | 0,00 | 157 | 5,37 | ||||
| 2025-07-22 | 13F | Valeo Financial Advisors, LLC | 0 | -100,00 | 0 | |||||
| 2025-08-04 | 13F | Live Oak Private Wealth LLC | 514.176 | 0,00 | 2.993 | 5,61 | ||||
| 2025-08-12 | 13F | Proequities, Inc. | 0 | 0 | ||||||
| 2025-08-13 | 13F | Continuum Advisory, LLC | 0 | -100,00 | 0 | -100,00 | ||||
| 2025-08-05 | 13F | Key FInancial Inc | 100 | 0,00 | 1 | |||||
| 2025-07-25 | 13F | Valley Brook Capital Group, Inc. | 115.836 | 2,66 | 674 | 8,53 | ||||
| 2025-08-13 | 13F | Beacon Pointe Advisors, LLC | 15.731 | -45,25 | 92 | -42,41 | ||||
| 2025-08-14 | 13F | Glen Eagle Advisors, LLC | 1.906 | 0,00 | 11 | 10,00 | ||||
| 2025-08-15 | 13F | Tower Research Capital LLC (TRC) | 25 | -16,67 | 0 | |||||
| 2025-07-21 | 13F | Hilltop National Bank | 2.750 | 0,00 | 16 | 14,29 | ||||
| 2025-07-22 | 13F | Accel Wealth Management | 364.694 | 1,16 | 2.123 | 6,85 | ||||
| 2025-08-13 | 13F | Transce3nd, LLC | 1.000 | 6 | ||||||
| 2025-08-14 | 13F | Beaird Harris Wealth Management, LLC | 3.917 | 23 | ||||||
| 2025-07-29 | 13F | Stratos Wealth Partners, LTD. | 110.735 | 14,61 | 644 | 21,05 | ||||
| 2025-08-08 | 13F | Pnc Financial Services Group, Inc. | 2.804 | -66,02 | 16 | -64,44 | ||||
| 2025-08-14 | 13F | Mercer Global Advisors Inc /adv | 64.822 | -0,24 | 377 | 5,31 | ||||
| 2025-08-04 | 13F | IFG Advisory, LLC | 31.486 | 11,71 | 183 | 18,06 | ||||
| 2025-08-13 | 13F | Smith, Moore & Co. | 17.104 | 45,00 | 100 | 54,69 | ||||
| 2025-08-19 | 13F | National Asset Management, Inc. | 0 | -100,00 | 0 | |||||
| 2025-07-23 | 13F | Stonegate Investment Group, LLC | 47.974 | 2,64 | 279 | 8,56 | ||||
| 2025-08-14 | 13F | Glenmede Investment Management, LP | 15.473 | 90 | ||||||
| 2025-07-30 | 13F | Avidian Wealth Solutions, LLC | 19.295 | 0,00 | 112 | 5,66 | ||||
| 2025-07-09 | 13F | Graves-Light Private Wealth Management, Inc. | 41.224 | 0,00 | 240 | 5,29 | ||||
| 2025-08-14 | 13F | Balyasny Asset Management Llc | 25.778 | 150 | ||||||
| 2025-08-14 | 13F | Hilltop Holdings Inc. | 18.032 | -12,80 | 105 | -7,96 | ||||
| 2025-08-01 | 13F | Envestnet Asset Management Inc | 457.149 | 761,91 | 2.661 | 810,96 | ||||
| 2025-08-13 | 13F | Cerity Partners LLC | 306.890 | 29,13 | 1.786 | 36,44 | ||||
| 2025-04-14 | 13F | RDA Financial Network | 0 | -100,00 | 0 | |||||
| 2025-07-21 | 13F | Crews Bank & Trust | 0 | -100,00 | 0 | |||||
| 2025-07-28 | 13F | Sagespring Wealth Partners, Llc | 0 | -100,00 | 0 | |||||
| 2025-08-06 | 13F | Golden State Wealth Management, LLC | 339.861 | -34,47 | 1.978 | -30,80 | ||||
| 2025-08-06 | 13F | Csenge Advisory Group | 12.459 | 0,00 | 72 | 9,23 | ||||
| 2025-08-14 | 13F | Stifel Financial Corp | 95.927 | -14,84 | 558 | -10,00 | ||||
| 2025-08-12 | 13F | LPL Financial LLC | 3.804.780 | 9,50 | 22.144 | 15,66 | ||||
| 2025-08-07 | 13F | Allworth Financial LP | 38.908 | 620,25 | 226 | 707,14 | ||||
| 2025-08-12 | 13F | CIBC Private Wealth Group, LLC | 1.484 | 2,56 | 9 | 14,29 | ||||
| 2025-08-12 | 13F | Steward Partners Investment Advisory, Llc | 318.939 | 27,38 | 1.856 | 34,59 | ||||
| 2025-08-19 | 13F | Advisory Services Network, LLC | 100.044 | -1,97 | 582 | 3,56 | ||||
| 2025-07-25 | 13F | Apollon Wealth Management, LLC | 15.222 | 0,34 | 89 | 6,02 | ||||
| 2025-08-08 | 13F | Kingsview Wealth Management, LLC | 39.426 | 0,13 | 229 | 6,02 | ||||
| 2025-07-18 | 13F | Consolidated Portfolio Review Corp | 112.532 | -17,72 | 655 | -13,15 | ||||
| 2025-05-14 | 13F | Huntington National Bank | 27 | 2.500,00 | ||||||
| 2025-04-22 | 13F | Putney Financial Group LLC | 0 | -100,00 | 0 | |||||
| 2025-08-13 | 13F | StoneX Group Inc. | 13.612 | 79 | ||||||
| 2025-08-13 | 13F | Thomas J. Herzfeld Advisors, Inc. | 1.020 | 2,62 | 6 | 0,00 | ||||
| 2025-07-10 | 13F | Wealth Enhancement Advisory Services, Llc | 99.274 | -2,47 | 589 | 5,00 | ||||
| 2025-08-12 | 13F | Jpmorgan Chase & Co | 4.500 | 0,00 | 26 | 8,33 | ||||
| 2025-07-18 | 13F | SOA Wealth Advisors, LLC. | 1.200 | 0,00 | 7 | 0,00 | ||||
| 2025-08-14 | 13F | Arete Wealth Advisors, LLC | 0 | -100,00 | 0 | |||||
| 2025-07-24 | 13F | Cascade Investment Group, Inc. | 11.749 | 0,00 | 68 | 6,25 | ||||
| 2025-07-15 | 13F | Shulman DeMeo Asset Management LLC | 57.639 | -0,20 | 335 | 5,35 | ||||
| 2025-07-25 | 13F | Atria Wealth Solutions, Inc. | 42.033 | -51,36 | 245 | -48,74 | ||||
| 2025-08-05 | 13F | Flynn Zito Capital Management, Llc | 88.806 | 0,00 | 517 | 5,52 | ||||
| 2025-08-08 | 13F | Thompson Davis & Co., Inc. | 13.000 | 76 | ||||||
| 2025-08-13 | 13F | Gamco Investors, Inc. Et Al | 841.675 | -0,64 | 4.899 | 4,95 | ||||
| 2025-07-17 | 13F | Vermillion Wealth Management, Inc. | 2.740 | 2,58 | 16 | 7,14 | ||||
| 2025-07-28 | 13F | Frazier Financial Advisors, LLC | 81 | 0,00 | 0 | |||||
| 2025-08-14 | 13F | Jane Street Group, Llc | 45.156 | 138,53 | 263 | 151,92 | ||||
| 2025-07-29 | 13F | Stratos Wealth Advisors, LLC | 0 | -100,00 | 0 | -100,00 | ||||
| 2025-08-15 | 13F | Equitable Holdings, Inc. | 63.099 | 0,00 | 367 | 5,76 | ||||
| 2025-07-31 | 13F | Moloney Securities Asset Management, LLC | 15.832 | 92 | ||||||
| 2025-08-07 | 13F | Midwest Trust Co | 52.810 | 307 | ||||||
| 2025-07-11 | 13F | Quad-Cities Investment Group, LLC | 24.942 | -0,36 | 145 | 5,84 | ||||
| 2025-08-14 | 13F | Two Sigma Securities, Llc | 18.317 | 107 | ||||||
| 2025-07-16 | 13F | Register Financial Advisors LLC | 22.637 | 81,07 | 132 | 92,65 | ||||
| 2025-08-01 | 13F | SYM FINANCIAL Corp | 11.476 | 2,60 | 67 | 8,20 | ||||
| 2025-05-15 | 13F | Gwn Securities Inc. | 0 | -100,00 | 0 | |||||
| 2025-07-08 | 13F | Nbc Securities, Inc. | 37.447 | -4,17 | 0 | |||||
| 2025-04-29 | 13F | Lee Danner & Bass Inc | 0 | -100,00 | 0 | -100,00 | ||||
| 2025-07-10 | 13F | Oliver Lagore Vanvalin Investment Group | 3.750 | 0,00 | 21 | 0,00 | ||||
| 2025-08-05 | 13F | GHP Investment Advisors, Inc. | 5.344 | 0,00 | 31 | 6,90 | ||||
| 2025-07-29 | 13F | Arista Wealth Management, LLC | 47.128 | 0,00 | 274 | 5,79 | ||||
| 2025-07-25 | 13F | Community Bank, N.A. | 1.000 | 0,00 | 6 | 0,00 | ||||
| 2025-04-25 | 13F | Koshinski Asset Management, Inc. | 0 | -100,00 | 0 | |||||
| 2025-05-12 | 13F | National Bank Of Canada /fi/ | 0 | -100,00 | 0 | |||||
| 2025-08-15 | 13F | Kestra Advisory Services, LLC | 65.339 | 29,24 | 380 | 36,69 | ||||
| 2025-05-07 | 13F | Sheaff Brock Investment Advisors, LLC | 33.495 | 0,00 | 185 | 2,22 | ||||
| 2025-07-31 | 13F | Cambridge Investment Research Advisors, Inc. | 59.542 | -9,70 | 0 | |||||
| 2025-07-22 | 13F | Belpointe Asset Management LLC | 0 | -100,00 | 0 | |||||
| 2025-07-31 | 13F | Whipplewood Advisors, LLC | 0 | -100,00 | 0 | |||||
| 2025-07-25 | 13F | NorthRock Partners, LLC | 81.363 | 1,43 | 474 | 7,26 | ||||
| 2025-08-14 | 13F | Federation des caisses Desjardins du Quebec | 739 | 0,00 | 4 | 0,00 | ||||
| 2025-07-22 | 13F | Marks Group Wealth Management, Inc | 244.838 | 0,00 | 1.425 | 5,56 | ||||
| 2025-08-08 | 13F | Symphony Financial Services, Inc. | 29.978 | 0,79 | 174 | 6,75 | ||||
| 2025-07-22 | 13F | Gsa Capital Partners Llp | 0 | -100,00 | 0 | |||||
| 2025-08-05 | 13F | Carolinas Wealth Consulting Llc | 0 | -100,00 | 0 | -100,00 | ||||
| 2025-08-14 | 13F | Prestige Wealth Management Group LLC | 343 | 0,00 | 2 | 0,00 | ||||
| 2025-08-14 | 13F | Safeguard Investment Advisory Group, LLC | 14.590 | 2,22 | 85 | 7,69 | ||||
| 2025-07-29 | 13F | Stephens Inc /ar/ | 16.873 | 0,00 | 98 | 6,52 | ||||
| 2025-07-24 | 13F | Ronald Blue Trust, Inc. | 2.000 | 12 | ||||||
| 2025-08-18 | 13F | Hollencrest Capital Management | 95.533 | 0,00 | 556 | 5,70 | ||||
| 2025-08-18 | 13F | Tactive Advisors, LLC | 17.154 | 100 | ||||||
| 2025-08-18 | 13F | Geneos Wealth Management Inc. | 5.100 | 200,00 | 30 | 222,22 | ||||
| 2025-08-14 | 13F | Susquehanna International Group, Llp | 0 | -100,00 | 0 | |||||
| 2025-08-14 | 13F | Synovus Financial Corp | 39.468 | 0,00 | 230 | 5,53 | ||||
| 2025-08-26 | 13F/A | Thrivent Financial For Lutherans | 191.249 | 0,68 | 1 | 0,00 | ||||
| 2025-07-15 | 13F | Kentucky Trust Co | 7.400 | 0,00 | 43 | 7,50 | ||||
| 2025-08-07 | 13F | PCG Wealth Advisors, LLC | 0 | -100,00 | 0 | |||||
| 2025-08-08 | 13F | Good Life Advisors, LLC | 22.161 | 10,03 | 129 | 16,36 | ||||
| 2025-08-12 | 13F | J.w. Cole Advisors, Inc. | 1.258.278 | 74,69 | 7.323 | 84,55 | ||||
| 2025-08-08 | 13F | MTM Investment Management, LLC | 13.530 | 0,00 | 79 | 5,41 | ||||
| 2025-07-18 | 13F | Truist Financial Corp | 20.567 | -0,36 | 120 | 5,31 | ||||
| 2025-08-08 | 13F | Avantax Advisory Services, Inc. | 46.000 | -0,48 | 268 | 5,12 | ||||
| 2025-08-11 | 13F | Rothschild Investment Llc | 6.000 | 0,00 | 35 | 3,03 |