Statistiche di base
| Proprietari istituzionali | 76 total, 76 long only, 0 short only, 0 long/short - change of -15,22% MRQ |
| Allocazione media del portafoglio | 0.0359 % - change of -24,91% MRQ |
| Azioni istituzionali (Long) | 2.635.896 (ex 13D/G) - change of -0,28MM shares -9,65% MRQ |
| Valore istituzionale (Long) | $ 66.999 USD ($1000) |
Proprietà istituzionale e azionisti
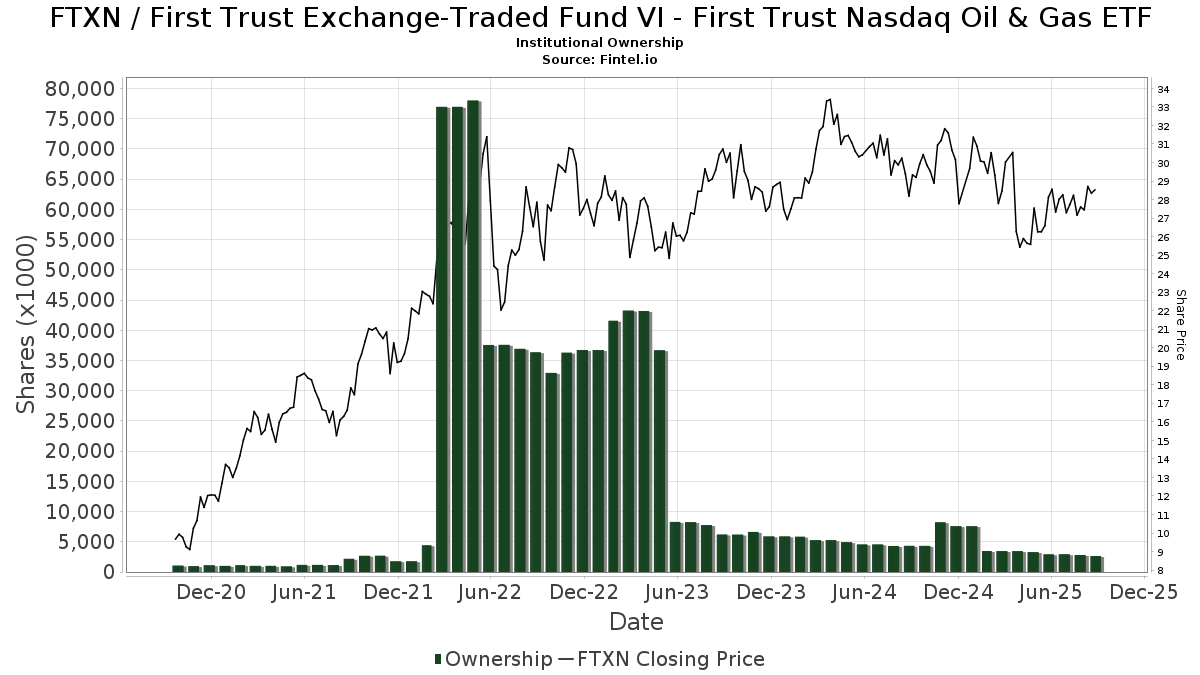
First Trust Exchange-Traded Fund VI - First Trust Nasdaq Oil & Gas ETF (US:FTXN) ha 76 proprietari istituzionali e azionisti che hanno presentato i moduli 13D/G o 13F alla Securities Exchange Commission (SEC). Queste istituzioni detengono un totale di 2,635,896 azioni. I maggiori azionisti includono Morgan Stanley, LPL Financial LLC, Advisor Group Holdings, Inc., Truist Financial Corp, Cetera Investment Advisers, Wells Fargo & Company/mn, Raymond James Financial Inc, SFI Advisors, LLC, Envestnet Asset Management Inc, and Commonwealth Equity Services, Llc .
(First Trust Exchange-Traded Fund VI - First Trust Nasdaq Oil & Gas ETF (NasdaqGM:FTXN) la struttura proprietaria istituzionale mostra le attuali posizioni nella società da parte di istituzioni e fondi, nonché le ultime variazioni nella dimensione della posizione. I principali azionisti possono essere singoli investitori, fondi comuni, hedge fund o istituzioni. L'allegato 13D indica che l'investitore detiene (o ha detenuto) più del 5% della società e intende (o intendeva) perseguire attivamente un cambiamento nella strategia aziendale. L'allegato 13G indica un investimento passivo superiore al 5%.
The share price as of September 5, 2025 is 28,04 / share. Previously, on September 6, 2024, the share price was 28,77 / share. This represents a decline of 2,54% over that period.
Indice del sentiment dei fondi
L'indice del sentiment dei fondi (anche noto come "indice di accumulo di proprietà") individua i titoli più acquistati dai fondi. È il risultato di un sofisticato modello quantitativo multi-fattore che identifica le società con i più alti livelli di accumulo istituzionale. Il modello utilizza una combinazione dell'aumento totale dei proprietari dichiarati, delle variazioni nelle allocazioni di portafoglio di tali proprietari e di altre metriche. Il punteggio varia da 0 a 100: i numeri più alti indicano un livello di accumulo superiore ad altre società, mentre 50 rappresenta la media.
Frequenza di aggiornamento: giornaliera
Consulta Ownership Explorer per visualizzare l'elenco delle aziende con il ranking più alto.
Rapporto put/call istituzionale
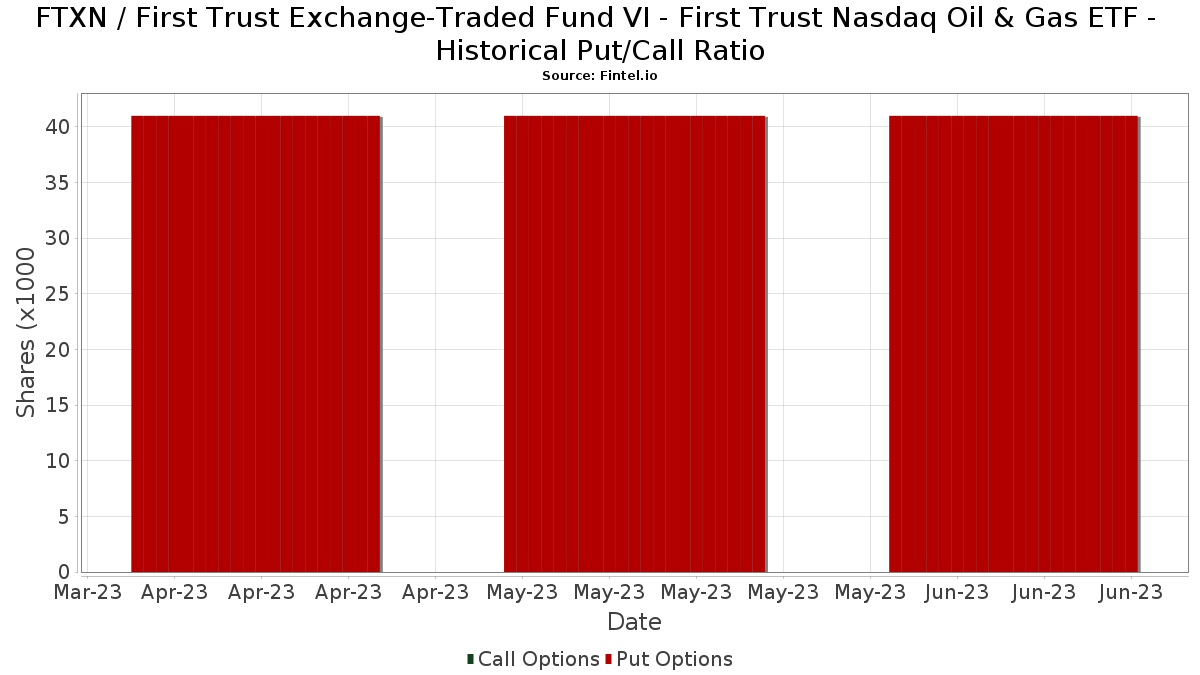
Oltre a segnalare le emissioni standard di titoli azionari e di debito, gli istituti con più di 100 milioni di asset in gestione devono anche dichiarare le loro partecipazioni in opzioni put e call. Poiché le opzioni put indicano generalmente un sentiment negativo e le opzioni call un sentiment positivo, possiamo avere un'idea del sentiment istituzionale complessivo attraverso il rapporto tra put e call. Il grafico a destra mostra il rapporto storico put/call per questo strumento.
L'utilizzo del rapporto put/call come indicatore del sentiment degli investitori consente di superare una delle principali lacune dell'utilizzo della proprietà istituzionale totale, ovvero il fatto che una quantità significativa di asset in gestione viene investita passivamente per seguire gli indici. Generalmente, i fondi a gestione passiva non acquistano opzioni, per cui il rapporto put/call riflette più fedelmente il sentiment dei fondi a gestione attiva.
Depositi 13F e NPORT
Le informazioni relative ai depositi 13F sono gratuite. Per accedere alle informazioni relative ai depositi NP è necessario un'abbonamento premium. Le righe verdi indicano le nuove posizioni. Le righe rosse indicano le posizioni chiuse. Fai clic sull'icona del link per visualizzare la cronologia completa delle transazioni.
Esegui l'upgrade
per sbloccare i dati premium ed esportarli in Excel ![]() .
.
| Data di deposito | Fonte | Investitore | Tipo | Prezzo medio (Stima) |
Azioni | Δ Azioni (%) |
Valore dichiarato ($ 1000) |
Δ Valore (%) |
Allocazione del portafoglio (%) |
|
|---|---|---|---|---|---|---|---|---|---|---|
| 2025-08-11 | 13F | Principal Securities, Inc. | 3.677 | 31,32 | 100 | 25,00 | ||||
| 2025-08-06 | 13F | Golden State Wealth Management, LLC | 456 | 0,00 | 12 | -7,69 | ||||
| 2025-08-12 | 13F | LPL Financial LLC | 490.829 | -6,92 | 13.355 | -16,36 | ||||
| 2025-08-13 | 13F | Transce3nd, LLC | 8 | 0 | ||||||
| 2025-07-17 | 13F | Wagner Wealth Management, Llc | 1 | 0,00 | 0 | |||||
| 2025-07-31 | 13F | Cambridge Investment Research Advisors, Inc. | 23.726 | -50,97 | 1 | -100,00 | ||||
| 2025-08-08 | 13F | Glassman Wealth Services | 0 | -100,00 | 0 | |||||
| 2025-08-06 | 13F | Commonwealth Equity Services, Llc | 62.779 | -4,28 | 2 | 0,00 | ||||
| 2025-08-06 | 13F | AE Wealth Management LLC | 326 | 71,58 | 9 | 60,00 | ||||
| 2025-08-29 | 13F | Centaurus Financial, Inc. | 10.310 | 6,94 | 0 | |||||
| 2025-04-28 | 13F | Private Trust Co Na | 0 | -100,00 | 0 | |||||
| 2025-07-28 | 13F | Kiker Wealth Management, LLC | 71 | 0,00 | 2 | -50,00 | ||||
| 2025-07-29 | 13F | Activest Wealth Management | 5.524 | 0,00 | 150 | -10,18 | ||||
| 2025-08-14 | 13F | Citadel Advisors Llc | 34.861 | 18,45 | 949 | 6,40 | ||||
| 2025-07-08 | 13F | Nbc Securities, Inc. | 1.848 | 2,61 | 0 | |||||
| 2025-07-25 | 13F | Total Clarity Wealth Management, Inc. | 0 | -100,00 | 0 | |||||
| 2025-08-14 | 13F | Harvest Investment Services, LLC | 15.531 | 1,04 | 423 | -9,25 | ||||
| 2025-08-18 | 13F | Geneos Wealth Management Inc. | 725 | -52,46 | 20 | -58,70 | ||||
| 2025-09-04 | 13F/A | Advisor Group Holdings, Inc. | 245.169 | 155,05 | 6.677 | 129,21 | ||||
| 2025-05-16 | 13F | Laidlaw Wealth Management LLC | 0 | -100,00 | 0 | -100,00 | ||||
| 2025-08-04 | 13F | L.m. Kohn & Company | 9.563 | 0,00 | 260 | -10,03 | ||||
| 2025-07-22 | 13F | DAVENPORT & Co LLC | 21.634 | -24,71 | 589 | -32,41 | ||||
| 2025-07-25 | 13F | Cwm, Llc | 44.822 | -1,24 | 1 | 0,00 | ||||
| 2025-08-14 | 13F | Bank Of America Corp /de/ | 8.548 | -52,48 | 233 | -57,35 | ||||
| 2025-08-12 | 13F | Proequities, Inc. | 0 | 0 | ||||||
| 2025-08-14 | 13F | MGB Wealth Management, LLC | 6.425 | 0,00 | 175 | -10,31 | ||||
| 2025-05-14 | 13F | Rockefeller Capital Management L.P. | 0 | -100,00 | 0 | |||||
| 2025-08-14 | 13F | Royal Bank Of Canada | 30.457 | -40,36 | 829 | -46,38 | ||||
| 2025-08-01 | 13F | Envestnet Asset Management Inc | 86.186 | -6,32 | 2.345 | -15,80 | ||||
| 2025-07-24 | 13F | Insight Inv LLC | 201 | 0,00 | 5 | -16,67 | ||||
| 2025-08-14 | 13F | Financial Advisory Service, Inc. | 2.672 | 0,79 | 73 | -10,00 | ||||
| 2025-08-14 | 13F | Wells Fargo & Company/mn | 111.906 | -9,71 | 3.045 | -18,89 | ||||
| 2025-05-09 | 13F | CoreCap Advisors, LLC | 0 | -100,00 | 0 | |||||
| 2025-04-30 | 13F | Sofos Investments, Inc. | 0 | -100,00 | 0 | -100,00 | ||||
| 2025-08-11 | 13F | Citigroup Inc | 0 | -100,00 | 0 | |||||
| 2025-08-04 | 13F | Creekmur Asset Management LLC | 0 | -100,00 | 0 | |||||
| 2025-08-14 | 13F | UBS Group AG | 619 | -92,84 | 17 | -93,87 | ||||
| 2025-07-17 | 13F | Janney Montgomery Scott LLC | 13.508 | -12,64 | 0 | |||||
| 2025-07-14 | 13F | AdvisorNet Financial, Inc | 0 | -100,00 | 0 | |||||
| 2025-07-14 | 13F | U.S. Capital Wealth Advisors, LLC | 7.999 | 0,00 | 218 | -10,33 | ||||
| 2025-08-14 | 13F | Susquehanna International Group, Llp | 17.313 | -48,90 | 471 | -54,05 | ||||
| 2025-05-16 | 13F | Coppell Advisory Solutions LLC | 0 | -100,00 | 0 | |||||
| 2025-07-07 | 13F | Nova Wealth Management, Inc. | 307 | -92,54 | 8 | -93,55 | ||||
| 2025-08-14 | 13F | Comerica Bank | 181 | 0,00 | 5 | -20,00 | ||||
| 2025-05-29 | 13F | Apeiron RIA LLC | 0 | -100,00 | 0 | |||||
| 2025-08-12 | 13F | Quantum Private Wealth, LLC | 28.985 | -23,70 | 789 | -31,48 | ||||
| 2025-07-30 | 13F | D.a. Davidson & Co. | 0 | -100,00 | 0 | |||||
| 2025-08-13 | 13F | Flow Traders U.s. Llc | 0 | -100,00 | 0 | |||||
| 2025-08-15 | 13F | Tower Research Capital LLC (TRC) | 6.035 | -68,95 | 164 | -72,11 | ||||
| 2025-08-14 | 13F | Goldman Sachs Group Inc | 18.977 | 18,41 | 516 | 6,39 | ||||
| 2025-07-24 | 13F | IFP Advisors, Inc | 171 | -64,89 | 5 | -71,43 | ||||
| 2025-08-12 | 13F | Archer Investment Corp | 67 | 1,52 | 2 | -50,00 | ||||
| 2025-07-25 | 13F | Atria Wealth Solutions, Inc. | 12.489 | 2,46 | 345 | -6,78 | ||||
| 2025-08-14 | 13F | Raymond James Financial Inc | 105.186 | -11,41 | 2.862 | -20,39 | ||||
| 2025-07-18 | 13F | Truist Financial Corp | 139.412 | -10,88 | 3.793 | -19,91 | ||||
| 2025-07-25 | 13F | We Are One Seven, LLC | 8.506 | -6,74 | 231 | -16,30 | ||||
| 2025-08-06 | 13F | Mark Sheptoff Financial Planning, Llc | 333 | 0,00 | 9 | -10,00 | ||||
| 2025-08-12 | 13F | Jpmorgan Chase & Co | 0 | -100,00 | 0 | -100,00 | ||||
| 2025-08-15 | 13F | Morgan Stanley | 541.710 | -4,36 | 14.740 | -14,06 | ||||
| 2025-08-19 | 13F | Anchor Investment Management, LLC | 1.105 | 0,00 | 30 | -9,09 | ||||
| 2025-08-14 | 13F | Tudor Financial Inc. | 0 | -100,00 | 0 | |||||
| 2025-08-05 | 13F | HFG Advisors, Inc. | 9.360 | -3,85 | 255 | -13,61 | ||||
| 2025-04-10 | 13F | Clarus Wealth Advisors | 0 | -100,00 | 0 | |||||
| 2025-08-08 | 13F | Avantax Advisory Services, Inc. | 0 | -100,00 | 0 | |||||
| 2025-08-14 | 13F | EP Wealth Advisors, Inc. | 4.545 | -0,70 | 124 | -10,87 | ||||
| 2025-08-05 | 13F | Westside Investment Management, Inc. | 549 | 0,00 | 15 | -12,50 | ||||
| 2025-08-12 | 13F | Steward Partners Investment Advisory, Llc | 4.619 | -22,82 | 126 | -30,94 | ||||
| 2025-07-21 | 13F | HighMark Wealth Management LLC | 1.150 | 0,00 | 31 | -8,82 | ||||
| 2025-08-11 | 13F | SFI Advisors, LLC | 89.943 | -3,86 | 2.447 | -13,59 | ||||
| 2025-08-08 | 13F | Pnc Financial Services Group, Inc. | 500 | 0,00 | 14 | -13,33 | ||||
| 2025-08-05 | 13F | Sigma Planning Corp | 20.426 | 556 | ||||||
| 2025-07-31 | 13F | Brinker Capital Investments, LLC | 0 | -100,00 | 0 | -100,00 | ||||
| 2025-08-11 | 13F | Private Advisor Group, LLC | 14.371 | -52,55 | 391 | -57,36 | ||||
| 2025-08-14 | 13F | Fmr Llc | 1.267 | 19,08 | 34 | 6,25 | ||||
| 2025-08-14 | 13F | Stifel Financial Corp | 10.132 | -54,36 | 276 | -59,08 | ||||
| 2025-08-12 | 13F | Global Retirement Partners, LLC | 2.262 | -21,87 | 62 | -26,51 | ||||
| 2025-05-14 | 13F | Jane Street Group, Llc | 0 | -100,00 | 0 | |||||
| 2025-05-15 | 13F | StoneX Group Inc. | 0 | -100,00 | 0 | -100,00 | ||||
| 2025-07-28 | 13F | Harbour Investments, Inc. | 6.152 | -2,27 | 167 | -12,11 | ||||
| 2025-08-12 | 13F | J.w. Cole Advisors, Inc. | 7.765 | 2,12 | 211 | -8,26 | ||||
| 2025-07-24 | 13F | Cyndeo Wealth Partners, LLC | 12.439 | 0,00 | 338 | -10,11 | ||||
| 2025-08-14 | 13F | Vivaldi Capital Management, LLC | 0 | -100,00 | 0 | |||||
| 2025-08-14 | 13F | Transamerica Financial Advisors, Inc. | 71 | 0,00 | 2 | |||||
| 2025-08-11 | 13F | Regal Investment Advisors LLC | 9.510 | -6,31 | 259 | -15,96 | ||||
| 2025-07-28 | 13F | Mutual Advisors, LLC | 11.417 | -12,10 | 319 | -6,74 | ||||
| 2025-08-11 | 13F | Y.D. More Investments Ltd | 0 | -100,00 | 0 | |||||
| 2025-08-14 | 13F | Two Sigma Investments, Lp | 0 | -100,00 | 0 | |||||
| 2025-07-08 | 13F | Adamsbrown Wealth Consultants Llc | 9.357 | 11,79 | 255 | 0,40 | ||||
| 2025-08-11 | 13F | HHM Wealth Advisors, LLC | 666 | 0,00 | 18 | -10,00 | ||||
| 2025-08-14 | 13F | GWM Advisors LLC | 2.934 | -73,87 | 80 | -76,70 | ||||
| 2025-08-13 | 13F | Green Harvest Asset Management LLC | 16.849 | -58,58 | 458 | -62,79 | ||||
| 2025-07-29 | 13F | International Assets Investment Management, Llc | 55.748 | -3,69 | 1.517 | -13,47 | ||||
| 2025-08-08 | 13F | Cetera Investment Advisers | 130.120 | 6,55 | 3.541 | -4,25 | ||||
| 2025-08-04 | 13F | Assetmark, Inc | 0 | -100,00 | 0 | |||||
| 2025-08-26 | 13F | Claris Financial LLC | 0 | -100,00 | 0 | |||||
| 2025-07-17 | 13F | HB Wealth Management, LLC | 7.877 | 214 | ||||||
| 2025-07-24 | 13F | Ronald Blue Trust, Inc. | 48 | 0,00 | 1 | 0,00 | ||||
| 2025-08-14 | 13F | Marshall Investment Management, Llc | 0 | -100,00 | 0 | |||||
| 2025-08-14 | 13F | Mml Investors Services, Llc | 16.054 | 4,00 | 0 | |||||
| 2025-08-07 | 13F | Hughes Financial Services, LLC | 330 | 0,00 | 9 | -20,00 | ||||
| 2025-08-14 | 13F | Quantinno Capital Management LP | 23.220 | 19,05 | 632 | 6,95 | ||||
| 2025-05-15 | 13F | National Wealth Management Group, LLC | 0 | -100,00 | 0 | -100,00 | ||||
| 2025-08-12 | 13F | SRS Capital Advisors, Inc. | 0 | -100,00 | 0 | |||||
| 2025-05-12 | 13F | Independent Advisor Alliance | 0 | -100,00 | 0 | |||||
| 2025-05-19 | 13F | Heck Capital Advisors, LLC | 0 | 0 | ||||||
| 2025-08-15 | 13F | Kestra Advisory Services, LLC | 30.368 | 6,95 | 826 | -3,84 | ||||
| 2025-08-05 | 13F | Huntington National Bank | 52 | -41,38 | ||||||
| 2025-08-07 | 13F | Kestra Private Wealth Services, Llc | 0 | -100,00 | 0 | -100,00 | ||||
| 2025-08-01 | 13F | Rossby Financial, LCC | 325 | 0,00 | 9 | 0,00 | ||||
| 2025-07-29 | 13F | Stratos Wealth Partners, LTD. | 14.364 | -24,02 | 391 | -31,82 |