Statistiche di base
| Proprietari istituzionali | 93 total, 93 long only, 0 short only, 0 long/short - change of 10,59% MRQ |
| Allocazione media del portafoglio | 0.8378 % - change of -10,39% MRQ |
| Azioni istituzionali (Long) | 21.514.870 (ex 13D/G) - change of -2,44MM shares -10,18% MRQ |
| Valore istituzionale (Long) | $ 1.315.826 USD ($1000) |
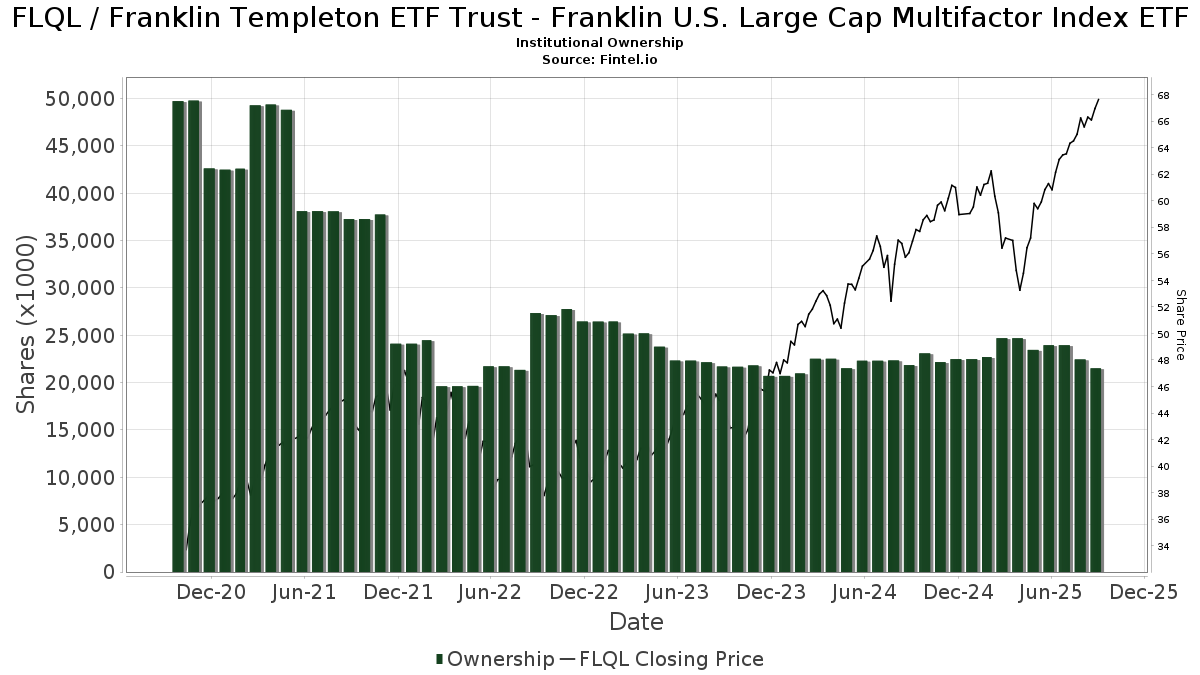
Proprietà istituzionale e azionisti
Franklin Templeton ETF Trust - Franklin U.S. Large Cap Multifactor Index ETF (US:FLQL) ha 93 proprietari istituzionali e azionisti che hanno presentato i moduli 13D/G o 13F alla Securities Exchange Commission (SEC). Queste istituzioni detengono un totale di 21,514,870 azioni. I maggiori azionisti includono Franklin Resources Inc, Bank Of America Corp /de/, FGTZX - Franklin Growth Allocation Fund Advisor Class, FMTZX - Franklin Moderate Allocation Fund Advisor Class, Steward Partners Investment Advisory, Llc, Bank of New York Mellon Corp, Morgan Stanley, LPL Financial LLC, FTCZX - Franklin Conservative Allocation Fund Advisor Class, and Janney Montgomery Scott LLC .
(Franklin Templeton ETF Trust - Franklin U.S. Large Cap Multifactor Index ETF (BATS:FLQL) la struttura proprietaria istituzionale mostra le attuali posizioni nella società da parte di istituzioni e fondi, nonché le ultime variazioni nella dimensione della posizione. I principali azionisti possono essere singoli investitori, fondi comuni, hedge fund o istituzioni. L'allegato 13D indica che l'investitore detiene (o ha detenuto) più del 5% della società e intende (o intendeva) perseguire attivamente un cambiamento nella strategia aziendale. L'allegato 13G indica un investimento passivo superiore al 5%.
The share price as of September 5, 2025 is 66,58 / share. Previously, on September 6, 2024, the share price was 54,57 / share. This represents an increase of 22,02% over that period.
Indice del sentiment dei fondi
L'indice del sentiment dei fondi (anche noto come "indice di accumulo di proprietà") individua i titoli più acquistati dai fondi. È il risultato di un sofisticato modello quantitativo multi-fattore che identifica le società con i più alti livelli di accumulo istituzionale. Il modello utilizza una combinazione dell'aumento totale dei proprietari dichiarati, delle variazioni nelle allocazioni di portafoglio di tali proprietari e di altre metriche. Il punteggio varia da 0 a 100: i numeri più alti indicano un livello di accumulo superiore ad altre società, mentre 50 rappresenta la media.
Frequenza di aggiornamento: giornaliera
Consulta Ownership Explorer per visualizzare l'elenco delle aziende con il ranking più alto.
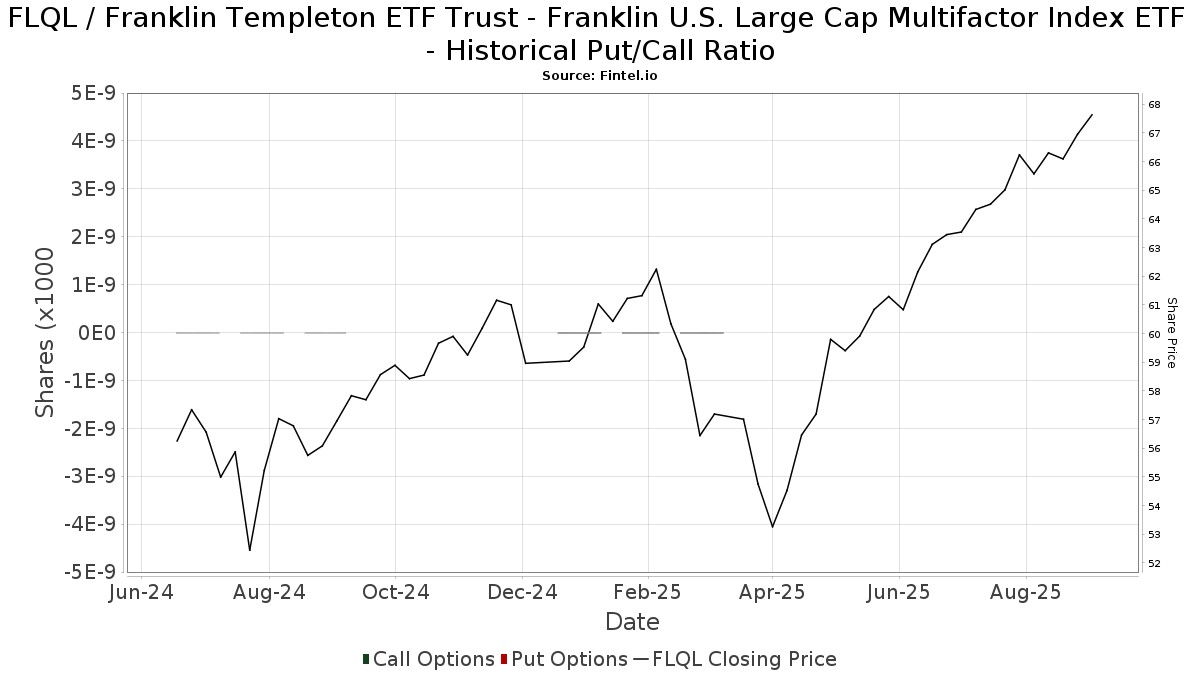
Rapporto put/call istituzionale
Oltre a segnalare le emissioni standard di titoli azionari e di debito, gli istituti con più di 100 milioni di asset in gestione devono anche dichiarare le loro partecipazioni in opzioni put e call. Poiché le opzioni put indicano generalmente un sentiment negativo e le opzioni call un sentiment positivo, possiamo avere un'idea del sentiment istituzionale complessivo attraverso il rapporto tra put e call. Il grafico a destra mostra il rapporto storico put/call per questo strumento.
L'utilizzo del rapporto put/call come indicatore del sentiment degli investitori consente di superare una delle principali lacune dell'utilizzo della proprietà istituzionale totale, ovvero il fatto che una quantità significativa di asset in gestione viene investita passivamente per seguire gli indici. Generalmente, i fondi a gestione passiva non acquistano opzioni, per cui il rapporto put/call riflette più fedelmente il sentiment dei fondi a gestione attiva.
Depositi 13F e NPORT
Le informazioni relative ai depositi 13F sono gratuite. Per accedere alle informazioni relative ai depositi NP è necessario un'abbonamento premium. Le righe verdi indicano le nuove posizioni. Le righe rosse indicano le posizioni chiuse. Fai clic sull'icona del link per visualizzare la cronologia completa delle transazioni.
Esegui l'upgrade
per sbloccare i dati premium ed esportarli in Excel ![]() .
.
| Data di deposito | Fonte | Investitore | Tipo | Prezzo medio (Stima) |
Azioni | Δ Azioni (%) |
Valore dichiarato ($ 1000) |
Δ Valore (%) |
Allocazione del portafoglio (%) |
|
|---|---|---|---|---|---|---|---|---|---|---|
| 2025-07-30 | 13F | Bogart Wealth, LLC | 18.745 | 0,00 | 1.184 | 11,92 | ||||
| 2025-07-14 | 13F | Park Avenue Securities Llc | 9.596 | 19,19 | 1 | |||||
| 2025-08-14 | 13F | Mml Investors Services, Llc | 16.159 | 1 | ||||||
| 2025-08-26 | NP | FLTFX - Franklin LifeSmart 2055 Retirement Target Fund Class A | 53.374 | 0,61 | 3.371 | 12,59 | ||||
| 2025-07-25 | 13F | Concurrent Investment Advisors, LLC | 3.173 | 200 | ||||||
| 2025-08-14 | 13F | Modern Wealth Management, LLC | 5.518 | -15,34 | 349 | -5,18 | ||||
| 2025-08-14 | 13F | Sunbelt Securities, Inc. | 84 | 0,00 | 5 | 0,00 | ||||
| 2025-08-05 | 13F | Simplex Trading, Llc | 50 | 0 | ||||||
| 2025-08-11 | 13F | Wbi Investments, Inc. | 5.109 | 0,00 | 323 | 11,81 | ||||
| 2025-08-14 | 13F | Raymond James Financial Inc | 202.598 | -7,12 | 12.796 | 3,94 | ||||
| 2025-08-11 | 13F | Nations Financial Group Inc, /ia/ /adv | 3.495 | 221 | ||||||
| 2025-08-14 | 13F | UBS Group AG | 100.114 | 8,29 | 6.323 | 21,20 | ||||
| 2025-08-28 | NP | TFAGX - TFA AlphaGen Growth Fund Class I | 7.000 | 442 | ||||||
| 2025-07-31 | 13F | Arrien Investments, Inc. | 20.836 | 3,93 | 1.316 | 16,27 | ||||
| 2025-07-24 | 13F | IFP Advisors, Inc | 1.188 | -1,49 | 75 | 10,29 | ||||
| 2025-08-14 | 13F | Fmr Llc | 4.944 | -13,88 | 312 | -3,41 | ||||
| 2025-08-14 | 13F | Citadel Advisors Llc | Put | 0 | -100,00 | 0 | ||||
| 2025-08-14 | 13F | Bank Of America Corp /de/ | 2.180.552 | 25,36 | 137.724 | 40,28 | ||||
| 2025-07-25 | 13F | Envestnet Portfolio Solutions, Inc. | 6.233 | -59,76 | 394 | -55,03 | ||||
| 2025-07-30 | 13F | D.a. Davidson & Co. | 7.677 | 0,00 | 485 | 11,78 | ||||
| 2025-07-11 | 13F | SILVER OAK SECURITIES, Inc | 18.613 | 752,24 | 1.176 | 863,11 | ||||
| 2025-07-28 | 13F | Harbour Investments, Inc. | 1.240 | 0,00 | 78 | 13,04 | ||||
| 2025-08-05 | 13F | Bank Of Montreal /can/ | 318 | 0,00 | 20 | 17,65 | ||||
| 2025-08-05 | 13F | Huntington National Bank | 20 | |||||||
| 2025-08-06 | 13F | Commonwealth Equity Services, Llc | 37.866 | 5,51 | 2 | 0,00 | ||||
| 2025-08-15 | 13F | Morgan Stanley | 568.511 | -1,33 | 35.907 | 10,42 | ||||
| 2025-08-14 | 13F | Susquehanna International Group, Llp | 42.154 | -22,79 | 2.662 | -13,60 | ||||
| 2025-08-13 | 13F | Jones Financial Companies Lllp | 136.883 | 46,52 | 8.584 | 63,83 | ||||
| 2025-08-14 | 13F | Jane Street Group, Llc | 0 | -100,00 | 0 | |||||
| 2025-08-14 | 13F | Citadel Advisors Llc | Call | 0 | -100,00 | 0 | ||||
| 2025-08-01 | 13F | Rossby Financial, LCC | 902 | 0,00 | 57 | 12,00 | ||||
| 2025-08-08 | 13F | Glassman Wealth Services | 656 | 0,00 | 41 | 10,81 | ||||
| 2025-05-16 | 13F | Coppell Advisory Solutions LLC | 0 | -100,00 | 0 | |||||
| 2025-08-14 | 13F | Federation des caisses Desjardins du Quebec | 622 | 0,00 | 39 | 11,43 | ||||
| 2025-08-11 | 13F | Paul R. Ried Financial Group, LLC | 52.084 | -0,98 | 3.290 | 10,82 | ||||
| 2025-04-10 | 13F | Key Client Fiduciary Advisors, LLC | 0 | -100,00 | 0 | |||||
| 2025-08-14 | 13F | Stifel Financial Corp | 14.449 | -4,03 | 913 | 7,42 | ||||
| 2025-08-14 | 13F | Two Sigma Investments, Lp | 36.400 | 2.299 | ||||||
| 2025-08-26 | NP | FLSJX - Franklin LifeSmart 2050 Retirement Target Fund Class A | 68.937 | -2,37 | 4.354 | 9,26 | ||||
| 2025-07-07 | 13F | Thurston, Springer, Miller, Herd & Titak, Inc. | 35 | -75,00 | 2 | -71,43 | ||||
| 2025-05-15 | 13F | National Wealth Management Group, LLC | 5.031 | 284 | ||||||
| 2025-08-13 | 13F | GeoWealth Management, LLC | 32 | 2 | ||||||
| 2025-08-01 | 13F | Envestnet Asset Management Inc | 145.733 | -2,93 | 9.204 | 8,63 | ||||
| 2025-04-23 | 13F | Win Advisors, Inc | 0 | -100,00 | 0 | |||||
| 2025-08-26 | NP | FMTZX - Franklin Moderate Allocation Fund Advisor Class | 1.378.267 | -11,28 | 87.051 | -0,71 | ||||
| 2025-08-04 | 13F | Atria Investments Llc | 24.310 | -90,54 | 1.535 | -89,42 | ||||
| 2025-08-26 | NP | FLADX - Franklin LifeSmart 2040 Retirement Target Fund Class A | 65.192 | -2,65 | 4.118 | 8,94 | ||||
| 2025-07-29 | 13F | Crux Wealth Advisors | 23.554 | -54,25 | 1.488 | -48,81 | ||||
| 2025-08-12 | 13F | Proequities, Inc. | 0 | 0 | ||||||
| 2025-07-22 | 13F | SOL Capital Management CO | 27.938 | 12,98 | 2 | 0,00 | ||||
| 2025-07-09 | 13F | Christopher J. Hasenberg, Inc | 57.285 | -53,71 | 3.618 | -48,40 | ||||
| 2025-08-12 | 13F | Cornerstone Wealth Management, LLC | 82.305 | -0,83 | 5.198 | 10,97 | ||||
| 2025-08-11 | 13F | Core Wealth Partners LLC | 15.534 | 0,00 | 981 | 11,99 | ||||
| 2025-08-04 | 13F | Arkadios Wealth Advisors | 151.475 | 6,74 | 9.567 | 19,45 | ||||
| 2025-08-12 | 13F | Steward Partners Investment Advisory, Llc | 1.020.887 | 6,71 | 64.479 | 19,42 | ||||
| 2025-08-14 | 13F | GWM Advisors LLC | 5.944 | -6,60 | 375 | 4,46 | ||||
| 2025-08-12 | 13F | LPL Financial LLC | 560.858 | 17,84 | 35.424 | 31,88 | ||||
| 2025-08-08 | 13F | Avantax Advisory Services, Inc. | 105.330 | 1,94 | 6.653 | 14,08 | ||||
| 2025-07-30 | 13F | Brookstone Capital Management | 156.377 | 10,20 | 9.877 | 23,33 | ||||
| 2025-08-14 | 13F | Goldman Sachs Group Inc | 35.824 | 52,14 | 2.263 | 70,33 | ||||
| 2025-08-28 | NP | TFAFX - Tactical Growth Allocation Fund Class I | 1.900 | 120 | ||||||
| 2025-07-25 | 13F | Atria Wealth Solutions, Inc. | 4.996 | -79,01 | 317 | -76,47 | ||||
| 2025-08-12 | 13F | Leigh Baldwin & Co., Llc | 3.922 | -16,05 | 248 | -6,08 | ||||
| 2025-04-17 | 13F | Abound Wealth Management | 0 | -100,00 | 0 | -100,00 | ||||
| 2025-08-05 | 13F | Bank of New York Mellon Corp | 899.593 | -3,32 | 56.818 | 8,19 | ||||
| 2025-07-30 | 13F | Cullen/frost Bankers, Inc. | 5.048 | 2,58 | 319 | 14,80 | ||||
| 2025-08-26 | NP | FLRMX - Franklin LifeSmart 2020 Retirement Target Fund Class A | 13.503 | -9,85 | 853 | 0,83 | ||||
| 2025-08-13 | 13F/A | StoneX Group Inc. | 0 | -100,00 | 0 | -100,00 | ||||
| 2025-08-18 | 13F | Geneos Wealth Management Inc. | 11.149 | -4,34 | 704 | 7,15 | ||||
| 2025-08-26 | NP | FTTAX - Franklin LifeSmart 2045 Retirement Target Fund CLASS A | 117.692 | -3,45 | 7.433 | 8,05 | ||||
| 2025-08-07 | 13F | Atala Financial Inc | 0 | -100,00 | 0 | |||||
| 2025-08-05 | 13F | Tiaa Trust, National Association | 3.334 | 211 | ||||||
| 2025-08-14 | 13F | Qube Research & Technologies Ltd | 1.286 | 81 | ||||||
| 2025-08-26 | NP | FTRCX - Franklin LifeSmart 2035 Retirement Target Fund CLASS C | 127.224 | -3,84 | 8.035 | 7,62 | ||||
| 2025-08-26 | NP | FTCZX - Franklin Conservative Allocation Fund Advisor Class | 470.802 | -13,86 | 29.736 | -3,61 | ||||
| 2025-07-25 | 13F | Cwm, Llc | 35.895 | 17,45 | 2 | 100,00 | ||||
| 2025-05-06 | 13F | AE Wealth Management LLC | 0 | -100,00 | 0 | -100,00 | ||||
| 2025-08-12 | 13F | Jpmorgan Chase & Co | 361.334 | 17,87 | 22.822 | 31,90 | ||||
| 2025-07-28 | 13F | Sagespring Wealth Partners, Llc | 31.495 | -1,29 | 1.989 | 10,50 | ||||
| 2025-08-26 | NP | FGTZX - Franklin Growth Allocation Fund Advisor Class | 1.549.976 | -8,91 | 97.896 | 1,94 | ||||
| 2025-08-04 | 13F | Pensionmark Financial Group, Llc | 86.818 | -11,27 | 5.483 | -0,71 | ||||
| 2025-08-14 | 13F | Wells Fargo & Company/mn | 156.347 | 1,56 | 9.875 | 13,65 | ||||
| 2025-08-15 | 13F | Equitable Holdings, Inc. | 67.713 | -8,94 | 4.277 | 1,91 | ||||
| 2025-08-11 | 13F | TD Waterhouse Canada Inc. | 509 | 0,00 | 32 | 14,29 | ||||
| 2025-08-08 | 13F | Cetera Investment Advisers | 342.871 | 5,32 | 21.656 | 17,86 | ||||
| 2025-08-12 | 13F | O'shaughnessy Asset Management, Llc | 240 | -2,04 | 15 | 15,38 | ||||
| 2025-08-14 | 13F | Royal Bank Of Canada | 16.712 | 0,34 | 1.056 | 12,34 | ||||
| 2025-04-24 | 13F | Decker Retirement Planning Inc. | 0 | -100,00 | 0 | |||||
| 2025-07-17 | 13F | Janney Montgomery Scott LLC | 370.460 | -4,66 | 23 | 9,52 | ||||
| 2025-07-23 | 13F | Lakeshore Capital Group, Inc. | 35.049 | -1,67 | 2.214 | 10,04 | ||||
| 2025-08-04 | 13F | Assetmark, Inc | 1.010 | 0,00 | 64 | 10,53 | ||||
| 2025-09-04 | 13F/A | Advisor Group Holdings, Inc. | 63.859 | 14,80 | 4.033 | 28,48 | ||||
| 2025-08-12 | 13F | BlackRock, Inc. | 1.355 | 86 | ||||||
| 2025-08-26 | NP | FTRTX - Franklin LifeSmart 2025 Retirement Target Fund CLASS A | 70.386 | -7,82 | 4.446 | 3,16 | ||||
| 2025-08-26 | NP | FLJSX - Franklin LifeSmart 2060 Retirement Target Fund Advisor Class | 11.555 | 5,96 | 730 | 18,54 | ||||
| 2025-08-12 | 13F | Franklin Resources Inc | 8.591.482 | -10,12 | 542.638 | 0,58 | ||||
| 2025-08-15 | 13F | Kestra Advisory Services, LLC | 27.727 | -2,52 | 1.751 | 9,10 | ||||
| 2025-08-14 | 13F | Mariner, LLC | 53.296 | 1,85 | 3.366 | 13,99 | ||||
| 2025-08-26 | NP | FLRZX - Franklin LifeSmart 2030 Retirement Target Fund Advisor Class | 58.020 | -5,03 | 3.665 | 6,26 | ||||
| 2025-08-14 | 13F | Comerica Bank | 2.687 | 21,31 | 170 | 35,20 | ||||
| 2025-07-11 | 13F | Farther Finance Advisors, LLC | 0 | -100,00 | 0 | |||||
| 2025-08-14 | 13F | Citadel Advisors Llc | 15.651 | -58,63 | 989 | -53,72 | ||||
| 2025-08-01 | 13F | Howard Capital Management Inc. | 84.940 | 84,01 | 5.380 | 106,53 | ||||
| 2025-07-22 | 13F | Wealthcare Advisory Partners LLC | 137.468 | 4,44 | 8.682 | 16,88 | ||||
| 2025-08-12 | 13F | J.w. Cole Advisors, Inc. | 4.621 | -7,93 | 292 | 2,83 | ||||
| 2025-07-31 | 13F | Cambridge Investment Research Advisors, Inc. | 182.427 | -0,95 | 12 | 10,00 | ||||
| 2025-08-14 | 13F | Old Mission Capital Llc | 4.527 | 286 |
Other Listings
| MX:FLQL |