Statistiche di base
| Proprietari istituzionali | 119 total, 119 long only, 0 short only, 0 long/short - change of -3,23% MRQ |
| Allocazione media del portafoglio | 0.1128 % - change of 6,86% MRQ |
| Azioni istituzionali (Long) | 5.332.634 (ex 13D/G) - change of 0,21MM shares 4,12% MRQ |
| Valore istituzionale (Long) | $ 339.801 USD ($1000) |
Proprietà istituzionale e azionisti
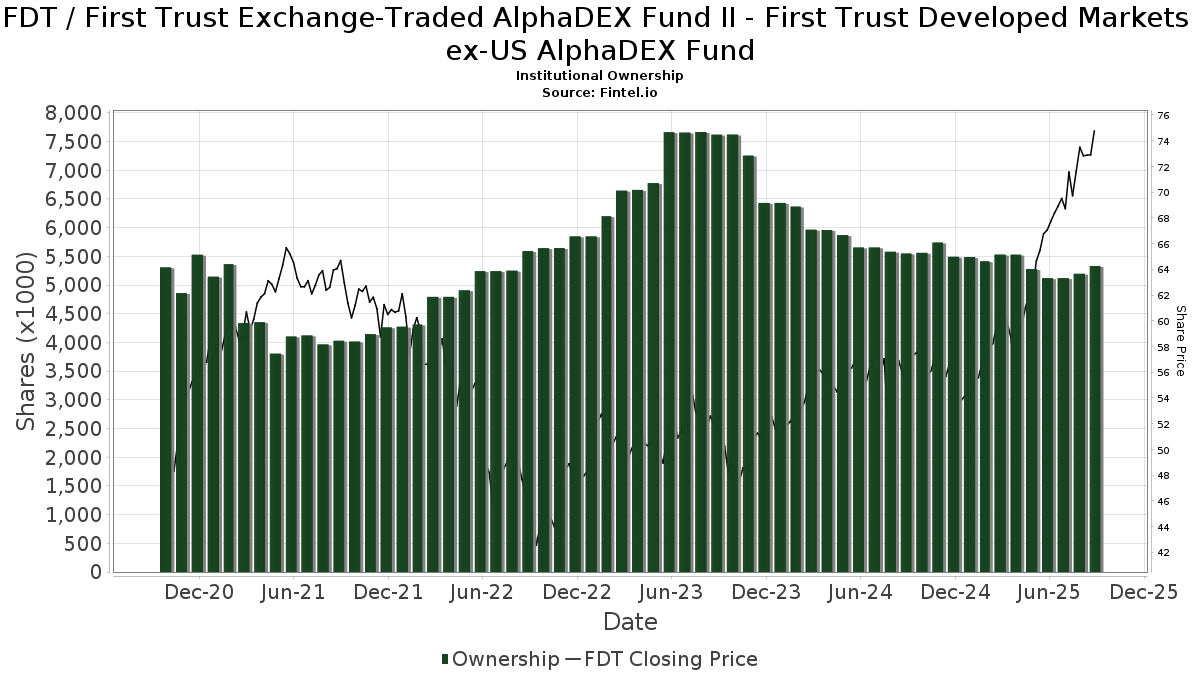
First Trust Exchange-Traded AlphaDEX Fund II - First Trust Developed Markets ex-US AlphaDEX Fund (US:FDT) ha 119 proprietari istituzionali e azionisti che hanno presentato i moduli 13D/G o 13F alla Securities Exchange Commission (SEC). Queste istituzioni detengono un totale di 5,332,634 azioni. I maggiori azionisti includono Morgan Stanley, LPL Financial LLC, Envestnet Asset Management Inc, Wells Fargo & Company/mn, UBS Group AG, Raymond James Financial Inc, Cambridge Investment Research Advisors, Inc., Royal Bank Of Canada, Cetera Investment Advisers, and Kingsview Wealth Management, LLC .
(First Trust Exchange-Traded AlphaDEX Fund II - First Trust Developed Markets ex-US AlphaDEX Fund (NasdaqGM:FDT) la struttura proprietaria istituzionale mostra le attuali posizioni nella società da parte di istituzioni e fondi, nonché le ultime variazioni nella dimensione della posizione. I principali azionisti possono essere singoli investitori, fondi comuni, hedge fund o istituzioni. L'allegato 13D indica che l'investitore detiene (o ha detenuto) più del 5% della società e intende (o intendeva) perseguire attivamente un cambiamento nella strategia aziendale. L'allegato 13G indica un investimento passivo superiore al 5%.
The share price as of September 5, 2025 is 73,57 / share. Previously, on September 9, 2024, the share price was 55,53 / share. This represents an increase of 32,49% over that period.
Indice del sentiment dei fondi
L'indice del sentiment dei fondi (anche noto come "indice di accumulo di proprietà") individua i titoli più acquistati dai fondi. È il risultato di un sofisticato modello quantitativo multi-fattore che identifica le società con i più alti livelli di accumulo istituzionale. Il modello utilizza una combinazione dell'aumento totale dei proprietari dichiarati, delle variazioni nelle allocazioni di portafoglio di tali proprietari e di altre metriche. Il punteggio varia da 0 a 100: i numeri più alti indicano un livello di accumulo superiore ad altre società, mentre 50 rappresenta la media.
Frequenza di aggiornamento: giornaliera
Consulta Ownership Explorer per visualizzare l'elenco delle aziende con il ranking più alto.
Rapporto put/call istituzionale
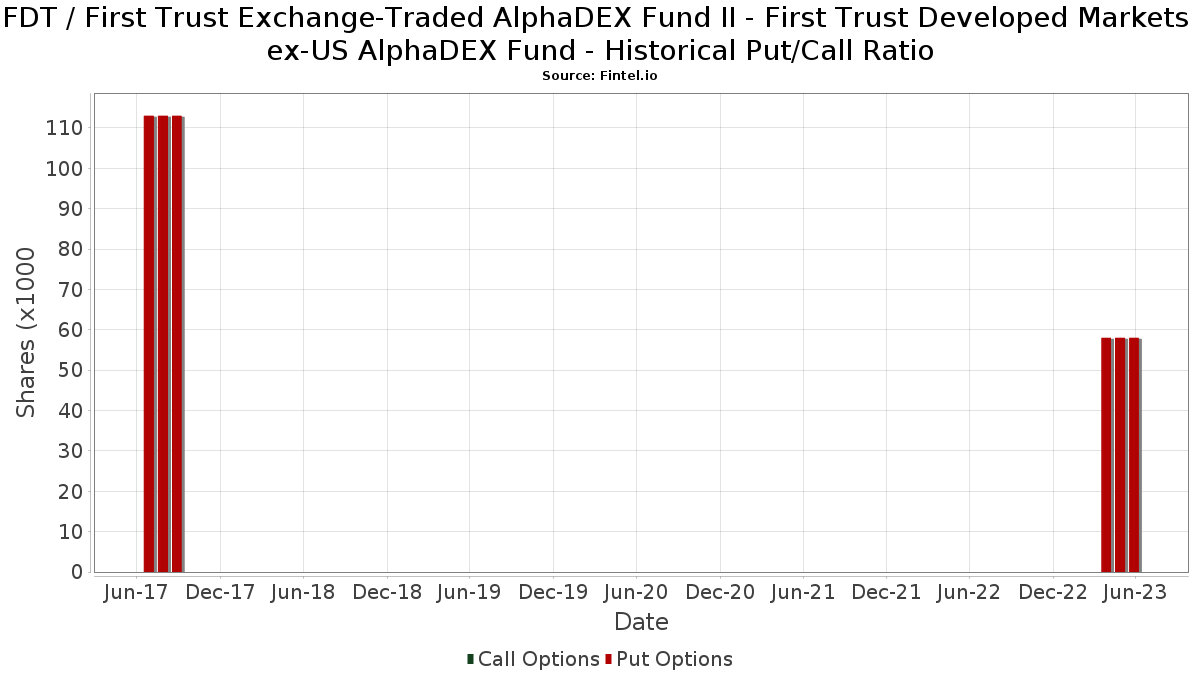
Oltre a segnalare le emissioni standard di titoli azionari e di debito, gli istituti con più di 100 milioni di asset in gestione devono anche dichiarare le loro partecipazioni in opzioni put e call. Poiché le opzioni put indicano generalmente un sentiment negativo e le opzioni call un sentiment positivo, possiamo avere un'idea del sentiment istituzionale complessivo attraverso il rapporto tra put e call. Il grafico a destra mostra il rapporto storico put/call per questo strumento.
L'utilizzo del rapporto put/call come indicatore del sentiment degli investitori consente di superare una delle principali lacune dell'utilizzo della proprietà istituzionale totale, ovvero il fatto che una quantità significativa di asset in gestione viene investita passivamente per seguire gli indici. Generalmente, i fondi a gestione passiva non acquistano opzioni, per cui il rapporto put/call riflette più fedelmente il sentiment dei fondi a gestione attiva.
Depositi 13F e NPORT
Le informazioni relative ai depositi 13F sono gratuite. Per accedere alle informazioni relative ai depositi NP è necessario un'abbonamento premium. Le righe verdi indicano le nuove posizioni. Le righe rosse indicano le posizioni chiuse. Fai clic sull'icona del link per visualizzare la cronologia completa delle transazioni.
Esegui l'upgrade
per sbloccare i dati premium ed esportarli in Excel ![]() .
.
| Data di deposito | Fonte | Investitore | Tipo | Prezzo medio (Stima) |
Azioni | Δ Azioni (%) |
Valore dichiarato ($ 1000) |
Δ Valore (%) |
Allocazione del portafoglio (%) |
|
|---|---|---|---|---|---|---|---|---|---|---|
| 2025-05-08 | 13F | Great Valley Advisor Group, Inc. | 0 | -100,00 | 0 | -100,00 | ||||
| 2025-07-21 | 13F | Hilltop National Bank | 1.450 | 0,00 | 100 | 26,92 | ||||
| 2025-05-01 | 13F | Quest 10 Wealth Builders, Inc. | 315 | -5,12 | 18 | 5,88 | ||||
| 2025-08-27 | 13F/A | Brinker Capital Investments, LLC | 25.878 | -10,34 | 1.779 | 5,83 | ||||
| 2025-07-08 | 13F | Nbc Securities, Inc. | 5.991 | -42,10 | 0 | |||||
| 2025-08-08 | 13F | Avantax Advisory Services, Inc. | 41.604 | -9,33 | 2.861 | 7,04 | ||||
| 2025-08-12 | 13F | PSI Advisors, LLC | 0 | -100,00 | 0 | |||||
| 2025-07-09 | 13F | Towerpoint Wealth, LLC | 29.051 | 3,55 | 1.998 | 22,22 | ||||
| 2025-08-05 | 13F | Plante Moran Financial Advisors, LLC | 752 | 0,00 | 52 | 18,60 | ||||
| 2025-04-10 | 13F | TrueWealth Advisors, LLC | 0 | -100,00 | 0 | |||||
| 2025-08-06 | 13F | Golden State Wealth Management, LLC | 2.623 | -24,26 | 180 | -10,45 | ||||
| 2025-08-11 | 13F | Tidemark, LLC | 0 | -100,00 | 0 | |||||
| 2025-08-08 | 13F | L & S Advisors Inc | 32.282 | 15,10 | 2.220 | 35,88 | ||||
| 2025-05-02 | 13F | Capital A Wealth Management, LLC | 0 | -100,00 | 0 | |||||
| 2025-08-14 | 13F | Bank Of America Corp /de/ | 84 | -99,85 | 6 | -99,85 | ||||
| 2025-04-11 | 13F | Davis Capital Management | 93 | 0,00 | 5 | 0,00 | ||||
| 2025-08-29 | 13F | Centaurus Financial, Inc. | 1.738 | 0,00 | 0 | |||||
| 2025-08-11 | 13F | Principal Securities, Inc. | 5.734 | 10,02 | 394 | 40,21 | ||||
| 2025-08-11 | 13F | Citigroup Inc | 246 | 0,00 | 17 | 14,29 | ||||
| 2025-07-29 | 13F | Private Trust Co Na | 0 | -100,00 | 0 | |||||
| 2025-08-14 | 13F | GWM Advisors LLC | 7.339 | 73,58 | 505 | 104,88 | ||||
| 2025-07-24 | 13F | Trust Co Of Toledo Na /oh/ | 210 | 14 | ||||||
| 2025-08-06 | 13F | Commonwealth Equity Services, Llc | 24.537 | 1,60 | 2 | 0,00 | ||||
| 2025-08-12 | 13F | LPL Financial LLC | 628.377 | 18,72 | 43.207 | 40,14 | ||||
| 2025-08-08 | 13F | Kingsview Wealth Management, LLC | 153.279 | -4,39 | 10.539 | 12,86 | ||||
| 2025-08-14 | 13F | Snowden Capital Advisors LLC | 32.135 | 0,02 | 2.210 | 18,07 | ||||
| 2025-08-08 | 13F | Pnc Financial Services Group, Inc. | 0 | -100,00 | 0 | |||||
| 2025-07-14 | 13F | ABLE Financial Group, LLC | 7.253 | -1,57 | 499 | 16,08 | ||||
| 2025-08-04 | 13F | Assetmark, Inc | 149.046 | 13,07 | 10.248 | 33,47 | ||||
| 2025-07-17 | 13F | Janney Montgomery Scott LLC | 31.694 | -3,41 | 2 | 100,00 | ||||
| 2025-08-14 | 13F | Raymond James Financial Inc | 215.203 | -21,19 | 14.797 | -6,97 | ||||
| 2025-05-15 | 13F | Baird Financial Group, Inc. | 0 | -100,00 | 0 | |||||
| 2025-07-24 | 13F | Ronald Blue Trust, Inc. | 17 | 0,00 | 1 | |||||
| 2025-08-15 | 13F | Fsb Premier Wealth Management, Inc. | 25.429 | -17,43 | 1.748 | -2,51 | ||||
| 2025-07-18 | 13F | Truist Financial Corp | 34.311 | -5,40 | 2.359 | 11,70 | ||||
| 2025-08-14 | 13F | Comerica Bank | 21.558 | 42,24 | 1.482 | 68,03 | ||||
| 2025-07-24 | 13F | IFP Advisors, Inc | 41.417 | -2,58 | 2.848 | 14,98 | ||||
| 2025-05-15 | 13F | Integrated Wealth Concepts LLC | 0 | -100,00 | 0 | |||||
| 2025-07-16 | 13F | Formidable Asset Management, LLC | 3.745 | 0,00 | 218 | 0,00 | ||||
| 2025-05-14 | 13F | Caitlin John, LLC | 0 | -100,00 | 0 | |||||
| 2025-07-14 | 13F | GAMMA Investing LLC | 1.731 | -2,92 | 119 | 15,53 | ||||
| 2025-07-21 | 13F | Ameritas Advisory Services, LLC | 261 | 18 | ||||||
| 2025-08-13 | 13F | StoneX Group Inc. | 4.439 | -10,59 | 305 | 5,54 | ||||
| 2025-07-11 | 13F | Pinnacle Bancorp, Inc. | 400 | 0,00 | 28 | 17,39 | ||||
| 2025-07-28 | 13F | BRYN MAWR TRUST Co | 600 | 0,00 | 41 | 20,59 | ||||
| 2025-07-30 | 13F | BlueChip Wealth Advisors LLC | 5.763 | 0,00 | 396 | 18,21 | ||||
| 2025-07-02 | 13F | HBW Advisory Services LLC | 6.658 | -2,45 | 458 | 15,11 | ||||
| 2025-07-11 | 13F | Farther Finance Advisors, LLC | 27.385 | 2.548,45 | 1.883 | 3.038,33 | ||||
| 2025-08-01 | 13F | Rossby Financial, LCC | 1.409 | -0,49 | 97 | 12,94 | ||||
| 2025-08-06 | 13F | Prospera Financial Services Inc | 46.084 | -1,37 | 3.169 | 16,43 | ||||
| 2025-08-01 | 13F | Envestnet Asset Management Inc | 424.243 | -2,08 | 29.171 | 15,58 | ||||
| 2025-08-08 | 13F | 1776 Wealth LLC | 3.148 | 216 | ||||||
| 2025-08-13 | 13F | Jones Financial Companies Lllp | 3.754 | 106,49 | 256 | 141,51 | ||||
| 2025-07-25 | 13F | Atria Wealth Solutions, Inc. | 6.139 | -77,08 | 422 | -72,93 | ||||
| 2025-08-05 | 13F | Bank of New York Mellon Corp | 45.410 | -6,87 | 3.122 | 9,93 | ||||
| 2025-08-04 | 13F | IFG Advisory, LLC | 5.161 | 2,08 | 355 | 20,41 | ||||
| 2025-08-13 | 13F | Transce3nd, LLC | 144 | -11,11 | 10 | 0,00 | ||||
| 2025-08-08 | 13F | Glassman Wealth Services | 0 | -100,00 | 0 | |||||
| 2025-08-19 | 13F | National Asset Management, Inc. | 0 | -100,00 | 0 | |||||
| 2025-05-15 | 13F/A | Orion Portfolio Solutions, LLC | 28.863 | -1,73 | 1.681 | 5,86 | ||||
| 2025-08-18 | 13F | Geneos Wealth Management Inc. | 99 | -6,60 | 7 | 0,00 | ||||
| 2025-08-11 | 13F | NewEdge Wealth, LLC | 23.027 | -7,68 | 1.661 | 14,39 | ||||
| 2025-08-13 | 13F | Colonial Trust Advisors | 200 | 0,00 | 14 | 18,18 | ||||
| 2025-07-28 | 13F | Harbour Investments, Inc. | 8.857 | 6,69 | 609 | 26,09 | ||||
| 2025-08-07 | 13F | Allworth Financial LP | 170 | 12 | ||||||
| 2025-09-04 | 13F/A | Advisor Group Holdings, Inc. | 66.835 | 23,52 | 4.533 | 43,81 | ||||
| 2025-07-15 | 13F | Fifth Third Bancorp | 0 | -100,00 | 0 | |||||
| 2025-08-14 | 13F | Two Sigma Securities, Llc | 0 | -100,00 | 0 | |||||
| 2025-08-14 | 13F | Fmr Llc | 281 | -5,07 | 19 | 11,76 | ||||
| 2025-08-13 | 13F | First Trust Advisors Lp | 12.345 | -3,26 | 849 | 14,13 | ||||
| 2025-08-08 | 13F | Larson Financial Group LLC | 2.256 | -7,84 | 155 | 9,15 | ||||
| 2025-08-11 | 13F | SFI Advisors, LLC | 16.560 | -0,46 | 1.139 | 17,44 | ||||
| 2025-08-08 | 13F | Gts Securities Llc | 0 | -100,00 | 0 | |||||
| 2025-07-15 | 13F | LVZ Advisors, Inc. | 33.250 | -0,95 | 2.286 | 16,93 | ||||
| 2025-07-29 | 13F | Stratos Wealth Partners, LTD. | 10.158 | -2,28 | 698 | 15,37 | ||||
| 2025-08-14 | 13F | Mpwm Advisory Solutions, Llc | 7.095 | 488 | ||||||
| 2025-08-12 | 13F | MAI Capital Management | 220 | 0,00 | 15 | 25,00 | ||||
| 2025-08-26 | NP | FIRST TRUST VARIABLE INSURANCE TRUST - First Trust Dorsey Wright Tactical Core Portfolio Class I This fund is a listed as child fund of First Trust Advisors Lp and if that institution has disclosed ownership in this security, then these positions will not be double counted when calculating total shares and total value | 11.171 | -2,05 | 768 | 15,66 | ||||
| 2025-08-12 | 13F | Global Retirement Partners, LLC | 7.099 | -3,59 | 488 | 22,61 | ||||
| 2025-08-04 | 13F | Atria Investments Llc | 50.108 | -4,67 | 3.445 | 12,54 | ||||
| 2025-08-12 | 13F | Jpmorgan Chase & Co | 588 | 352,31 | 40 | 471,43 | ||||
| 2025-08-13 | 13F | Flow Traders U.s. Llc | 0 | -100,00 | 0 | |||||
| 2025-08-14 | 13F | CoreCap Advisors, LLC | 388 | 0,00 | 27 | 18,18 | ||||
| 2025-07-14 | 13F | Park Avenue Securities Llc | 24.316 | 2 | ||||||
| 2025-07-01 | 13F | Private Client Services, Llc | 4.370 | -1,47 | 300 | 16,28 | ||||
| 2025-08-19 | 13F | Newbridge Financial Services Group, Inc. | 275 | 19 | ||||||
| 2025-08-14 | 13F | Pinnacle Family Advisors, LLC | 8.043 | -2,60 | 553 | 14,97 | ||||
| 2025-05-28 | NP | TFAFX - Tactical Growth Allocation Fund Class I | 483 | 28 | ||||||
| 2025-08-12 | 13F | Steward Partners Investment Advisory, Llc | 138 | 0,00 | 9 | 12,50 | ||||
| 2025-08-05 | 13F | Sigma Planning Corp | 6.096 | 6,82 | 419 | 26,20 | ||||
| 2025-08-13 | 13F | GeoWealth Management, LLC | 2.708 | -0,77 | 186 | 17,72 | ||||
| 2025-08-06 | 13F | AE Wealth Management LLC | 44.616 | -23,06 | 3.068 | -9,18 | ||||
| 2025-07-23 | 13F | Element Wealth, LLC | 4.142 | -0,12 | 285 | 17,84 | ||||
| 2025-08-14 | 13F | Benjamin Edwards Inc | 106.772 | 197,89 | 7.342 | 251,75 | ||||
| 2025-08-14 | 13F | UBS Group AG | 218.467 | -0,51 | 15.022 | 17,44 | ||||
| 2025-07-15 | 13F | Traction Financial Partners, LLC | 7.456 | 513 | ||||||
| 2025-08-11 | 13F | Private Advisor Group, LLC | 13.781 | -22,94 | 948 | -9,03 | ||||
| 2025-07-23 | 13F | REAP Financial Group, LLC | 730 | 1,25 | 50 | 21,95 | ||||
| 2025-08-14 | 13F | Wells Fargo & Company/mn | 283.258 | 38,09 | 19.477 | 63,01 | ||||
| 2025-08-04 | 13F | Spire Wealth Management | 19 | 0,00 | 1 | 0,00 | ||||
| 2025-08-01 | 13F | Brookwood Investment Group LLC | 0 | -100,00 | 0 | |||||
| 2025-08-12 | 13F | Proequities, Inc. | 0 | 0 | ||||||
| 2025-08-14 | 13F | Susquehanna International Group, Llp | 64.000 | 4.401 | ||||||
| 2025-07-16 | 13F | American National Bank | 78 | 0,00 | 5 | 25,00 | ||||
| 2025-07-15 | 13F | FLP Wealth Management, LLC | 0 | -100,00 | 0 | |||||
| 2025-07-24 | 13F | Cyndeo Wealth Partners, LLC | 10.153 | 0,00 | 698 | 18,10 | ||||
| 2025-08-15 | 13F | Morgan Stanley | 1.027.689 | -1,75 | 70.664 | 15,98 | ||||
| 2025-07-14 | 13F | Signature Securities Group Corporation | 11.122 | -3,20 | 765 | 14,20 | ||||
| 2025-07-24 | 13F | Us Bancorp \de\ | 6.928 | 476 | ||||||
| 2025-07-25 | 13F | Cwm, Llc | 40.521 | 111,47 | 3 | 100,00 | ||||
| 2025-08-13 | 13F | Northwestern Mutual Wealth Management Co | 938 | 64 | ||||||
| 2025-08-15 | 13F | Kestra Advisory Services, LLC | 13.788 | 1,64 | 948 | 20,00 | ||||
| 2025-08-05 | 13F | EPG Wealth Management LLC | 0 | -100,00 | 0 | |||||
| 2025-08-12 | 13F | CIBC Private Wealth Group, LLC | 51 | 4 | ||||||
| 2025-08-12 | 13F | OneAscent Financial Services LLC | 27.278 | -0,95 | 2 | 0,00 | ||||
| 2025-08-14 | 13F | Mml Investors Services, Llc | 16.617 | 1,19 | 1 | |||||
| 2025-07-25 | 13F | Envestnet Portfolio Solutions, Inc. | 11.140 | -65,75 | 766 | -59,61 | ||||
| 2025-07-30 | 13F | D.a. Davidson & Co. | 17.863 | -0,33 | 1.228 | 17,74 | ||||
| 2025-07-23 | 13F | TPG Financial Advisors, LLC | 58.659 | 0,66 | 4.033 | 18,83 | ||||
| 2025-07-31 | 13F | Cambridge Investment Research Advisors, Inc. | 204.862 | 81,66 | 14 | 133,33 | ||||
| 2025-07-11 | 13F | SILVER OAK SECURITIES, Inc | 15.661 | 1,27 | 1.077 | 18,63 | ||||
| 2025-05-16 | 13F/A | Kestra Investment Management, LLC | 0 | -100,00 | 0 | |||||
| 2025-08-04 | 13F | Arkadios Wealth Advisors | 8.486 | -12,29 | 584 | 3,55 | ||||
| 2025-07-25 | 13F | Apollon Wealth Management, LLC | 5.523 | -1,46 | 380 | 16,26 | ||||
| 2025-08-15 | 13F | Captrust Financial Advisors | 9.072 | -21,08 | 624 | -6,88 | ||||
| 2025-08-07 | 13F | PFG Advisors | 9.779 | -39,04 | 672 | -28,05 | ||||
| 2025-08-14 | 13F | Royal Bank Of Canada | 192.379 | -3,65 | 13.227 | 13,72 | ||||
| 2025-07-29 | 13F | Chicago Partners Investment Group LLC | 3.502 | -4,55 | 251 | 10,13 | ||||
| 2025-07-28 | 13F | RFG Advisory, LLC | 6.443 | -0,46 | 443 | 17,51 | ||||
| 2025-08-08 | 13F | Cetera Investment Advisers | 172.136 | -3,34 | 11.836 | 14,10 | ||||
| 2025-08-20 | 13F/A | Coppell Advisory Solutions LLC | 41.054 | -18,41 | 2.803 | -8,96 | ||||
| 2025-08-05 | 13F | Huntington National Bank | 40 | 18,18 | ||||||
| 2025-07-14 | 13F | Iams Wealth Management, Llc | 20.606 | -9,12 | 1.417 | 7,27 | ||||
| 2025-07-21 | 13F | Synergy Financial Management, LLC | 0 | -100,00 | 0 | |||||
| 2025-08-08 | 13F | Creative Planning | 2.969 | 204 | ||||||
| 2025-08-14 | 13F | Jane Street Group, Llc | 0 | -100,00 | 0 | |||||
| 2025-08-14 | 13F | LaSalle St. Investment Advisors, LLC | 7.376 | 2,03 | 1 | |||||
| 2025-08-08 | 13F | Petix & Botte Co | 3.972 | 0,00 | 273 | 18,18 | ||||
| 2025-05-15 | 13F | Mariner, LLC | 0 | -100,00 | 0 | |||||
| 2025-08-12 | 13F | SRS Capital Advisors, Inc. | 240 | 0,00 | 17 | 23,08 | ||||
| 2025-08-13 | 13F | Gateway Wealth Partners, LLC | 29.251 | -15,25 | 2.011 | 0,05 | ||||
| 2025-08-04 | 13F | Waterfront Wealth Inc. | 10.640 | -4,06 | 732 | 13,33 | ||||
| 2025-07-17 | 13F | Mainsail Financial Group, LLC | 80.716 | 0,73 | 5.524 | 18,36 | ||||
| 2025-08-11 | 13F | Synergy Investment Management, LLC | 0 | -100,00 | 0 | |||||
| 2025-08-14 | 13F | Stifel Financial Corp | 100.953 | 181,50 | 6.941 | 232,42 |
Other Listings
| MX:FDT |