Statistiche di base
| Proprietari istituzionali | 58 total, 58 long only, 0 short only, 0 long/short - change of 13,73% MRQ |
| Allocazione media del portafoglio | 0.0124 % - change of -29,49% MRQ |
| Azioni istituzionali (Long) | 443.377 (ex 13D/G) - change of -0,04MM shares -9,14% MRQ |
| Valore istituzionale (Long) | $ 13.502 USD ($1000) |
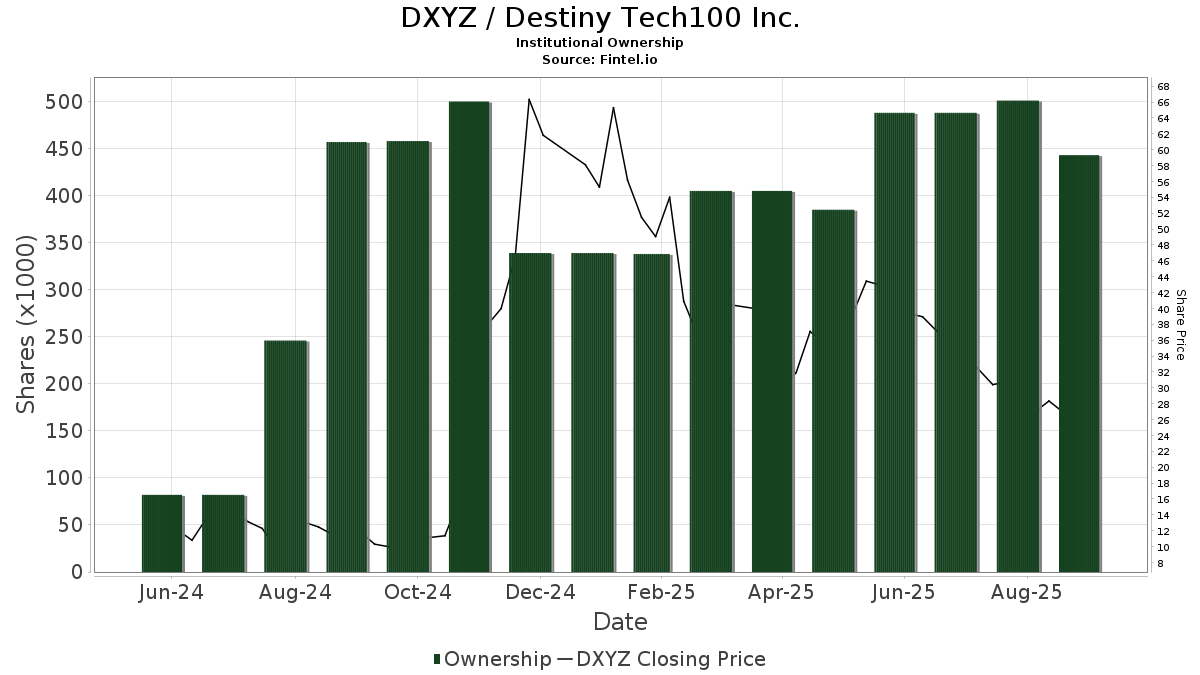
Proprietà istituzionale e azionisti
Destiny Tech100 Inc. (US:DXYZ) ha 58 proprietari istituzionali e azionisti che hanno presentato i moduli 13D/G o 13F alla Securities Exchange Commission (SEC). Queste istituzioni detengono un totale di 443,377 azioni. I maggiori azionisti includono Commonwealth Equity Services, Llc, Morgan Stanley, LPL Financial LLC, Kestra Advisory Services, LLC, UBS Group AG, PSP - Invesco Global Listed Private Equity ETF, Stifel Financial Corp, Invesco Ltd., Strategy Asset Managers Llc, and Mariner, LLC .
(Destiny Tech100 Inc. (NYSE:DXYZ) la struttura proprietaria istituzionale mostra le attuali posizioni nella società da parte di istituzioni e fondi, nonché le ultime variazioni nella dimensione della posizione. I principali azionisti possono essere singoli investitori, fondi comuni, hedge fund o istituzioni. L'allegato 13D indica che l'investitore detiene (o ha detenuto) più del 5% della società e intende (o intendeva) perseguire attivamente un cambiamento nella strategia aziendale. L'allegato 13G indica un investimento passivo superiore al 5%.
The share price as of September 5, 2025 is 25,82 / share. Previously, on September 6, 2024, the share price was 10,26 / share. This represents an increase of 151,66% over that period.
Indice del sentiment dei fondi
L'indice del sentiment dei fondi (anche noto come "indice di accumulo di proprietà") individua i titoli più acquistati dai fondi. È il risultato di un sofisticato modello quantitativo multi-fattore che identifica le società con i più alti livelli di accumulo istituzionale. Il modello utilizza una combinazione dell'aumento totale dei proprietari dichiarati, delle variazioni nelle allocazioni di portafoglio di tali proprietari e di altre metriche. Il punteggio varia da 0 a 100: i numeri più alti indicano un livello di accumulo superiore ad altre società, mentre 50 rappresenta la media.
Frequenza di aggiornamento: giornaliera
Consulta Ownership Explorer per visualizzare l'elenco delle aziende con il ranking più alto.
Rapporto put/call istituzionale
Oltre a segnalare le emissioni standard di titoli azionari e di debito, gli istituti con più di 100 milioni di asset in gestione devono anche dichiarare le loro partecipazioni in opzioni put e call. Poiché le opzioni put indicano generalmente un sentiment negativo e le opzioni call un sentiment positivo, possiamo avere un'idea del sentiment istituzionale complessivo attraverso il rapporto tra put e call. Il grafico a destra mostra il rapporto storico put/call per questo strumento.
L'utilizzo del rapporto put/call come indicatore del sentiment degli investitori consente di superare una delle principali lacune dell'utilizzo della proprietà istituzionale totale, ovvero il fatto che una quantità significativa di asset in gestione viene investita passivamente per seguire gli indici. Generalmente, i fondi a gestione passiva non acquistano opzioni, per cui il rapporto put/call riflette più fedelmente il sentiment dei fondi a gestione attiva.
Depositi 13F e NPORT
Le informazioni relative ai depositi 13F sono gratuite. Per accedere alle informazioni relative ai depositi NP è necessario un'abbonamento premium. Le righe verdi indicano le nuove posizioni. Le righe rosse indicano le posizioni chiuse. Fai clic sull'icona del link per visualizzare la cronologia completa delle transazioni.
Esegui l'upgrade
per sbloccare i dati premium ed esportarli in Excel ![]() .
.
| Data di deposito | Fonte | Investitore | Tipo | Prezzo medio (Stima) |
Azioni | Δ Azioni (%) |
Valore dichiarato ($ 1000) |
Δ Valore (%) |
Allocazione del portafoglio (%) |
|
|---|---|---|---|---|---|---|---|---|---|---|
| 2025-08-12 | 13F | Jpmorgan Chase & Co | 299 | 11 | ||||||
| 2025-07-07 | 13F | Nova Wealth Management, Inc. | 15 | 1 | ||||||
| 2025-07-28 | 13F | Harbour Investments, Inc. | 6.542 | 312,48 | 249 | 344,64 | ||||
| 2025-08-08 | 13F | Pnc Financial Services Group, Inc. | 92 | 0,00 | 4 | 0,00 | ||||
| 2025-08-14 | 13F/A | Barclays Plc | 683 | -34,83 | 0 | |||||
| 2025-05-12 | 13F | Sandy Spring Bank | 0 | -100,00 | 0 | |||||
| 2025-07-31 | 13F | Cambridge Investment Research Advisors, Inc. | 7.768 | 0 | ||||||
| 2025-08-07 | 13F | HighPoint Advisor Group LLC | 5.409 | 206 | ||||||
| 2025-08-08 | 13F | Avantax Advisory Services, Inc. | 0 | -100,00 | 0 | |||||
| 2025-08-11 | 13F | Private Advisor Group, LLC | 10.820 | -7,68 | 412 | -0,48 | ||||
| 2025-08-06 | 13F | Walkner Condon Financial Advisors LLC | 6.200 | 0,00 | 236 | 7,76 | ||||
| 2025-08-12 | 13F | Steward Partners Investment Advisory, Llc | 100 | 0,00 | 4 | 0,00 | ||||
| 2025-07-15 | 13F | Fifth Third Bancorp | 0 | -100,00 | 0 | |||||
| 2025-07-08 | 13F | Parallel Advisors, LLC | 10 | 0 | ||||||
| 2025-08-12 | 13F | Virtu Financial LLC | 0 | -100,00 | 0 | |||||
| 2025-07-14 | 13F | Toth Financial Advisory Corp | 40 | 2 | ||||||
| 2025-07-25 | 13F | Griffin Asset Management, Inc. | 6.780 | 0,00 | 258 | 7,95 | ||||
| 2025-08-18 | 13F/A | National Bank Of Canada /fi/ | 7 | 0,00 | 0 | |||||
| 2025-08-14 | 13F | Ancora Advisors, LLC | 150 | 6 | ||||||
| 2025-04-21 | 13F | PSI Advisors, LLC | 0 | -100,00 | 0 | |||||
| 2025-05-15 | 13F | Gordian Capital Singapore Pte Ltd | 0 | -100,00 | 0 | -100,00 | ||||
| 2025-08-14 | 13F | Jane Street Group, Llc | 15.868 | -40,58 | 604 | -36,08 | ||||
| 2025-08-07 | 13F | Montag A & Associates Inc | 0 | -100,00 | 0 | |||||
| 2025-09-04 | 13F/A | Advisor Group Holdings, Inc. | 6.230 | 5,38 | 237 | 13,40 | ||||
| 2025-05-13 | 13F | Intrepid Financial Planning Group LLC | 0 | -100,00 | 0 | |||||
| 2025-07-25 | 13F | Hazlett, Burt & Watson, Inc. | 3.900 | 44,44 | 0 | |||||
| 2025-08-15 | 13F | Morgan Stanley | 44.708 | -59,93 | 1.703 | -56,89 | ||||
| 2025-07-16 | 13F | Signaturefd, Llc | 510 | 0,00 | 19 | 5,56 | ||||
| 2025-05-14 | 13F | Credit Agricole S A | 2.600 | 92 | ||||||
| 2025-04-16 | 13F | Quintet Private Bank (Europe) S.A. | 0 | -100,00 | 0 | |||||
| 2025-07-24 | 13F | IFP Advisors, Inc | 0 | -100,00 | 0 | -100,00 | ||||
| 2025-05-13 | 13F | Adams Wealth Management | 0 | -100,00 | 0 | |||||
| 2025-08-06 | 13F | Commonwealth Equity Services, Llc | 58.497 | 8,52 | 2 | 100,00 | ||||
| 2025-07-18 | 13F | Bartlett & Co. Wealth Management Llc | 2.400 | 0,00 | 91 | 8,33 | ||||
| 2025-08-14 | 13F | Federation des caisses Desjardins du Quebec | 95 | -58,70 | 4 | -62,50 | ||||
| 2025-08-08 | 13F | Creative Planning | 7.405 | -11,91 | 282 | -5,05 | ||||
| 2025-08-14 | 13F | Stifel Financial Corp | 18.651 | 23,39 | 710 | 32,96 | ||||
| 2025-08-08 | 13F | Cetera Investment Advisers | 5.595 | -73,31 | 213 | -71,26 | ||||
| 2025-05-07 | 13F | Corton Capital Inc. | 0 | -100,00 | 0 | |||||
| 2025-04-16 | 13F | Twin Peaks Wealth Advisors, LLC | 0 | -100,00 | 0 | |||||
| 2025-07-25 | 13F | Cwm, Llc | 2.510 | 0,00 | 0 | |||||
| 2025-05-06 | 13F | Kovack Advisors, Inc. | 0 | -100,00 | 0 | |||||
| 2025-08-14 | 13F | Hrt Financial Lp | 0 | -100,00 | 0 | |||||
| 2025-08-19 | 13F | Anchor Investment Management, LLC | 640 | 0,00 | 24 | 9,09 | ||||
| 2025-08-11 | 13F | One Capital Management, LLC | 8.447 | 0,17 | 322 | 7,72 | ||||
| 2025-08-14 | 13F | Visionary Wealth Advisors | 6.267 | 239 | ||||||
| 2025-08-27 | NP | TIFF INVESTMENT PROGRAM - TIFF Multi-Asset Fund | 0 | -100,00 | 0 | -100,00 | ||||
| 2025-08-08 | 13F | SG Americas Securities, LLC | 0 | -100,00 | 0 | |||||
| 2025-08-13 | 13F | Cresset Asset Management, LLC | 5.803 | 221 | ||||||
| 2025-06-30 | NP | PSP - Invesco Global Listed Private Equity ETF This fund is a listed as child fund of Invesco Ltd. and if that institution has disclosed ownership in this security, then these positions will not be double counted when calculating total shares and total value | 18.826 | 69,27 | 698 | 14,80 | ||||
| 2025-07-29 | 13F | Tradewinds Capital Management, LLC | 25 | 0,00 | 1 | |||||
| 2025-08-12 | 13F | Global Retirement Partners, LLC | 380 | 347,06 | 14 | 180,00 | ||||
| 2025-08-15 | 13F | Tower Research Capital LLC (TRC) | 200 | 227,87 | 8 | 250,00 | ||||
| 2025-07-28 | 13F | WealthPlan Investment Management, LLC | 8.210 | 0,22 | 313 | 7,96 | ||||
| 2025-08-07 | 13F | Strategy Asset Managers Llc | 18.000 | 0,00 | 686 | 7,54 | ||||
| 2025-08-15 | 13F | Kestra Advisory Services, LLC | 25.017 | 53,52 | 953 | 65,28 | ||||
| 2025-05-15 | 13F | Balyasny Asset Management Llc | 0 | -100,00 | 0 | |||||
| 2025-07-21 | 13F | Ameritas Advisory Services, LLC | 90 | 3 | ||||||
| 2025-08-12 | 13F | Financial Advocates Investment Management | 9.959 | 2,86 | 379 | 10,82 | ||||
| 2025-08-14 | 13F | Bank Of America Corp /de/ | 1.350 | 35,00 | 51 | 45,71 | ||||
| 2025-08-12 | 13F | Proequities, Inc. | 0 | 0 | ||||||
| 2025-08-12 | 13F | CIBC Private Wealth Group, LLC | 25 | 1 | ||||||
| 2025-08-13 | 13F | Aristides Capital LLC | 0 | -100,00 | 0 | |||||
| 2025-08-14 | 13F | Royal Bank Of Canada | 750 | 1.400,00 | 28 | 1.300,00 | ||||
| 2025-08-13 | 13F | Mount Yale Investment Advisors, LLC | 193 | 7 | ||||||
| 2025-04-29 | 13F | Envestnet Asset Management Inc | 0 | -100,00 | 0 | |||||
| 2025-05-15 | 13F | Symmetry Investments LP | 0 | -100,00 | 0 | |||||
| 2025-05-13 | 13F | CacheTech Inc. | 0 | -100,00 | 0 | -100,00 | ||||
| 2025-08-08 | 13F | Hartland & Co., LLC | 102 | 4 | ||||||
| 2025-08-14 | 13F | Mariner, LLC | 16.954 | 182,52 | 646 | 204,25 | ||||
| 2025-08-06 | 13F | Wedbush Securities Inc | 15.295 | -9,34 | 1 | |||||
| 2025-08-14 | 13F | GWM Advisors LLC | 1.134 | 10,74 | 43 | 19,44 | ||||
| 2025-08-14 | 13F | Wells Fargo & Company/mn | 0 | -100,00 | 0 | |||||
| 2025-08-14 | 13F | Wiley Bros.-aintree Capital, Llc | 5.578 | 233 | ||||||
| 2025-07-15 | 13F | Evanson Asset Management, LLC | 15.000 | 0,00 | 571 | 7,74 | ||||
| 2025-08-11 | 13F | Strategic Wealth Partners, Ltd. | 20 | 1 | ||||||
| 2025-08-11 | 13F | TD Waterhouse Canada Inc. | 250 | 9 | ||||||
| 2025-08-13 | 13F | Invesco Ltd. | 18.021 | -9,20 | 686 | -2,28 | ||||
| 2025-08-14 | 13F | Raymond James Financial Inc | 1.235 | 47 | ||||||
| 2025-07-16 | 13F | ORG Partners LLC | 0 | -100,00 | 0 | |||||
| 2025-08-14 | 13F | UBS Group AG | 20.398 | 94,17 | 777 | 109,16 | ||||
| 2025-08-12 | 13F | LPL Financial LLC | 42.779 | 125,34 | 1.629 | 142,77 | ||||
| 2025-05-06 | 13F | Venturi Wealth Management, LLC | 0 | -100,00 | 0 | |||||
| 2025-04-07 | 13F | AdvisorNet Financial, Inc | 0 | -100,00 | 0 | -100,00 | ||||
| 2025-08-14 | 13F | Susquehanna International Group, Llp | 7.371 | 281 |