Statistiche di base
| Proprietari istituzionali | 122 total, 122 long only, 0 short only, 0 long/short - change of 4,24% MRQ |
| Allocazione media del portafoglio | 0.1326 % - change of -0,74% MRQ |
| Azioni istituzionali (Long) | 5.291.495 (ex 13D/G) - change of -0,05MM shares -1,00% MRQ |
| Valore istituzionale (Long) | $ 326.493 USD ($1000) |
Proprietà istituzionale e azionisti
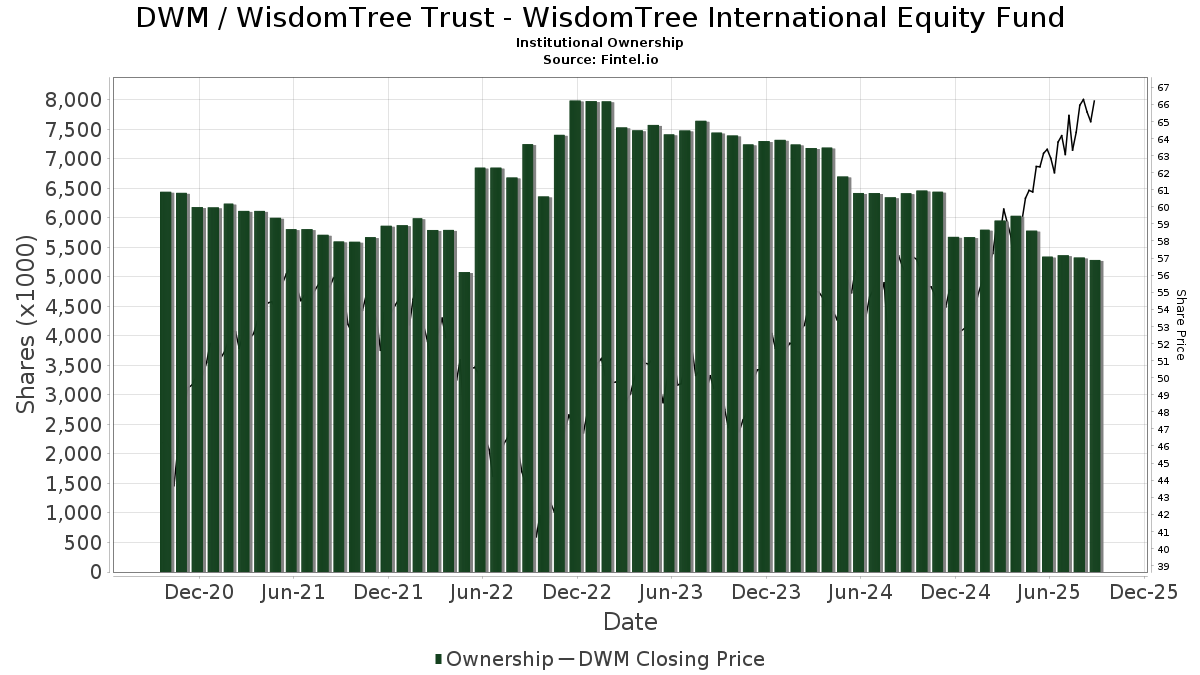
WisdomTree Trust - WisdomTree International Equity Fund (US:DWM) ha 122 proprietari istituzionali e azionisti che hanno presentato i moduli 13D/G o 13F alla Securities Exchange Commission (SEC). Queste istituzioni detengono un totale di 5,291,495 azioni. I maggiori azionisti includono Morgan Stanley, LPL Financial LLC, LRI Investments, LLC, Bank Of America Corp /de/, Wells Fargo & Company/mn, Wealth Enhancement Advisory Services, Llc, Valmark Advisers, Inc., UBS Group AG, Kestra Advisory Services, LLC, and Moller Financial Services .
(WisdomTree Trust - WisdomTree International Equity Fund (ARCA:DWM) la struttura proprietaria istituzionale mostra le attuali posizioni nella società da parte di istituzioni e fondi, nonché le ultime variazioni nella dimensione della posizione. I principali azionisti possono essere singoli investitori, fondi comuni, hedge fund o istituzioni. L'allegato 13D indica che l'investitore detiene (o ha detenuto) più del 5% della società e intende (o intendeva) perseguire attivamente un cambiamento nella strategia aziendale. L'allegato 13G indica un investimento passivo superiore al 5%.
The share price as of September 2, 2025 is 64,91 / share. Previously, on September 3, 2024, the share price was 56,60 / share. This represents an increase of 14,68% over that period.
Indice del sentiment dei fondi
L'indice del sentiment dei fondi (anche noto come "indice di accumulo di proprietà") individua i titoli più acquistati dai fondi. È il risultato di un sofisticato modello quantitativo multi-fattore che identifica le società con i più alti livelli di accumulo istituzionale. Il modello utilizza una combinazione dell'aumento totale dei proprietari dichiarati, delle variazioni nelle allocazioni di portafoglio di tali proprietari e di altre metriche. Il punteggio varia da 0 a 100: i numeri più alti indicano un livello di accumulo superiore ad altre società, mentre 50 rappresenta la media.
Frequenza di aggiornamento: giornaliera
Consulta Ownership Explorer per visualizzare l'elenco delle aziende con il ranking più alto.
Rapporto put/call istituzionale
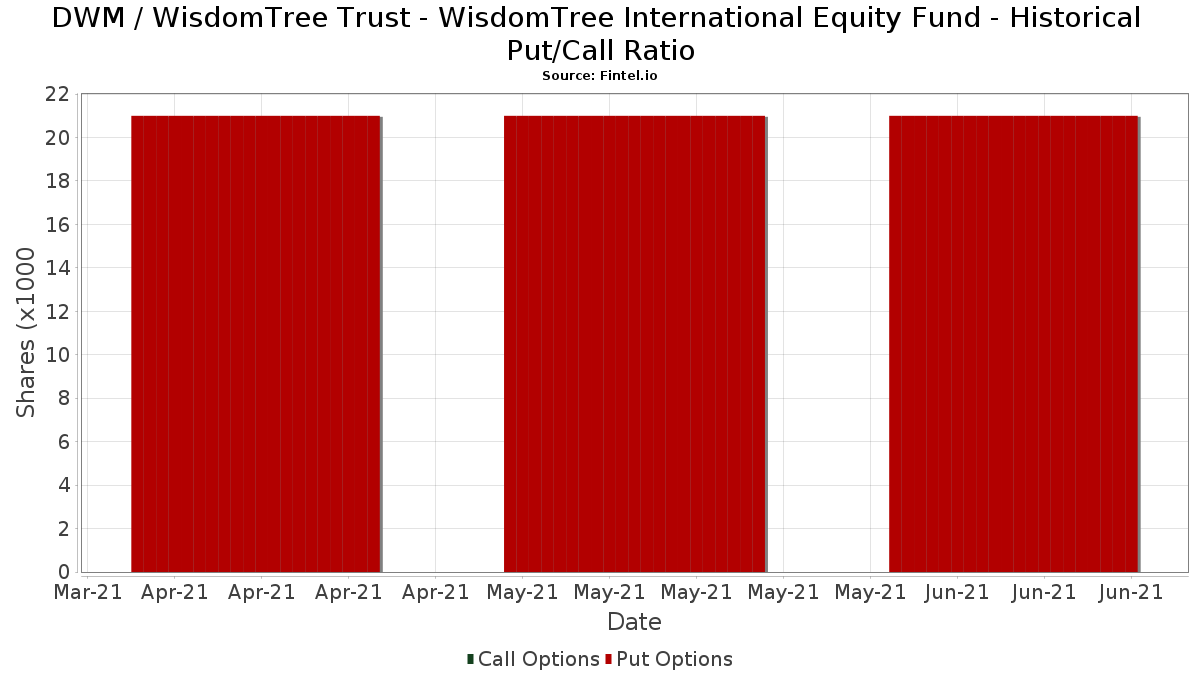
Oltre a segnalare le emissioni standard di titoli azionari e di debito, gli istituti con più di 100 milioni di asset in gestione devono anche dichiarare le loro partecipazioni in opzioni put e call. Poiché le opzioni put indicano generalmente un sentiment negativo e le opzioni call un sentiment positivo, possiamo avere un'idea del sentiment istituzionale complessivo attraverso il rapporto tra put e call. Il grafico a destra mostra il rapporto storico put/call per questo strumento.
L'utilizzo del rapporto put/call come indicatore del sentiment degli investitori consente di superare una delle principali lacune dell'utilizzo della proprietà istituzionale totale, ovvero il fatto che una quantità significativa di asset in gestione viene investita passivamente per seguire gli indici. Generalmente, i fondi a gestione passiva non acquistano opzioni, per cui il rapporto put/call riflette più fedelmente il sentiment dei fondi a gestione attiva.
Depositi 13F e NPORT
Le informazioni relative ai depositi 13F sono gratuite. Per accedere alle informazioni relative ai depositi NP è necessario un'abbonamento premium. Le righe verdi indicano le nuove posizioni. Le righe rosse indicano le posizioni chiuse. Fai clic sull'icona del link per visualizzare la cronologia completa delle transazioni.
Esegui l'upgrade
per sbloccare i dati premium ed esportarli in Excel ![]() .
.
| Data di deposito | Fonte | Investitore | Tipo | Prezzo medio (Stima) |
Azioni | Δ Azioni (%) |
Valore dichiarato ($ 1000) |
Δ Valore (%) |
Allocazione del portafoglio (%) |
|
|---|---|---|---|---|---|---|---|---|---|---|
| 2025-07-25 | 13F | McNamara Financial Services, Inc. | 4.843 | -1,38 | 308 | 7,72 | ||||
| 2025-08-14 | 13F | UBS Group AG | 170.719 | -33,49 | 10.851 | -27,31 | ||||
| 2025-08-11 | 13F | Lowe Brockenbrough & Co Inc | 1 | 0 | ||||||
| 2025-08-04 | 13F | 4wealth Advisors, Inc. | 3.444 | 219 | ||||||
| 2025-08-14 | 13F | CIBC World Markets Inc. | 48.563 | 2,85 | 3.087 | 12,38 | ||||
| 2025-07-10 | 13F | Wealth Enhancement Advisory Services, Llc | 314.751 | -8,02 | 20.073 | 0,87 | ||||
| 2025-07-24 | 13F | Robertson Stephens Wealth Management, LLC | 16.260 | -28,67 | 1.034 | -22,04 | ||||
| 2025-07-28 | 13F | Courier Capital Llc | 26.652 | 1,51 | 1.694 | 11,01 | ||||
| 2025-08-19 | 13F | National Asset Management, Inc. | 17.593 | -9,76 | 1.118 | 8,86 | ||||
| 2025-07-23 | 13F | Viewpoint Capital Management LLC | 4.100 | 0,00 | 261 | 9,24 | ||||
| 2025-08-08 | 13F | ProVise Management Group, LLC | 14.768 | -4,48 | 939 | 4,34 | ||||
| 2025-08-12 | 13F | Steward Partners Investment Advisory, Llc | 9.305 | 0,00 | 591 | 9,24 | ||||
| 2025-08-13 | 13F | Flow Traders U.s. Llc | 53.345 | 219,14 | 3 | |||||
| 2025-07-21 | 13F | Ameritas Advisory Services, LLC | 90 | 6 | ||||||
| 2025-07-17 | 13F | New Perspectives, Inc | 4.175 | 0,00 | 265 | 9,50 | ||||
| 2025-08-12 | 13F/A | Brightwater Advisory LLC | 12.032 | -6,82 | 765 | 1,87 | ||||
| 2025-08-06 | 13F | Wedbush Securities Inc | 4.015 | -5,93 | 0 | |||||
| 2025-08-14 | 13F | Susquehanna International Group, Llp | 0 | -100,00 | 0 | |||||
| 2025-07-08 | 13F | Lowe Wealth Advisors, LLC | 320 | 0,00 | 20 | 11,11 | ||||
| 2025-07-29 | 13F | Kondo Wealth Advisors, Inc. | 17.304 | -4,77 | 1.100 | 4,17 | ||||
| 2025-07-28 | 13F | Arlington Financial Advisors, LLC | 4.887 | 0,00 | 311 | 9,15 | ||||
| 2025-07-08 | 13F | Nbc Securities, Inc. | 2.811 | -12,38 | 0 | |||||
| 2025-07-17 | 13F | Janney Montgomery Scott LLC | 30.354 | 0,85 | 2 | 0,00 | ||||
| 2025-08-08 | 13F | Financial Gravity Companies, Inc. | 246 | 0,00 | 16 | 25,00 | ||||
| 2025-07-22 | 13F | Merit Financial Group, LLC | 46.918 | 38,23 | 2.982 | 51,14 | ||||
| 2025-07-28 | 13F | Harbour Investments, Inc. | 0 | -100,00 | 0 | |||||
| 2025-08-14 | 13F | Colony Group, LLC | 4.874 | 0,00 | 310 | 9,19 | ||||
| 2025-08-08 | 13F | Creative Planning | 27.284 | 0,00 | 1.734 | 9,33 | ||||
| 2025-08-12 | 13F | MAI Capital Management | 1.571 | 0,00 | 100 | 8,79 | ||||
| 2025-08-11 | 13F | Pinnacle Financial Group, LLC / IL | 5.965 | 0,15 | 379 | 9,54 | ||||
| 2025-08-08 | 13F | Thrive Capital Management, LLC | 17.313 | 1.100 | ||||||
| 2025-08-08 | 13F | Cetera Investment Advisers | 63.652 | 30,32 | 4.046 | 42,43 | ||||
| 2025-07-22 | 13F | Plimoth Trust Co Llc | 23.622 | -3,04 | 1.501 | 6,00 | ||||
| 2025-04-29 | 13F | Bank of New York Mellon Corp | 0 | -100,00 | 0 | |||||
| 2025-07-25 | 13F | LRI Investments, LLC | 386.546 | -0,77 | 24.569 | 8,45 | ||||
| 2025-08-15 | 13F | Morgan Stanley | 1.025.785 | -1,90 | 65.199 | 7,22 | ||||
| 2025-07-17 | 13F | Independence Bank of Kentucky | 2.415 | 0,00 | 153 | 9,29 | ||||
| 2025-08-18 | 13F | Geneos Wealth Management Inc. | 26.598 | 0,01 | 1.691 | 9,31 | ||||
| 2025-08-11 | 13F | Pinnacle Wealth Planning Services, Inc. | 22.441 | 1,90 | 1.426 | 11,41 | ||||
| 2025-08-11 | 13F | Culbertson A N & Co Inc | 3.695 | 0,00 | 235 | 9,35 | ||||
| 2025-08-12 | 13F | Shakespeare Wealth Management, Inc. | 29.570 | -29,61 | 1.879 | -23,05 | ||||
| 2025-07-28 | 13F | Essex LLC | 4.300 | 0,00 | 273 | 9,20 | ||||
| 2025-07-24 | 13F | Blair William & Co/il | 2.063 | 1,38 | 131 | 11,02 | ||||
| 2025-08-06 | 13F | Commonwealth Equity Services, Llc | 14.916 | -1,60 | 1 | |||||
| 2025-07-21 | 13F | Cape Ann Savings Bank | 6.794 | 0,00 | 432 | 9,11 | ||||
| 2025-07-29 | 13F | Stratos Wealth Advisors, LLC | 21.312 | 4,78 | 1.355 | 14,55 | ||||
| 2025-08-01 | 13F | Oarsman Capital, Inc. | 13.157 | -12,49 | 836 | -4,35 | ||||
| 2025-08-14 | 13F | GWM Advisors LLC | 66 | 0,00 | 4 | 33,33 | ||||
| 2025-07-22 | 13F | DAVENPORT & Co LLC | 14.414 | -5,36 | 916 | 3,50 | ||||
| 2025-07-25 | 13F | Cwm, Llc | 4.406 | 0,80 | 0 | |||||
| 2025-07-10 | 13F | Kmg Fiduciary Partners, Llc | 12.567 | 10,45 | 799 | 20,73 | ||||
| 2025-08-29 | NP | DNL - WisdomTree Global ex-U.S. Quality Dividend Growth Fund N/A | 652 | -76,55 | 41 | -74,53 | ||||
| 2025-08-11 | 13F | CBIZ Investment Advisory Services, LLC | 0 | -100,00 | 0 | |||||
| 2025-08-14 | 13F | Harwood Advisory Group, LLC | 0 | -100,00 | 0 | -100,00 | ||||
| 2025-08-11 | 13F | WPG Advisers, LLC | 1.101 | -0,99 | 70 | 7,81 | ||||
| 2025-07-21 | 13F | Creative Capital Management Investments LLC | 539 | 0,00 | 34 | 9,68 | ||||
| 2025-08-15 | 13F | Kestra Advisory Services, LLC | 117.768 | 12,08 | 7.485 | 22,50 | ||||
| 2025-07-16 | 13F | Falcon Wealth Planning | 11.642 | 1,00 | 740 | 10,30 | ||||
| 2025-07-09 | 13F | Inspirion Wealth Advisors, Llc | 6.166 | 1,73 | 392 | 11,08 | ||||
| 2025-07-28 | 13F | Frazier Financial Advisors, LLC | 16.383 | 0,22 | 1.041 | 9,58 | ||||
| 2025-08-12 | 13F | Global Retirement Partners, LLC | 66 | 0,00 | 4 | 33,33 | ||||
| 2025-07-22 | 13F | Valley National Advisers Inc | 4.014 | 0,00 | 0 | |||||
| 2025-07-30 | 13F | Bogart Wealth, LLC | 133 | 0,00 | 8 | 14,29 | ||||
| 2025-05-15 | 13F | Citadel Advisors Llc | 0 | -100,00 | 0 | |||||
| 2025-08-11 | 13F | Principal Securities, Inc. | 115 | 0,00 | 7 | 16,67 | ||||
| 2025-08-07 | 13F | Allworth Financial LP | 793 | 50 | ||||||
| 2025-08-14 | 13F | Jane Street Group, Llc | 0 | -100,00 | 0 | |||||
| 2025-08-08 | 13F | Kingsview Wealth Management, LLC | 9.228 | -0,18 | 587 | 9,12 | ||||
| 2025-08-14 | 13F | Royal Bank Of Canada | 19.672 | -0,16 | 1.250 | 9,08 | ||||
| 2025-04-24 | 13F | Philip James Wealth Mangement, LLC | 0 | -100,00 | 0 | |||||
| 2025-07-24 | 13F | Jfs Wealth Advisors, Llc | 74.136 | -1,66 | 4.712 | 7,48 | ||||
| 2025-08-12 | 13F | Pathstone Holdings, LLC | 3.225 | 205 | ||||||
| 2025-08-11 | 13F | Howard Wealth Management, Llc | 5.615 | 0,00 | 357 | 9,20 | ||||
| 2025-07-10 | 13F | Moller Financial Services | 106.914 | -5,17 | 6.795 | 3,65 | ||||
| 2025-08-14 | 13F | Fmr Llc | 2.323 | -4,09 | 148 | 5,00 | ||||
| 2025-08-12 | 13F | Allen Capital Group, LLC | 6.868 | 0,00 | 437 | 9,27 | ||||
| 2025-04-30 | 13F | Sofos Investments, Inc. | 246 | -5,38 | 14 | 7,69 | ||||
| 2025-08-12 | 13F | Proequities, Inc. | 0 | 0 | ||||||
| 2025-08-05 | 13F | NewSquare Capital LLC | 66.324 | 4,53 | 4.216 | 14,26 | ||||
| 2025-08-15 | 13F | Tower Research Capital LLC (TRC) | 1 | 0,00 | 0 | |||||
| 2025-07-17 | 13F | Beacon Capital Management, LLC | 395 | 1,80 | 25 | 13,64 | ||||
| 2025-07-23 | 13F | Litman Gregory Asset Management LLC | 7.000 | 0,00 | 445 | 9,09 | ||||
| 2025-08-08 | 13F | Intrua Financial, LLC | 11.891 | 0,00 | 756 | 9,26 | ||||
| 2025-07-09 | 13F | Beacon Financial Group | 9.732 | -10,34 | 619 | -2,06 | ||||
| 2025-08-14 | 13F | Ameriprise Financial Inc | 3.742 | 238 | ||||||
| 2025-08-04 | 13F | Spire Wealth Management | 0 | -100,00 | 0 | |||||
| 2025-08-11 | 13F | Rothschild Investment Llc | 235 | 0,00 | 15 | 7,69 | ||||
| 2025-08-13 | 13F | Financial Freedom, LLC | 378 | 0,00 | 24 | 14,29 | ||||
| 2025-08-06 | 13F | AE Wealth Management LLC | 428 | 140,45 | 27 | 170,00 | ||||
| 2025-08-14 | 13F | Sei Investments Co | 43.286 | -3,53 | 2.751 | 5,44 | ||||
| 2025-08-12 | 13F | Jpmorgan Chase & Co | 14.142 | -5,80 | 899 | 2,86 | ||||
| 2025-08-14 | 13F | Bank Of America Corp /de/ | 367.152 | 0,51 | 23.336 | 9,86 | ||||
| 2025-08-11 | 13F | Aptus Capital Advisors, LLC | 1.650 | 0,00 | 105 | 9,47 | ||||
| 2025-07-29 | 13F | JTC Employer Solutions Trusteee Ltd | 4.226 | 0,00 | 0 | |||||
| 2025-08-14 | 13F | Ancora Advisors, LLC | 1.000 | 0,00 | 64 | 8,62 | ||||
| 2025-07-23 | 13F | Valmark Advisers, Inc. | 301.119 | -0,17 | 19.139 | 9,10 | ||||
| 2025-08-01 | 13F | Envestnet Asset Management Inc | 44.779 | -8,21 | 2.846 | 0,32 | ||||
| 2025-08-11 | 13F | HighTower Advisors, LLC | 12.139 | 3,14 | 772 | 12,72 | ||||
| 2025-07-16 | 13F | Signaturefd, Llc | 0 | -100,00 | 0 | |||||
| 2025-07-24 | 13F | IFP Advisors, Inc | 508 | 32 | ||||||
| 2025-08-13 | 13F | Twin Peaks Wealth Advisors, LLC | 2.180 | 143 | ||||||
| 2025-07-31 | 13F | Cambridge Investment Research Advisors, Inc. | 18.746 | 5,49 | 1 | 0,00 | ||||
| 2025-08-13 | 13F | Jones Financial Companies Lllp | 6.594 | 0,00 | 418 | 8,57 | ||||
| 2025-08-04 | 13F | HBK Sorce Advisory LLC | 54.765 | -6,94 | 3.481 | 1,69 | ||||
| 2025-08-14 | 13F | Stifel Financial Corp | 15.250 | -2,50 | 969 | 6,60 | ||||
| 2025-08-13 | 13F | EverSource Wealth Advisors, LLC | 325 | 0,00 | 21 | 11,11 | ||||
| 2025-08-06 | 13F | Modera Wealth Management, LLC | 11.879 | 0,00 | 755 | 9,42 | ||||
| 2025-08-12 | 13F | OneAscent Financial Services LLC | 7.531 | 1,21 | 0 | |||||
| 2025-08-12 | 13F | O'shaughnessy Asset Management, Llc | 822 | 0,00 | 52 | 10,64 | ||||
| 2025-08-05 | 13F | Mission Wealth Management, Lp | 58.867 | -3,78 | 3.742 | 5,17 | ||||
| 2025-08-14 | 13F | Raymond James Financial Inc | 84.593 | 1,28 | 5.377 | 10,69 | ||||
| 2025-07-11 | 13F | Trust Co Of Virginia /va | 5.783 | 0,00 | 368 | 9,23 | ||||
| 2025-08-11 | 13F | Tidemark, LLC | 783 | 0,00 | 50 | 8,89 | ||||
| 2025-08-06 | 13F | Regimen Wealth, Llc | 4.470 | 1,75 | 284 | 11,37 | ||||
| 2025-07-10 | 13F | Envision Financial LLC | 53.044 | 1,09 | 3.371 | 10,49 | ||||
| 2025-07-22 | 13F/A | Duncan Williams Asset Management, LLC | 3.274 | 208 | ||||||
| 2025-07-16 | 13F | Octavia Wealth Advisors, LLC | 14.994 | -8,02 | 953 | 0,53 | ||||
| 2025-08-05 | 13F | Huntington National Bank | 168 | 10,60 | ||||||
| 2025-08-14 | 13F | Wells Fargo & Company/mn | 326.088 | 1,11 | 20.726 | 10,51 | ||||
| 2025-08-14 | 13F | Wiley Bros.-aintree Capital, Llc | 24.342 | 0,05 | 1.547 | 8,94 | ||||
| 2025-08-12 | 13F | LPL Financial LLC | 526.732 | 4,16 | 33.479 | 13,85 | ||||
| 2025-08-13 | 13F | Northwestern Mutual Wealth Management Co | 2.041 | -32,82 | 130 | -26,70 | ||||
| 2025-08-14 | 13F | Comerica Bank | 22.381 | -3,15 | 1.423 | 5,88 | ||||
| 2025-08-07 | 13F | Kestra Private Wealth Services, Llc | 4.250 | 270 | ||||||
| 2025-08-05 | 13F | Westside Investment Management, Inc. | 816 | 0,00 | 52 | 8,51 | ||||
| 2025-08-13 | 13F | Tobias Financial Advisors, Inc. | 57.475 | -5,92 | 3.653 | 2,84 | ||||
| 2025-08-05 | 13F | Key FInancial Inc | 53.606 | -1,28 | 3.407 | 7,92 | ||||
| 2025-08-12 | 13F | Howe & Rusling Inc | 0 | -100,00 | 0 | |||||
| 2025-08-11 | 13F | Rockbridge Investment Management, LCC | 5.213 | -1,70 | 331 | 7,47 | ||||
| 2025-08-08 | 13F | Pnc Financial Services Group, Inc. | 6.450 | 0,00 | 410 | 9,07 | ||||
| 2025-07-29 | 13F | Private Trust Co Na | 383 | 0,00 | 24 | 9,09 | ||||
| 2025-08-12 | 13F | New World Advisors LLC | 5.654 | 14,20 | 359 | 25,09 | ||||
| 2025-03-28 | 13F/A | Berkeley, Inc | 0 | -100,00 | 0 | -100,00 | ||||
| 2025-05-14 | 13F | Legacy Financial Advisors, Inc. | 0 | -100,00 | 0 | |||||
| 2025-08-13 | 13F | Advisor Group Holdings, Inc. | 35.416 | 8,62 | 1.875 | -1,16 | ||||
| 2025-07-28 | 13F | Kiker Wealth Management, LLC | 63 | 0,00 | 4 | 33,33 | ||||
| 2025-04-25 | 13F | Smallwood Wealth Investment Management, LLC | 56.137 | 4,63 | 3.265 | 15,46 |