Statistiche di base
| Proprietari istituzionali | 192 total, 192 long only, 0 short only, 0 long/short - change of -1,54% MRQ |
| Allocazione media del portafoglio | 0.6513 % - change of -4,25% MRQ |
| Azioni istituzionali (Long) | 32.923.553 (ex 13D/G) - change of -2,19MM shares -6,24% MRQ |
| Valore istituzionale (Long) | $ 816.341 USD ($1000) |
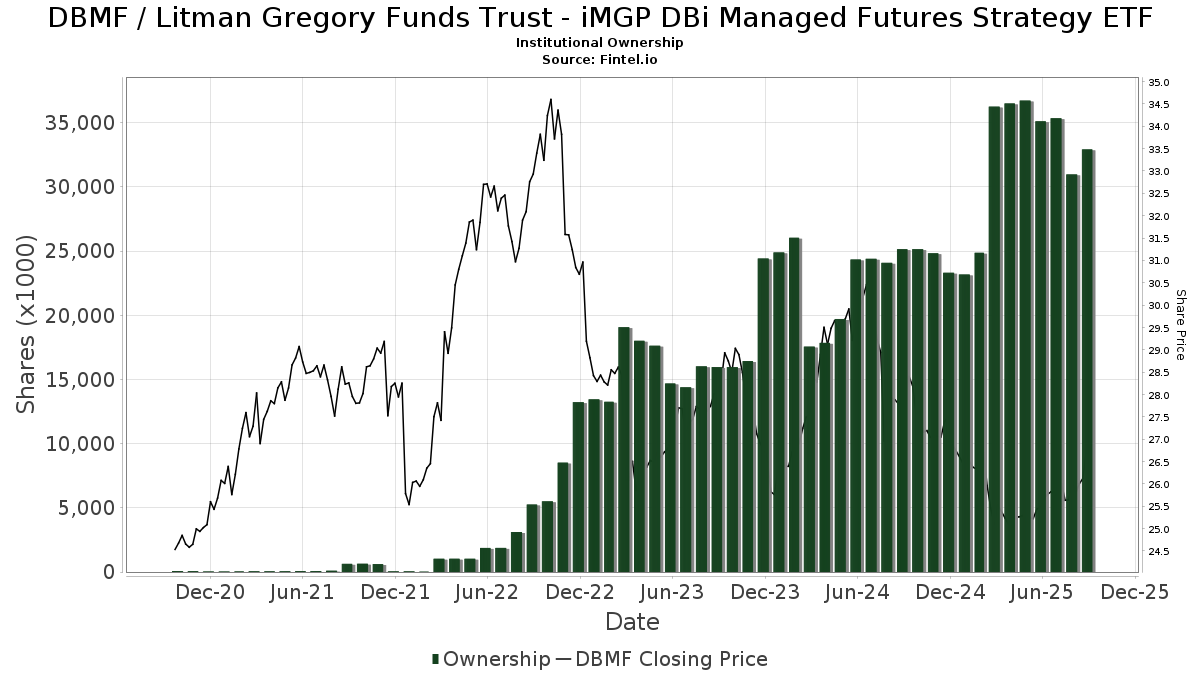
Proprietà istituzionale e azionisti
Litman Gregory Funds Trust - iMGP DBi Managed Futures Strategy ETF (US:DBMF) ha 192 proprietari istituzionali e azionisti che hanno presentato i moduli 13D/G o 13F alla Securities Exchange Commission (SEC). Queste istituzioni detengono un totale di 32,923,553 azioni. I maggiori azionisti includono LPL Financial LLC, Morgan Stanley, Northwestern Mutual Wealth Management Co, Raymond James Financial Inc, Goldstein Advisors, LLC, Litman Gregory Asset Management LLC, Cardinal Point Capital Management, ULC, RAA - SMI 3Fourteen Real Asset Allocation ETF SMI 3Fourteen REAL Asset Allocation ETF, Savant Capital, LLC, and Resources Investment Advisors, LLC. .
(Litman Gregory Funds Trust - iMGP DBi Managed Futures Strategy ETF (ARCA:DBMF) la struttura proprietaria istituzionale mostra le attuali posizioni nella società da parte di istituzioni e fondi, nonché le ultime variazioni nella dimensione della posizione. I principali azionisti possono essere singoli investitori, fondi comuni, hedge fund o istituzioni. L'allegato 13D indica che l'investitore detiene (o ha detenuto) più del 5% della società e intende (o intendeva) perseguire attivamente un cambiamento nella strategia aziendale. L'allegato 13G indica un investimento passivo superiore al 5%.
The share price as of September 5, 2025 is 26,37 / share. Previously, on September 9, 2024, the share price was 27,71 / share. This represents a decline of 4,84% over that period.
Indice del sentiment dei fondi
L'indice del sentiment dei fondi (anche noto come "indice di accumulo di proprietà") individua i titoli più acquistati dai fondi. È il risultato di un sofisticato modello quantitativo multi-fattore che identifica le società con i più alti livelli di accumulo istituzionale. Il modello utilizza una combinazione dell'aumento totale dei proprietari dichiarati, delle variazioni nelle allocazioni di portafoglio di tali proprietari e di altre metriche. Il punteggio varia da 0 a 100: i numeri più alti indicano un livello di accumulo superiore ad altre società, mentre 50 rappresenta la media.
Frequenza di aggiornamento: giornaliera
Consulta Ownership Explorer per visualizzare l'elenco delle aziende con il ranking più alto.
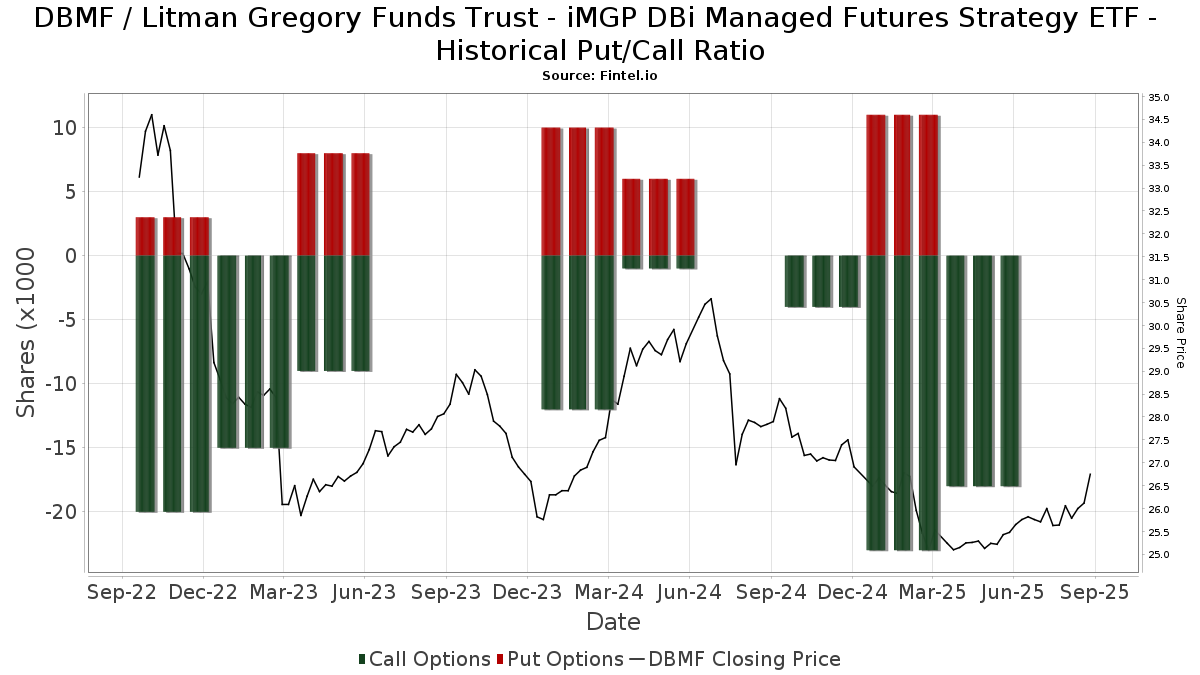
Rapporto put/call istituzionale
Oltre a segnalare le emissioni standard di titoli azionari e di debito, gli istituti con più di 100 milioni di asset in gestione devono anche dichiarare le loro partecipazioni in opzioni put e call. Poiché le opzioni put indicano generalmente un sentiment negativo e le opzioni call un sentiment positivo, possiamo avere un'idea del sentiment istituzionale complessivo attraverso il rapporto tra put e call. Il grafico a destra mostra il rapporto storico put/call per questo strumento.
L'utilizzo del rapporto put/call come indicatore del sentiment degli investitori consente di superare una delle principali lacune dell'utilizzo della proprietà istituzionale totale, ovvero il fatto che una quantità significativa di asset in gestione viene investita passivamente per seguire gli indici. Generalmente, i fondi a gestione passiva non acquistano opzioni, per cui il rapporto put/call riflette più fedelmente il sentiment dei fondi a gestione attiva.
Depositi 13F e NPORT
Le informazioni relative ai depositi 13F sono gratuite. Per accedere alle informazioni relative ai depositi NP è necessario un'abbonamento premium. Le righe verdi indicano le nuove posizioni. Le righe rosse indicano le posizioni chiuse. Fai clic sull'icona del link per visualizzare la cronologia completa delle transazioni.
Esegui l'upgrade
per sbloccare i dati premium ed esportarli in Excel ![]() .
.
| Data di deposito | Fonte | Investitore | Tipo | Prezzo medio (Stima) |
Azioni | Δ Azioni (%) |
Valore dichiarato ($ 1000) |
Δ Valore (%) |
Allocazione del portafoglio (%) |
|
|---|---|---|---|---|---|---|---|---|---|---|
| 2025-08-11 | 13F | Trajan Wealth LLC | 25.272 | -15,53 | 650 | -13,91 | ||||
| 2025-08-04 | 13F | IFG Advisory, LLC | 62.396 | 23,82 | 1.605 | 26,18 | ||||
| 2025-07-16 | 13F | Castleview Partners, Llc | 49.055 | 225,84 | 1.262 | 232,11 | ||||
| 2025-04-21 | 13F | Envestnet Portfolio Solutions, Inc. | 0 | -100,00 | 0 | |||||
| 2025-05-08 | 13F | Altiora Financial Group, LLC | 0 | -100,00 | 0 | |||||
| 2025-05-06 | 13F | Proficio Capital Partners LLC | 0 | -100,00 | 0 | -100,00 | ||||
| 2025-07-30 | 13F | Drive Wealth Management, Llc | 0 | -100,00 | 0 | |||||
| 2025-08-12 | 13F | CIBC Private Wealth Group, LLC | 2.621 | 0,00 | 67 | 4,69 | ||||
| 2025-08-05 | 13F | Elyxium Wealth, LLC | 53.320 | 86,81 | 1.372 | 90,42 | ||||
| 2025-07-10 | 13F | Focus Financial Network, Inc. | 9.440 | 12,15 | 243 | 14,15 | ||||
| 2025-05-16 | 13F/A | Kestra Investment Management, LLC | 0 | -100,00 | 0 | |||||
| 2025-07-29 | 13F | Private Trust Co Na | 14.709 | 3,63 | 378 | 5,59 | ||||
| 2025-08-18 | 13F | N.E.W. Advisory Services LLC | 32 | 0,00 | 1 | |||||
| 2025-08-13 | 13F | Cambria Investment Management, L.P. | 266.136 | 6.848 | ||||||
| 2025-05-15 | 13F/A | Orion Portfolio Solutions, LLC | 18.786 | -8,09 | 475 | -11,24 | ||||
| 2025-07-28 | 13F | Innova Wealth Partners | 78.643 | 158,81 | 2.023 | 163,75 | ||||
| 2025-08-14 | 13F | Wells Fargo & Company/mn | 385.626 | -1,47 | 9.922 | 0,36 | ||||
| 2025-07-09 | 13F | Fermata Advisors, LLC | 131.305 | 16,23 | 3.378 | 18,40 | ||||
| 2025-08-14 | 13F | GWM Advisors LLC | 75.884 | 35,22 | 1.953 | 37,76 | ||||
| 2025-05-12 | 13F | Fmr Llc | 0 | -100,00 | 0 | |||||
| 2025-07-25 | 13F | We Are One Seven, LLC | 12.629 | -1,44 | 325 | 0,31 | ||||
| 2025-08-05 | 13F | ALM First Financial Advisors, LLC | 472.305 | 0,00 | 12.152 | 1,86 | ||||
| 2025-08-14 | 13F | Citadel Advisors Llc | Put | 0 | -100,00 | 0 | ||||
| 2025-08-25 | NP | MAINSTAY VP FUNDS TRUST - MainStay VP IQ Hedge Multi-Strategy Portfolio Initial Class | 104.896 | 9,97 | 2.699 | 12,00 | ||||
| 2025-06-24 | NP | TNMAX - 1290 Multi-Alternative Strategies Fund Class A | 88.890 | 16,71 | 2.245 | 11,41 | ||||
| 2025-08-01 | 13F | Solstein Capital, LLC | 35 | 0,00 | 1 | |||||
| 2025-08-14 | 13F | Citadel Advisors Llc | Call | 18.200 | -21,21 | 468 | -19,73 | |||
| 2025-08-14 | 13F | Visionary Wealth Advisors | 43.441 | -14,51 | 1.118 | -12,94 | ||||
| 2025-04-22 | 13F | FMA Wealth Management, LLC | 0 | -100,00 | 0 | -100,00 | ||||
| 2025-08-15 | 13F | Harvest Fund Management Co., Ltd | 1.053 | 0,00 | 0 | |||||
| 2025-08-08 | 13F | Austin Wealth Management, LLC | 559.759 | 23,93 | 14.335 | 25,31 | ||||
| 2025-07-10 | 13F | Wealth Enhancement Advisory Services, Llc | 34.466 | -58,36 | 888 | -57,51 | ||||
| 2025-07-10 | 13F | Rockland Trust Co | 293.140 | 7.542 | ||||||
| 2025-08-11 | 13F | HighTower Advisors, LLC | 0 | -100,00 | 0 | |||||
| 2025-07-28 | 13F | Axxcess Wealth Management, Llc | 362.965 | 42,58 | 9.339 | 45,24 | ||||
| 2025-08-13 | 13F | Quadrature Capital Ltd | 0 | -100,00 | 0 | |||||
| 2025-08-13 | 13F | Northwestern Mutual Wealth Management Co | 1.896.185 | -3,93 | 48.789 | -2,14 | ||||
| 2025-08-14 | 13F | Pinnacle Family Advisors, LLC | 17.684 | 5,51 | 455 | 7,57 | ||||
| 2025-08-08 | 13F | Meridian Wealth Management, LLC | 14.258 | -31,73 | 367 | -30,55 | ||||
| 2025-07-30 | NP | ENDW - Cambria Endowment Style ETF | 94.873 | 2.393 | ||||||
| 2025-07-09 | 13F | Burt Wealth Advisors | 21.460 | 80,32 | 552 | 84,00 | ||||
| 2025-08-15 | 13F | Equitable Holdings, Inc. | 171.614 | 2,51 | 4.416 | 4,42 | ||||
| 2025-08-14 | 13F | Mariner, LLC | 57.195 | -2,86 | 1.472 | -1,08 | ||||
| 2025-07-14 | 13F | Matrix Trust Co | 40.746 | -2,12 | 1 | 0,00 | ||||
| 2025-05-14 | 13F | Atomi Financial Group, Inc. | 0 | -100,00 | 0 | |||||
| 2025-08-14 | 13F | Principia Wealth Advisory, LLC | 200.450 | -5,96 | 5.157 | -3,61 | ||||
| 2025-08-08 | 13F | Avantax Advisory Services, Inc. | 0 | -100,00 | 0 | |||||
| 2025-07-22 | 13F | Wealthcare Advisory Partners LLC | 11.846 | 305 | ||||||
| 2025-05-16 | 13F | Arete Wealth Advisors, LLC | 0 | -100,00 | 0 | |||||
| 2025-07-15 | 13F | FLP Wealth Management, LLC | 0 | -100,00 | 0 | |||||
| 2025-08-14 | 13F | Stansberry Asset Management, Llc | 116.648 | -2,25 | 3.001 | -0,43 | ||||
| 2025-08-08 | 13F | Cetera Investment Advisers | 199.414 | 25,73 | 5.131 | 28,06 | ||||
| 2025-08-06 | 13F | New Millennium Group LLC | 1 | 0 | ||||||
| 2025-05-01 | 13F | Quest 10 Wealth Builders, Inc. | 569 | -38,82 | 14 | -41,67 | ||||
| 2025-07-25 | 13F | R. W. Roge & Company, Inc. | 71.213 | 2 | ||||||
| 2025-08-13 | 13F | GeoWealth Management, LLC | 12.985 | 0,64 | 334 | 2,77 | ||||
| 2025-08-07 | 13F | Howard Bailey Securities, Llc | 52.383 | -2,10 | 1.348 | -0,30 | ||||
| 2025-08-12 | 13F | SRS Capital Advisors, Inc. | 490 | 0,62 | 13 | 0,00 | ||||
| 2025-08-13 | 13F | West Chester Capital Advisors, Inc | 0 | -100,00 | 0 | |||||
| 2025-06-27 | NP | TRTY - Cambria Trinity ETF | 171.263 | 4.326 | ||||||
| 2025-07-25 | 13F | Northwest Capital Management Inc | 492 | 14,95 | 13 | 20,00 | ||||
| 2025-08-07 | 13F | Vise Technologies, Inc. | 0 | -100,00 | 0 | |||||
| 2025-07-03 | 13F | City Center Advisors, LLC | 35.289 | -2,47 | 908 | -0,77 | ||||
| 2025-07-08 | 13F | Zrc Wealth Management, Llc | 2.290 | 0,00 | 59 | 1,75 | ||||
| 2025-08-26 | NP | EQ ADVISORS TRUST - 1290 VT Multi-Alternative Strategies Portfolio Class IB | 42.840 | 1,73 | 1.102 | 3,67 | ||||
| 2025-08-06 | 13F | Ethos Financial Group, LLC | 13.107 | -37,65 | 335 | -38,76 | ||||
| 2025-08-11 | 13F | Citigroup Inc | 5.433 | -45,36 | 140 | -44,62 | ||||
| 2025-08-11 | 13F | Empowered Funds, LLC | 94.873 | 2.441 | ||||||
| 2025-08-12 | 13F | Global Retirement Partners, LLC | 25.841 | 5.088,96 | 665 | 5.007,69 | ||||
| 2025-05-14 | 13F | Legend Financial Advisors, Inc. | 0 | -100,00 | 0 | |||||
| 2025-07-09 | 13F | Dynamic Advisor Solutions LLC | 0 | -100,00 | 0 | |||||
| 2025-07-15 | 13F | Family Investment Center, Inc. | 26.591 | -92,49 | 684 | -92,35 | ||||
| 2025-08-12 | 13F | LPL Financial LLC | 5.156.988 | 5,09 | 132.689 | 7,04 | ||||
| 2025-08-13 | 13F | Renaissance Technologies Llc | 176.400 | 356,99 | 4.539 | 365,44 | ||||
| 2025-08-14 | 13F | Royal Bank Of Canada | 64.115 | 32,37 | 1.650 | 34,91 | ||||
| 2025-08-15 | 13F | WFA of San Diego, LLC | 136 | -80,26 | 3 | -84,21 | ||||
| 2025-08-11 | 13F | Private Advisor Group, LLC | 400.560 | -6,72 | 10.306 | -4,98 | ||||
| 2025-08-13 | 13F | Virtue Capital Management, LLC | 0 | -100,00 | 0 | |||||
| 2025-08-14 | 13F | Ausdal Financial Partners, Inc. | 25.821 | -1,45 | 664 | 0,45 | ||||
| 2025-07-10 | 13F | Exchange Traded Concepts, Llc | 27.384 | 1,36 | 705 | 3,23 | ||||
| 2025-07-23 | 13F | Valmark Advisers, Inc. | 475.069 | -3,99 | 12.224 | -2,21 | ||||
| 2025-08-14 | 13F | Raymond James Financial Inc | 1.285.564 | 54,95 | 33.078 | 57,83 | ||||
| 2025-07-16 | 13F | ORG Partners LLC | 14.785 | 7,01 | 381 | 8,88 | ||||
| 2025-07-18 | 13F | Midwest Financial Group LLC | 71.699 | 4,46 | 1.845 | 6,41 | ||||
| 2025-08-08 | 13F | Creative Planning | 17.424 | -9,37 | 448 | -7,63 | ||||
| 2025-08-01 | 13F | Bessemer Group Inc | 92 | 0,00 | 0 | |||||
| 2025-07-24 | 13F | IFP Advisors, Inc | 1.655 | -14,87 | 43 | -14,29 | ||||
| 2025-08-05 | 13F | Tsfg, Llc | 108 | 0,93 | 0 | |||||
| 2025-05-02 | 13F | Fortress Wealth Group, LLC | 0 | -100,00 | 0 | -100,00 | ||||
| 2025-08-14 | 13F | UBS Group AG | 6.000 | -26,95 | 154 | -25,60 | ||||
| 2025-07-28 | 13F | Fairman Group, LLC | 75.079 | -12,96 | 1.932 | -9,34 | ||||
| 2025-07-24 | 13F | Live Oak Investment Partners | 115.778 | 0,01 | 2.979 | 1,85 | ||||
| 2025-07-18 | 13F | Astor Investment Management LLC | 177.689 | -3,82 | 4.572 | -2,04 | ||||
| 2025-05-02 | 13F | Parcion Private Wealth LLC | 0 | -100,00 | 0 | |||||
| 2025-08-05 | 13F | Bank of New York Mellon Corp | 9.212 | -3,94 | 237 | -2,07 | ||||
| 2025-08-14 | 13F | Hrt Financial Lp | 26.999 | 1 | ||||||
| 2025-07-29 | 13F | Signature Estate & Investment Advisors Llc | 0 | -100,00 | 0 | |||||
| 2025-08-13 | 13F | Truvestments Capital Llc | 0 | -100,00 | 0 | |||||
| 2025-04-25 | 13F | New Wave Wealth Advisors Llc | 0 | -100,00 | 0 | |||||
| 2025-08-14 | 13F | Citadel Advisors Llc | 97.613 | 334,24 | 2.512 | 342,86 | ||||
| 2025-07-30 | 13F | Strategic Blueprint, LLC | 0 | -100,00 | 0 | |||||
| 2025-08-13 | 13F | Transce3nd, LLC | 1.686 | -0,35 | 43 | 2,38 | ||||
| 2025-08-13 | 13F | Legacy Capital Wealth Partners, LLC | 0 | -100,00 | 0 | |||||
| 2025-08-06 | 13F | Entrewealth, Llc | 90.668 | 8,40 | 2.333 | 10,42 | ||||
| 2025-08-07 | 13F | Nwam Llc | 31.991 | 19,32 | 820 | 20,97 | ||||
| 2025-07-11 | 13F | Deane Retirement Strategies, Inc. | 217.648 | 31.171,26 | 5.600 | 32.835,29 | ||||
| 2025-08-11 | 13F | Principal Securities, Inc. | 2.495 | 596,93 | 64 | 611,11 | ||||
| 2025-07-31 | 13F | West Michigan Advisors, Llc | 14.128 | 57,34 | 366 | 61,50 | ||||
| 2025-08-11 | 13F | Perennial Investment Advisors, LLC | 44.928 | 73,47 | 1.156 | 76,76 | ||||
| 2025-08-18 | 13F/A | National Bank Of Canada /fi/ | 37.316 | 2,39 | 960 | 4,24 | ||||
| 2025-07-17 | 13F | Fifth Third Securities, Inc. | 8.873 | -9,54 | 228 | -7,69 | ||||
| 2025-07-23 | 13F | TriaGen Wealth Management LLC | 88.500 | 11,88 | 2.277 | 13,96 | ||||
| 2025-08-12 | 13F | Change Path, LLC | 13.392 | 9,73 | 345 | 11,69 | ||||
| 2025-07-25 | 13F | Cwm, Llc | 194.372 | -93,01 | 5 | -92,86 | ||||
| 2025-07-18 | 13F | Truist Financial Corp | 0 | -100,00 | 0 | |||||
| 2025-08-13 | 13F | Flow Traders U.s. Llc | 29.355 | 1 | ||||||
| 2025-07-03 | 13F | Garde Capital, Inc. | 100 | 3 | ||||||
| 2025-08-14 | 13F | Css Llc/il | 205.764 | 2,02 | 5.294 | 3,93 | ||||
| 2025-07-31 | 13F | Longview Financial Advisors, Inc. | 134.819 | -8,76 | 3.469 | -7,07 | ||||
| 2025-07-14 | 13F | Legacy Capital Group California, Inc. | 45.872 | 2,62 | 1.180 | 4,52 | ||||
| 2025-09-04 | 13F/A | Advisor Group Holdings, Inc. | 39.125 | 75,22 | 1.007 | 78,37 | ||||
| 2025-06-02 | 13F/A | Modern Wealth Management, LLC | 8.541 | 0,31 | 216 | -3,15 | ||||
| 2025-07-16 | 13F | ORG Wealth Partners, LLC | 27.880 | 7,11 | 718 | 8,97 | ||||
| 2025-08-14 | 13F | Sunbelt Securities, Inc. | 64 | 0,00 | 2 | 0,00 | ||||
| 2025-05-15 | 13F | Advisory Services Network, LLC | 0 | -100,00 | 0 | |||||
| 2025-08-13 | 13F | Manning & Napier Advisors Llc | 888 | 23 | ||||||
| 2025-07-11 | 13F | Mkd Wealth Coaches, Llc | 92.434 | 0,01 | 2.378 | 1,89 | ||||
| 2025-07-14 | 13F | Ai Financial Services Llc | 222.129 | 2,48 | 5.715 | 4,40 | ||||
| 2025-08-14 | 13F | Comerica Bank | 24.850 | 19,27 | 639 | 21,48 | ||||
| 2025-07-15 | 13F | Verum Partners LLC | 8.899 | -49,45 | 229 | -48,65 | ||||
| 2025-08-15 | 13F | Kestra Advisory Services, LLC | 15.860 | -22,94 | 408 | -21,39 | ||||
| 2025-07-14 | 13F | E&G Advisors, LP | 72.782 | -3,45 | 1.873 | -1,68 | ||||
| 2025-07-29 | 13F | Sage Private Wealth Group, Llc | 460.951 | 9,99 | 11.860 | 12,03 | ||||
| 2025-05-08 | 13F | Moors & Cabot, Inc. | 0 | -100,00 | 0 | |||||
| 2025-07-24 | 13F | Ronald Blue Trust, Inc. | 50 | 0,00 | 1 | 0,00 | ||||
| 2025-08-14 | 13F | Mml Investors Services, Llc | 66.849 | 4,70 | 2 | 0,00 | ||||
| 2025-05-12 | 13F | Simplex Trading, Llc | 0 | -100,00 | 0 | |||||
| 2025-08-14 | 13F | Toroso Investments, LLC | 339.077 | 140,72 | 8.724 | 145,19 | ||||
| 2025-07-23 | 13F | Citizens National Bank Trust Department | 0 | -100,00 | 0 | |||||
| 2025-08-05 | 13F | Retirement Financial Solutions, Llc | 12.465 | -12,35 | 321 | -10,86 | ||||
| 2025-08-15 | 13F | Morgan Stanley | 2.680.823 | 13,59 | 68.978 | 15,70 | ||||
| 2025-08-05 | 13F | Optivise Advisory Services LLC | 69.008 | 1,78 | 1.776 | 3,68 | ||||
| 2025-07-28 | 13F | Smart Portfolios, LLC | 31.336 | 25,78 | 806 | 28,14 | ||||
| 2025-04-23 | 13F | PMV Capital Advisers, LLC | 0 | -100,00 | 0 | |||||
| 2025-08-04 | 13F | Savvy Advisors, Inc. | 48.641 | 25,96 | 1.252 | 28,31 | ||||
| 2025-04-22 | 13F | World Equity Group, Inc. | 0 | -100,00 | 0 | |||||
| 2025-08-01 | 13F | Envestnet Asset Management Inc | 633.318 | 6,89 | 16.295 | 8,89 | ||||
| 2025-08-29 | NP | RAA - SMI 3Fourteen Real Asset Allocation ETF SMI 3Fourteen REAL Asset Allocation ETF | 958.053 | 218,89 | 24.651 | 224,81 | ||||
| 2025-07-24 | 13F | Stonebridge Financial Group, LLC | 31.508 | 940,21 | 811 | 965,79 | ||||
| 2025-08-14 | 13F | Federation des caisses Desjardins du Quebec | 1.201 | 0,00 | 31 | 0,00 | ||||
| 2025-07-18 | 13F | Trilogy Capital Inc. | 24.044 | 14,35 | 619 | 16,38 | ||||
| 2025-08-11 | 13F | Advisor Resource Council | 9.053 | -96,69 | 233 | -96,53 | ||||
| 2025-08-14 | 13F | Ancora Advisors, LLC | 0 | -100,00 | 0 | |||||
| 2025-08-14 | 13F | Wiley Bros.-aintree Capital, Llc | 10.527 | 271 | ||||||
| 2025-08-07 | 13F | Resources Investment Advisors, LLC. | 689.223 | -1,08 | 17.734 | 0,76 | ||||
| 2025-08-12 | 13F | Integrated Advisors Network LLC | 9.900 | -40,04 | 255 | -39,09 | ||||
| 2025-08-12 | 13F | Proequities, Inc. | 0 | 0 | ||||||
| 2025-04-25 | 13F | Mather Group, Llc. | 0 | -100,00 | 0 | |||||
| 2025-08-29 | 13F | Centaurus Financial, Inc. | 10.785 | 0 | ||||||
| 2025-08-05 | 13F | Scarborough Advisors, LLC | 113.140 | -6,43 | 2.911 | -4,68 | ||||
| 2025-08-01 | 13F | New York Life Investment Management Llc | 474.820 | 19,04 | 12.217 | 21,26 | ||||
| 2025-08-13 | 13F | Empire Financial Management Company, LLC | 204.996 | -0,32 | 5.275 | 1,54 | ||||
| 2025-07-23 | 13F | Columbus Macro, LLC | 36.690 | 944 | ||||||
| 2025-08-14 | 13F | Integrated Wealth Concepts LLC | 28.097 | 5,26 | 723 | 7,12 | ||||
| 2025-08-13 | 13F | IAG Wealth Partners, LLC | 414.567 | 19,85 | 10.667 | 22,08 | ||||
| 2025-07-07 | 13F | Upper Left Wealth Management, LLC | 181.056 | 19,21 | 4.659 | 21,43 | ||||
| 2025-08-06 | 13F | Commonwealth Equity Services, Llc | 498.815 | -25,63 | 13 | -25,00 | ||||
| 2025-07-22 | 13F | Merit Financial Group, LLC | 36.954 | 951 | ||||||
| 2025-07-23 | 13F | Litman Gregory Asset Management LLC | 1.166.894 | -1,13 | 30.024 | 0,71 | ||||
| 2025-08-06 | 13F | Summit Wealth & Retirement Planning, Inc. | 585.899 | 3,96 | 15.075 | 5,89 | ||||
| 2025-08-04 | 13F | Atria Investments Llc | 115.102 | -4,19 | 2.962 | -2,41 | ||||
| 2025-08-08 | 13F | Gts Securities Llc | 0 | -100,00 | 0 | |||||
| 2025-04-15 | 13F | Kozak & Associates, Inc. | 0 | -100,00 | 0 | |||||
| 2025-08-13 | 13F | EverSource Wealth Advisors, LLC | 6.930 | -7,23 | 178 | -5,32 | ||||
| 2025-07-16 | 13F | Octavia Wealth Advisors, LLC | 0 | -100,00 | 0 | |||||
| 2025-07-31 | 13F | Cambridge Investment Research Advisors, Inc. | 196.550 | -6,71 | 5 | 0,00 | ||||
| 2025-08-14 | 13F | Aqr Capital Management Llc | 18.673 | -14,18 | 480 | -12,57 | ||||
| 2025-08-14 | 13F | Susquehanna International Group, Llp | 20.938 | -38,82 | 539 | -37,73 | ||||
| 2025-08-06 | 13F | Wedbush Securities Inc | 18.949 | 3,27 | 0 | |||||
| 2025-07-15 | 13F | Cranbrook Wealth Management, LLC | 0 | -100,00 | 0 | |||||
| 2025-07-21 | 13F | Rainey & Randall Investment Management Inc. | 63.699 | -80,25 | 1.639 | -79,89 | ||||
| 2025-08-12 | 13F | Steward Partners Investment Advisory, Llc | 18.927 | -7,45 | 487 | -5,81 | ||||
| 2025-07-16 | 13F | Perigon Wealth Management, LLC | 8.351 | -5,77 | 215 | -4,04 | ||||
| 2025-08-11 | 13F | Lake Street Financial Llc | 12.904 | -43,17 | 332 | -42,06 | ||||
| 2025-07-22 | 13F | Simplicity Wealth,LLC | 28.924 | 744 | ||||||
| 2025-07-10 | 13F | Professional Financial Advisors, LLC | 179.591 | 8,41 | 4.621 | 10,42 | ||||
| 2025-07-17 | 13F | Sterneck Capital Management, LLC | 44.052 | 1,69 | 1.133 | 3,56 | ||||
| 2025-07-31 | 13F | Brighton Jones Llc | 10.321 | 4,81 | 266 | 6,85 | ||||
| 2025-07-28 | 13F | Naviter Wealth, LLC | 0 | -100,00 | 0 | |||||
| 2025-08-07 | 13F | LFA - Lugano Financial Advisors SA | 11.620 | 0,00 | 299 | 1,71 | ||||
| 2025-08-14 | 13F/A | Rockefeller Capital Management L.P. | 24.552 | 0,00 | 632 | 1,77 | ||||
| 2025-08-14 | 13F | L2 Asset Management, LLC | 9.574 | 246 | ||||||
| 2025-07-21 | 13F | Greenwood Capital Associates Llc | 16.874 | 24,03 | 434 | 26,53 | ||||
| 2025-08-14 | 13F | Stifel Financial Corp | 60.221 | 33,02 | 1.550 | 35,52 | ||||
| 2025-08-14 | 13F | Two Sigma Securities, Llc | 10.342 | 266 | ||||||
| 2025-07-17 | 13F | Raleigh Capital Management Inc. | 3.601 | -8,95 | 93 | -7,07 | ||||
| 2025-06-30 | NP | ASTIX - Astor Dynamic Allocation Fund Class I shares | 79.365 | 0,00 | 2.005 | -4,57 | ||||
| 2025-07-25 | 13F | Concurrent Investment Advisors, LLC | 20.387 | 46,69 | 525 | 49,29 | ||||
| 2025-08-13 | 13F | Avestar Capital, LLC | 156.034 | 8,03 | 4.015 | 10,03 | ||||
| 2025-04-21 | 13F | Nelson, Van Denburg & Campbell Wealth Management Group, LLC | 0 | -100,00 | 0 | |||||
| 2025-04-28 | 13F | DAVENPORT & Co LLC | 0 | -100,00 | 0 | |||||
| 2025-07-31 | 13F | Leelyn Smith, LLC | 259.877 | 2,61 | 6.687 | 4,52 | ||||
| 2025-08-12 | 13F | Financial Advocates Investment Management | 18.891 | 6,61 | 486 | 8,72 | ||||
| 2025-08-14 | 13F | CoreCap Advisors, LLC | 129.462 | 3,31 | 3.331 | 5,24 | ||||
| 2025-08-13 | 13F | Cerity Partners LLC | 30.905 | 0,31 | 795 | 2,19 | ||||
| 2025-08-14 | 13F | Capitolis Liquid Global Markets LLC | 149.300 | -18,01 | 3.841 | -16,48 | ||||
| 2025-08-13 | 13F | Proactive Wealth Strategies LLC | 19.545 | -9,45 | 1 | |||||
| 2025-08-06 | 13F | AE Wealth Management LLC | 25.986 | 21,54 | 669 | 23,70 | ||||
| 2025-07-15 | 13F | Genesis Wealth Advisors, LLC | 10.189 | 0,00 | 262 | 1,95 | ||||
| 2025-07-01 | 13F | Burkett Financial Services, Llc | 0 | -100,00 | 0 | |||||
| 2025-07-28 | 13F | Kiker Wealth Management, LLC | 21 | 0,00 | 1 | |||||
| 2025-08-27 | 13F/A | Brinker Capital Investments, LLC | 18.342 | -2,36 | 472 | -0,63 | ||||
| 2025-07-11 | 13F | Farther Finance Advisors, LLC | 107.476 | -37,84 | 2.765 | -36,80 | ||||
| 2025-05-09 | 13F | Sound Financial Strategies Group, LLC | 0 | -100,00 | 0 | |||||
| 2025-07-21 | 13F | Ashton Thomas Securities, Llc | 133.968 | 3.447 | ||||||
| 2025-07-29 | 13F | Goldstein Advisors, LLC | 1.180.035 | -1,99 | 30.362 | -0,17 | ||||
| 2025-08-12 | 13F | Jpmorgan Chase & Co | 248.279 | 3,75 | 6.388 | 5,67 | ||||
| 2025-04-28 | 13F | Rossby Financial, LCC | 0 | 0 | ||||||
| 2025-08-05 | 13F | Bank Of Montreal /can/ | 22.324 | -0,49 | 574 | 1,41 | ||||
| 2025-07-25 | 13F | RHS Financial, LLC | 50.250 | -5,47 | 1.293 | -3,73 | ||||
| 2025-07-24 | 13F | Eastern Bank | 0 | -100,00 | 0 | |||||
| 2025-07-15 | 13F | Fortitude Family Office, LLC | 339.371 | 9,16 | 8.732 | 11,21 | ||||
| 2025-08-13 | 13F | Baird Financial Group, Inc. | 171.235 | -2,68 | 4.406 | -0,88 | ||||
| 2025-07-24 | 13F | Us Bancorp \de\ | 360 | -50,14 | 9 | -50,00 | ||||
| 2025-08-14 | 13F | Hilltop Holdings Inc. | 76.306 | 0,39 | 1.963 | 2,29 | ||||
| 2025-07-28 | 13F | Harbour Investments, Inc. | 8.933 | 8,48 | 230 | 10,10 | ||||
| 2025-08-15 | 13F | Captrust Financial Advisors | 81.817 | -18,50 | 2.105 | -16,96 | ||||
| 2025-07-31 | 13F | Oppenheimer & Co Inc | 0 | -100,00 | 0 | |||||
| 2025-08-13 | 13F | Johnson Financial Group, Inc. | 164 | 4 | ||||||
| 2025-06-26 | NP | FARX - Frontier Asset Absolute Return ETF | 27.016 | -6,38 | 682 | -10,62 | ||||
| 2025-08-06 | 13F | Savant Capital, LLC | 704.535 | 54,00 | 18.128 | 56,86 | ||||
| 2025-07-11 | 13F | UMA Financial Services, Inc. | 0 | -100,00 | 0 | |||||
| 2025-06-25 | NP | QAI - IQ Hedge Multi-Strategy Tracker ETF | 353.804 | 17,72 | 8.937 | 12,34 | ||||
| 2025-08-11 | 13F | Inspire Advisors, LLC | 8.032 | 207 | ||||||
| 2025-07-16 | 13F | Twelve Points Wealth Management LLC | 66.857 | 0,09 | 1.720 | 1,96 | ||||
| 2025-04-15 | 13F | Reuter James Wealth Management, Llc | 0 | -100,00 | 0 | |||||
| 2025-08-12 | 13F | Frontier Asset Management, LLC | 65.772 | -48,94 | 1.692 | -47,99 | ||||
| 2025-08-12 | 13F | MAI Capital Management | 40.749 | -13,70 | 1.048 | -12,08 | ||||
| 2025-05-23 | 13F | SWAN Capital LLC | 0 | -100,00 | 0 | |||||
| 2025-07-31 | 13F | Cardinal Point Capital Management, ULC | 1.084.995 | -0,26 | 27.917 | 1,59 | ||||
| 2025-08-08 | 13F | Advyzon Investment Management, LLC | 10.994 | 4,32 | 283 | 6,02 | ||||
| 2025-08-14 | 13F | Family Office Research LLC | 32.487 | 29,58 | 836 | 31,91 | ||||
| 2025-08-04 | 13F | Creekmur Asset Management LLC | 426 | 9,79 | 11 | 11,11 | ||||
| 2025-08-14 | 13F | Bank Of America Corp /de/ | 33.263 | 3,99 | 856 | 5,95 |