Statistiche di base
| Proprietari istituzionali | 134 total, 134 long only, 0 short only, 0 long/short - change of 4,65% MRQ |
| Allocazione media del portafoglio | 0.1246 % - change of 5,06% MRQ |
| Azioni istituzionali (Long) | 7.001.631 (ex 13D/G) - change of 0,18MM shares 2,67% MRQ |
| Valore istituzionale (Long) | $ 247.379 USD ($1000) |
Proprietà istituzionale e azionisti
BlackRock Science and Technology Trust (US:BST) ha 134 proprietari istituzionali e azionisti che hanno presentato i moduli 13D/G o 13F alla Securities Exchange Commission (SEC). Queste istituzioni detengono un totale di 7,001,631 azioni. I maggiori azionisti includono Morgan Stanley, Raymond James Financial Inc, Ameriprise Financial Inc, Invesco Ltd., PCEF - Invesco CEF Income Composite ETF, Karpus Management, Inc., Royal Bank Of Canada, 1607 Capital Partners, LLC, LPL Financial LLC, and Wedbush Securities Inc .
(BlackRock Science and Technology Trust (NYSE:BST) la struttura proprietaria istituzionale mostra le attuali posizioni nella società da parte di istituzioni e fondi, nonché le ultime variazioni nella dimensione della posizione. I principali azionisti possono essere singoli investitori, fondi comuni, hedge fund o istituzioni. L'allegato 13D indica che l'investitore detiene (o ha detenuto) più del 5% della società e intende (o intendeva) perseguire attivamente un cambiamento nella strategia aziendale. L'allegato 13G indica un investimento passivo superiore al 5%.
The share price as of September 2, 2025 is 39,27 / share. Previously, on September 3, 2024, the share price was 34,27 / share. This represents an increase of 14,59% over that period.

Indice del sentiment dei fondi
L'indice del sentiment dei fondi (anche noto come "indice di accumulo di proprietà") individua i titoli più acquistati dai fondi. È il risultato di un sofisticato modello quantitativo multi-fattore che identifica le società con i più alti livelli di accumulo istituzionale. Il modello utilizza una combinazione dell'aumento totale dei proprietari dichiarati, delle variazioni nelle allocazioni di portafoglio di tali proprietari e di altre metriche. Il punteggio varia da 0 a 100: i numeri più alti indicano un livello di accumulo superiore ad altre società, mentre 50 rappresenta la media.
Frequenza di aggiornamento: giornaliera
Consulta Ownership Explorer per visualizzare l'elenco delle aziende con il ranking più alto.
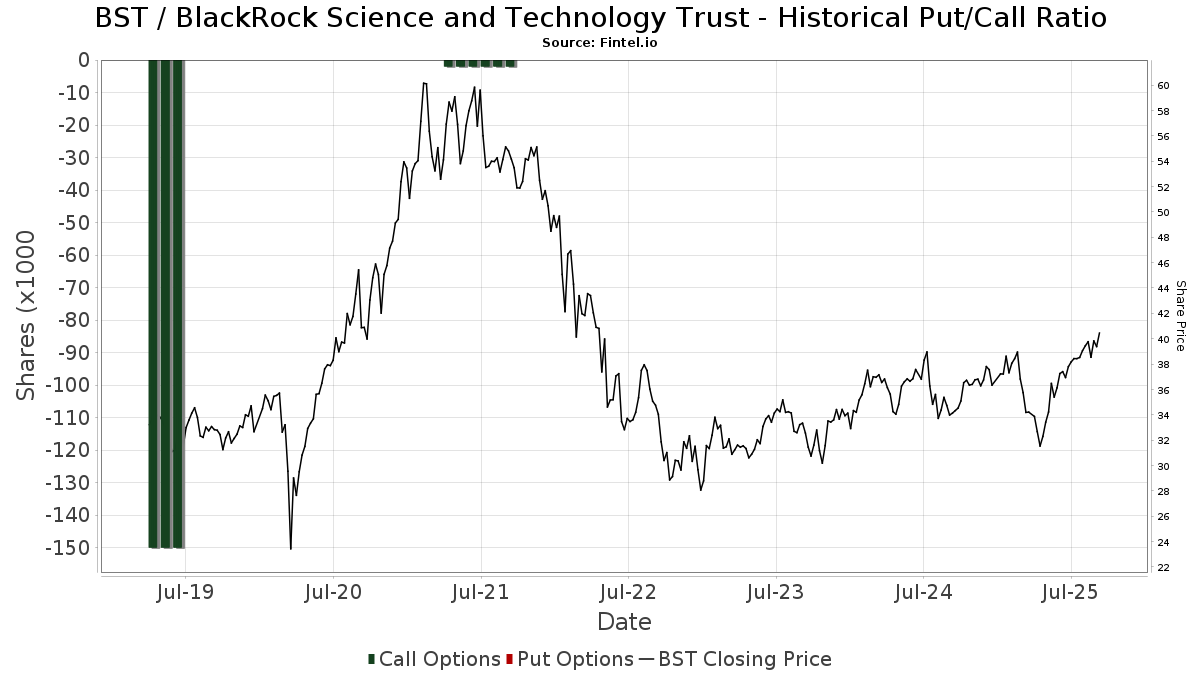
Rapporto put/call istituzionale
Oltre a segnalare le emissioni standard di titoli azionari e di debito, gli istituti con più di 100 milioni di asset in gestione devono anche dichiarare le loro partecipazioni in opzioni put e call. Poiché le opzioni put indicano generalmente un sentiment negativo e le opzioni call un sentiment positivo, possiamo avere un'idea del sentiment istituzionale complessivo attraverso il rapporto tra put e call. Il grafico a destra mostra il rapporto storico put/call per questo strumento.
L'utilizzo del rapporto put/call come indicatore del sentiment degli investitori consente di superare una delle principali lacune dell'utilizzo della proprietà istituzionale totale, ovvero il fatto che una quantità significativa di asset in gestione viene investita passivamente per seguire gli indici. Generalmente, i fondi a gestione passiva non acquistano opzioni, per cui il rapporto put/call riflette più fedelmente il sentiment dei fondi a gestione attiva.
Depositi 13F e NPORT
Le informazioni relative ai depositi 13F sono gratuite. Per accedere alle informazioni relative ai depositi NP è necessario un'abbonamento premium. Le righe verdi indicano le nuove posizioni. Le righe rosse indicano le posizioni chiuse. Fai clic sull'icona del link per visualizzare la cronologia completa delle transazioni.
Esegui l'upgrade
per sbloccare i dati premium ed esportarli in Excel ![]() .
.
| Data di deposito | Fonte | Investitore | Tipo | Prezzo medio (Stima) |
Azioni | Δ Azioni (%) |
Valore dichiarato ($ 1000) |
Δ Valore (%) |
Allocazione del portafoglio (%) |
|
|---|---|---|---|---|---|---|---|---|---|---|
| 2025-07-08 | 13F | Parallel Advisors, LLC | 721 | 8,26 | 28 | 28,57 | ||||
| 2025-07-10 | 13F | Focus Financial Network, Inc. | 15.773 | 9,37 | 602 | 26,74 | ||||
| 2025-08-05 | 13F | Westside Investment Management, Inc. | 700 | 0,00 | 27 | 13,04 | ||||
| 2025-08-04 | 13F | Creative Financial Designs Inc /adv | 313 | 0,00 | 12 | 10,00 | ||||
| 2025-08-14 | 13F | Federation des caisses Desjardins du Quebec | 970 | 0,00 | 37 | 15,63 | ||||
| 2025-08-14 | 13F | Stifel Financial Corp | 59.465 | 8,80 | 2.270 | 25,85 | ||||
| 2025-07-18 | 13F | Consolidated Portfolio Review Corp | 6.901 | -1,16 | 263 | 14,35 | ||||
| 2025-08-13 | 13F | Capital Analysts, Inc. | 660 | 0,00 | 0 | |||||
| 2025-08-14 | 13F | Goldman Sachs Group Inc | 8.347 | 35,79 | 319 | 57,43 | ||||
| 2025-08-14 | 13F | Royal Bank Of Canada | 296.112 | -0,24 | 11.303 | 15,44 | ||||
| 2025-05-13 | 13F | NINE MASTS CAPITAL Ltd | 0 | -100,00 | 0 | |||||
| 2025-08-12 | 13F | LPL Financial LLC | 260.467 | 4,24 | 9.942 | 20,61 | ||||
| 2025-08-08 | 13F | Larson Financial Group LLC | 1.115 | 0,00 | 43 | 16,67 | ||||
| 2025-08-14 | 13F | Comerica Bank | 2.330 | 8,47 | 89 | 25,71 | ||||
| 2025-08-08 | 13F | Calamos Advisors LLC | 8.586 | 1,11 | 328 | 16,79 | ||||
| 2025-07-25 | 13F | Cwm, Llc | 3.336 | -2,54 | 0 | |||||
| 2025-08-05 | 13F | EPG Wealth Management LLC | 0 | -100,00 | 0 | |||||
| 2025-08-14 | 13F | Hilltop Holdings Inc. | 14.988 | 5,39 | 572 | 21,96 | ||||
| 2025-05-15 | 13F | Parvin Asset Management, LLC | 0 | -100,00 | 0 | |||||
| 2025-08-12 | 13F | Jpmorgan Chase & Co | 3.859 | 36,55 | 147 | 58,06 | ||||
| 2025-07-22 | 13F | Kessler Investment Group, LLC | 7 | 0,00 | 0 | |||||
| 2025-08-08 | 13F | Cetera Investment Advisers | 49.871 | 3,68 | 1.904 | 19,99 | ||||
| 2025-08-04 | 13F | Spire Wealth Management | 180 | -79,82 | 7 | -79,31 | ||||
| 2025-08-12 | 13F | Global Retirement Partners, LLC | 1.096 | 0,00 | 42 | 2,50 | ||||
| 2025-08-13 | 13F | Advisor Group Holdings, Inc. | 120.777 | -10,74 | 4.428 | -0,81 | ||||
| 2025-07-11 | 13F | Farther Finance Advisors, LLC | 9 | 0,00 | 0 | |||||
| 2025-07-24 | 13F | JNBA Financial Advisors | 359 | 0,00 | 14 | 18,18 | ||||
| 2025-08-07 | 13F | Mosaic Financial Group, Llc | 0 | -100,00 | 0 | |||||
| 2025-08-04 | 13F | Arkadios Wealth Advisors | 7.297 | -10,40 | 279 | 3,73 | ||||
| 2025-07-10 | 13F | Stolper Co | 18.390 | 4,78 | 1 | |||||
| 2025-08-27 | NP | RYMSX - Guggenheim Multi-Hedge Strategies Fund Class P | 13 | -91,28 | 0 | -100,00 | ||||
| 2025-07-07 | 13F | Investors Research Corp | 250 | 10 | ||||||
| 2025-07-31 | 13F | Cambridge Investment Research Advisors, Inc. | 46.043 | -28,85 | 2 | -50,00 | ||||
| 2025-07-16 | 13F | Perigon Wealth Management, LLC | 6.826 | -11,42 | 261 | 2,36 | ||||
| 2025-07-17 | 13F | Janney Montgomery Scott LLC | 148.438 | 0,41 | 6 | 25,00 | ||||
| 2025-08-14 | 13F | Ameriprise Financial Inc | 434.074 | -2,22 | 16.576 | 13,19 | ||||
| 2025-08-14 | 13F | Great Valley Advisor Group, Inc. | 9.980 | 0,00 | 381 | 15,50 | ||||
| 2025-05-12 | 13F | Fmr Llc | 0 | -100,00 | 0 | |||||
| 2025-08-14 | 13F | UBS Group AG | 123.252 | 7,50 | 4.705 | 24,38 | ||||
| 2025-08-27 | NP | RYDEX VARIABLE TRUST - Multi-Hedge Strategies Fund Variable Annuity | 22 | -78,85 | 1 | -100,00 | ||||
| 2025-07-28 | 13F | BRYN MAWR TRUST Co | 2.150 | 0,00 | 82 | 17,14 | ||||
| 2025-08-12 | 13F | J.w. Cole Advisors, Inc. | 32.451 | 13,47 | 1.239 | 31,28 | ||||
| 2025-08-15 | 13F | Kestra Advisory Services, LLC | 21.646 | 3,90 | 826 | 20,23 | ||||
| 2025-05-16 | 13F | Arete Wealth Advisors, LLC | 0 | -100,00 | 0 | |||||
| 2025-07-18 | 13F | TruNorth Capital Management, LLC | 100 | 2,04 | 4 | 0,00 | ||||
| 2025-08-06 | 13F | Prospera Financial Services Inc | 14.685 | 0,44 | 561 | 16,18 | ||||
| 2025-08-14 | 13F | Balyasny Asset Management Llc | 37.096 | 1.416 | ||||||
| 2025-07-08 | 13F | Next Level Private LLC | 9.521 | 1,31 | 363 | 17,10 | ||||
| 2025-08-01 | 13F | Boyd Watterson Asset Management Llc/oh | 96 | 0,00 | 4 | 0,00 | ||||
| 2025-08-12 | 13F | NWF Advisory Services Inc. | 75.000 | 2.474 | ||||||
| 2025-07-31 | 13F | Oppenheimer & Co Inc | 44.407 | 3,72 | 1.695 | 20,04 | ||||
| 2025-08-14 | 13F/A | Rockefeller Capital Management L.P. | 10.133 | 0,66 | 387 | 16,27 | ||||
| 2025-07-08 | 13F | Nbc Securities, Inc. | 16.431 | -0,02 | 1 | |||||
| 2025-08-05 | 13F | Huntington National Bank | 80 | 15,94 | ||||||
| 2025-07-18 | 13F | Truist Financial Corp | 32.373 | 8,09 | 1.236 | 25,00 | ||||
| 2025-08-19 | 13F | National Asset Management, Inc. | 9.834 | 15,68 | 375 | 20,97 | ||||
| 2025-08-06 | 13F | Wedbush Securities Inc | 220.815 | -8,97 | 8 | 0,00 | ||||
| 2025-08-04 | 13F | Bay Colony Advisory Group, Inc d/b/a Bay Colony Advisors | 8.221 | 2,57 | 314 | 16,79 | ||||
| 2025-08-14 | 13F | Jane Street Group, Llc | 10.777 | -48,48 | 411 | -40,43 | ||||
| 2025-08-14 | 13F | Polar Asset Management Partners Inc. | 14.730 | 1,47 | 562 | 17,57 | ||||
| 2025-07-14 | 13F | AdvisorNet Financial, Inc | 1.363 | 83,69 | 52 | 116,67 | ||||
| 2025-08-05 | 13F | Claro Advisors LLC | 8.594 | 1,17 | 328 | 17,14 | ||||
| 2025-08-12 | 13F | NFP Retirement, Inc. | 58.527 | -1,91 | 2.234 | 13,47 | ||||
| 2025-07-25 | 13F | Atria Wealth Solutions, Inc. | 12.482 | 477 | ||||||
| 2025-07-14 | 13F | Armstrong Advisory Group, Inc | 352 | 13 | ||||||
| 2025-07-18 | 13F | Trust Co Of Vermont | 1.500 | 0,00 | 57 | 16,33 | ||||
| 2025-08-01 | 13F | Envestnet Asset Management Inc | 27.410 | 2,53 | 1.046 | 18,73 | ||||
| 2025-07-29 | 13F | International Assets Investment Management, Llc | 13.652 | 2,32 | 521 | 18,41 | ||||
| 2025-08-07 | 13F | Readystate Asset Management Lp | 8.971 | 342 | ||||||
| 2025-08-13 | 13F | Northwestern Mutual Wealth Management Co | 7.210 | 11,80 | 275 | 29,72 | ||||
| 2025-07-25 | NP | FCEF - First Trust CEF Income Opportunity ETF This fund is a listed as child fund of First Trust Advisors Lp and if that institution has disclosed ownership in this security, then these positions will not be double counted when calculating total shares and total value | 35.204 | 10,38 | 1.284 | 10,32 | ||||
| 2025-07-14 | 13F | UMA Financial Services, Inc. | 307 | 0,00 | 12 | 10,00 | ||||
| 2025-08-08 | 13F | Kingsview Wealth Management, LLC | 24.453 | 0,00 | 933 | 15,76 | ||||
| 2025-08-12 | 13F | Walled Lake Planning & Wealth Management, Llc | 8.591 | 2,10 | 328 | 18,05 | ||||
| 2025-08-12 | 13F | Virtu Financial LLC | 0 | -100,00 | 0 | |||||
| 2025-07-21 | 13F | Future Financial Wealth Managment LLC | 14.000 | 0,00 | 534 | 15,84 | ||||
| 2025-07-09 | 13F | Mirador Capital Partners LP | 7.597 | 0,73 | 290 | 16,53 | ||||
| 2025-08-13 | 13F | First Trust Advisors Lp | 70.663 | -0,80 | 2.697 | 14,81 | ||||
| 2025-07-23 | 13F | Abel Hall, LLC | 13.000 | 496 | ||||||
| 2025-07-29 | 13F | Stephens Inc /ar/ | 16.485 | 3,13 | 629 | 19,35 | ||||
| 2025-08-19 | 13F | Newbridge Financial Services Group, Inc. | 68.399 | 2.611 | ||||||
| 2025-04-29 | 13F | Hm Payson & Co | 600 | 0,00 | 20 | -9,52 | ||||
| 2025-08-08 | 13F | Capital Investment Advisory Services, LLC | 6.447 | 6,00 | 246 | 23,00 | ||||
| 2025-06-27 | NP | Calamos ETF Trust - Calamos CEF Income & Arbitrage ETF | 7.812 | -34,79 | 261 | -42,38 | ||||
| 2025-08-14 | 13F | Monetary Management Group Inc | 445 | 0,00 | 17 | 14,29 | ||||
| 2025-08-13 | 13F | Level Four Advisory Services, Llc | 5.776 | -17,69 | 220 | -4,76 | ||||
| 2025-08-12 | 13F | Steward Partners Investment Advisory, Llc | 169.148 | -0,34 | 6.456 | 15,31 | ||||
| 2025-07-31 | 13F | Anchor Capital Management Group Inc | 18.000 | 0,00 | 687 | 15,85 | ||||
| 2025-08-13 | 13F | Invesco Ltd. | 432.215 | -12,41 | 16.498 | 1,34 | ||||
| 2025-07-16 | 13F | ORG Partners LLC | 1.033 | -26,42 | 39 | -17,02 | ||||
| 2025-07-28 | 13F | SFG Wealth Management, LLC. | 20.552 | 0,00 | 784 | 15,63 | ||||
| 2025-07-28 | 13F | Mission Hills Financial Advisory, LLC | 13.402 | 512 | ||||||
| 2025-07-24 | 13F | Aurora Private Wealth, Inc. | 8.808 | 1,46 | 0 | |||||
| 2025-08-14 | 13F | MGB Wealth Management, LLC | 0 | -100,00 | 0 | |||||
| 2025-08-12 | 13F | MAI Capital Management | 1.162 | 0,17 | 44 | 15,79 | ||||
| 2025-06-26 | NP | ATCAX - Anchor Risk Managed Credit Strategies Fund Advisor Class Shares | 18.000 | 0,00 | 656 | 0,00 | ||||
| 2025-07-25 | 13F | Apollon Wealth Management, LLC | 17.980 | 20,24 | 686 | 39,15 | ||||
| 2025-08-06 | 13F | New Millennium Group LLC | 1 | 0 | ||||||
| 2025-08-14 | 13F | Karpus Management, Inc. | 322.983 | 7,39 | 12.328 | 24,25 | ||||
| 2025-07-15 | 13F | Wealth Effects Llc | 14.685 | -14,42 | 561 | -1,06 | ||||
| 2025-08-14 | 13F | Raymond James Financial Inc | 1.045.902 | 2,38 | 39.922 | 18,46 | ||||
| 2025-08-14 | 13F | Herold Advisors, Inc. | 6.233 | 1,65 | 238 | 17,33 | ||||
| 2025-07-24 | 13F | Ronald Blue Trust, Inc. | 100 | 4 | ||||||
| 2025-08-14 | 13F | 1607 Capital Partners, LLC | 284.950 | -8,54 | 10.877 | 5,82 | ||||
| 2025-07-24 | 13F | Jfs Wealth Advisors, Llc | 383 | 0,00 | 15 | 16,67 | ||||
| 2025-08-07 | 13F | Vista Investment Partners Ii, Llc | 6.762 | 0,43 | 258 | 16,22 | ||||
| 2025-05-16 | 13F | Coordinated Financial Services, Inc./CO | 0 | -100,00 | 0 | |||||
| 2025-08-11 | 13F | Principal Securities, Inc. | 2.074 | 12,90 | 79 | 17,91 | ||||
| 2025-08-14 | 13F | Sunbelt Securities, Inc. | 11.435 | 97,16 | 418 | 118,85 | ||||
| 2025-08-07 | 13F | Allworth Financial LP | 7 | 16,67 | 0 | |||||
| 2025-08-08 | 13F | Pnc Financial Services Group, Inc. | 7.840 | -33,50 | 299 | -22,94 | ||||
| 2025-08-05 | 13F | Shaker Financial Services, LLC | 36.014 | 313,15 | 1.375 | 378,75 | ||||
| 2025-08-11 | 13F | Tidemark, LLC | 42 | 0,00 | 2 | 0,00 | ||||
| 2025-08-22 | NP | Cornerstone Strategic Value Fund Inc | 59.383 | 5,85 | 2.267 | 22,49 | ||||
| 2025-08-05 | 13F | Scarborough Advisors, LLC | 259 | 10 | ||||||
| 2025-08-11 | 13F | Elequin Capital Lp | 13.024 | 2.059,87 | 497 | 2.515,79 | ||||
| 2025-08-04 | 13F | Pensionmark Financial Group, Llc | 5.367 | 205 | ||||||
| 2025-07-28 | NP | PCEF - Invesco CEF Income Composite ETF This fund is a listed as child fund of Invesco Ltd. and if that institution has disclosed ownership in this security, then these positions will not be double counted when calculating total shares and total value | 418.145 | -5,67 | 15.246 | -5,70 | ||||
| 2025-07-09 | 13F | David J Yvars Group | 28.045 | 0,57 | 1.071 | 16,03 | ||||
| 2025-08-14 | 13F | GWM Advisors LLC | 820 | 1,61 | 31 | 19,23 | ||||
| 2025-08-12 | 13F | Proequities, Inc. | 0 | 0 | ||||||
| 2025-08-06 | 13F | Commonwealth Equity Services, Llc | 39.897 | -1,40 | 2 | 0,00 | ||||
| 2025-08-13 | 13F | EverSource Wealth Advisors, LLC | 710 | 0,00 | 27 | 17,39 | ||||
| 2025-08-12 | 13F | BlackRock, Inc. | 0 | -100,00 | 0 | |||||
| 2025-08-12 | 13F | Park Square Financial Group, LLC | 44 | 0,00 | 2 | 0,00 | ||||
| 2025-05-06 | 13F | Venturi Wealth Management, LLC | 0 | -100,00 | 0 | |||||
| 2025-08-04 | 13F | Wolverine Asset Management Llc | 13.153 | 502 | ||||||
| 2025-08-13 | 13F | Smith, Moore & Co. | 15.173 | 0,33 | 579 | 16,27 | ||||
| 2025-08-14 | 13F | Wells Fargo & Company/mn | 67.218 | 242,04 | 2.566 | 295,83 | ||||
| 2025-04-21 | 13F | Nelson, Van Denburg & Campbell Wealth Management Group, LLC | 0 | -100,00 | 0 | |||||
| 2025-08-13 | 13F | Keystone Financial Group | 6.734 | 0,00 | 257 | 15,77 | ||||
| 2025-08-04 | 13F | Daymark Wealth Partners, Llc | 5.975 | 228 | ||||||
| 2025-08-14 | 13F | Atomi Financial Group, Inc. | 11.765 | -9,33 | 449 | 4,91 | ||||
| 2025-08-22 | NP | Cornerstone Total Return Fund Inc | 28.142 | 0,00 | 1.074 | 15,73 | ||||
| 2025-08-08 | 13F | Cornerstone Advisors, LLC | 87.525 | 3,90 | 3.341 | 20,19 | ||||
| 2025-08-08 | 13F | Symphony Financial Services, Inc. | 6.311 | -0,71 | 241 | 14,83 | ||||
| 2025-07-01 | 13F | Harbor Investment Advisory, Llc | 3.163 | -9,40 | 121 | 4,35 | ||||
| 2025-07-30 | 13F | D.a. Davidson & Co. | 15.340 | 23,35 | 586 | 42,68 | ||||
| 2025-07-24 | 13F | Us Bancorp \de\ | 0 | -100,00 | 0 | |||||
| 2025-08-14 | 13F | Wealth Preservation Advisors, LLC | 0 | -100,00 | 0 | |||||
| 2025-07-28 | 13F | Mutual Advisors, LLC | 14.245 | 5,40 | 555 | 22,84 | ||||
| 2025-08-14 | 13F | Colony Group, LLC | 0 | -100,00 | 0 | |||||
| 2025-08-14 | 13F | Ambassador Advisors, LLC | 8.673 | 0,91 | 331 | 16,96 | ||||
| 2025-08-15 | 13F | Morgan Stanley | 1.281.194 | -1,47 | 48.903 | 14,00 | ||||
| 2025-08-14 | 13F | Bank Of America Corp /de/ | 192.302 | 1,32 | 7.340 | 17,23 | ||||
| 2025-07-28 | 13F | Harbour Investments, Inc. | 1.455 | 0,00 | 56 | 14,58 | ||||
| 2025-08-11 | 13F | HighTower Advisors, LLC | 35.413 | 1,49 | 1.352 | 17,38 | ||||
| 2025-08-12 | 13F | Boreal Capital Management LLC | 600 | 23 | ||||||
| 2025-08-14 | 13F | IHT Wealth Management, LLC | 0 | -100,00 | 0 | |||||
| 2025-08-15 | 13F | Captrust Financial Advisors | 5.856 | 224 | ||||||
| 2025-05-14 | 13F | Van Hulzen Asset Management, LLC | 0 | -100,00 | 0 | -100,00 | ||||
| 2025-08-14 | 13F | Mercer Global Advisors Inc /adv | 7.449 | 12,74 | 284 | 30,88 | ||||
| 2025-08-14 | 13F | Wiley Bros.-aintree Capital, Llc | 10.056 | 0,26 | 384 | 14,33 |