Statistiche di base
| Proprietari istituzionali | 77 total, 77 long only, 0 short only, 0 long/short - change of 1,30% MRQ |
| Allocazione media del portafoglio | 0.1724 % - change of 5,95% MRQ |
| Azioni istituzionali (Long) | 3.076.613 (ex 13D/G) - change of 0,26MM shares 9,12% MRQ |
| Valore istituzionale (Long) | $ 103.063 USD ($1000) |
Proprietà istituzionale e azionisti
BlackRock Health Sciences Trust (US:BME) ha 77 proprietari istituzionali e azionisti che hanno presentato i moduli 13D/G o 13F alla Securities Exchange Commission (SEC). Queste istituzioni detengono un totale di 3,076,613 azioni. I maggiori azionisti includono Morgan Stanley, Wells Fargo & Company/mn, Nova R Wealth, Inc., Shaker Financial Services, LLC, Invesco Ltd., Bank Of America Corp /de/, PCEF - Invesco CEF Income Composite ETF, 1607 Capital Partners, LLC, Royal Bank Of Canada, and Cornerstone Advisory, LLC .
(BlackRock Health Sciences Trust (NYSE:BME) la struttura proprietaria istituzionale mostra le attuali posizioni nella società da parte di istituzioni e fondi, nonché le ultime variazioni nella dimensione della posizione. I principali azionisti possono essere singoli investitori, fondi comuni, hedge fund o istituzioni. L'allegato 13D indica che l'investitore detiene (o ha detenuto) più del 5% della società e intende (o intendeva) perseguire attivamente un cambiamento nella strategia aziendale. L'allegato 13G indica un investimento passivo superiore al 5%.
The share price as of September 5, 2025 is 37,13 / share. Previously, on September 6, 2024, the share price was 41,84 / share. This represents a decline of 11,26% over that period.

Indice del sentiment dei fondi
L'indice del sentiment dei fondi (anche noto come "indice di accumulo di proprietà") individua i titoli più acquistati dai fondi. È il risultato di un sofisticato modello quantitativo multi-fattore che identifica le società con i più alti livelli di accumulo istituzionale. Il modello utilizza una combinazione dell'aumento totale dei proprietari dichiarati, delle variazioni nelle allocazioni di portafoglio di tali proprietari e di altre metriche. Il punteggio varia da 0 a 100: i numeri più alti indicano un livello di accumulo superiore ad altre società, mentre 50 rappresenta la media.
Frequenza di aggiornamento: giornaliera
Consulta Ownership Explorer per visualizzare l'elenco delle aziende con il ranking più alto.
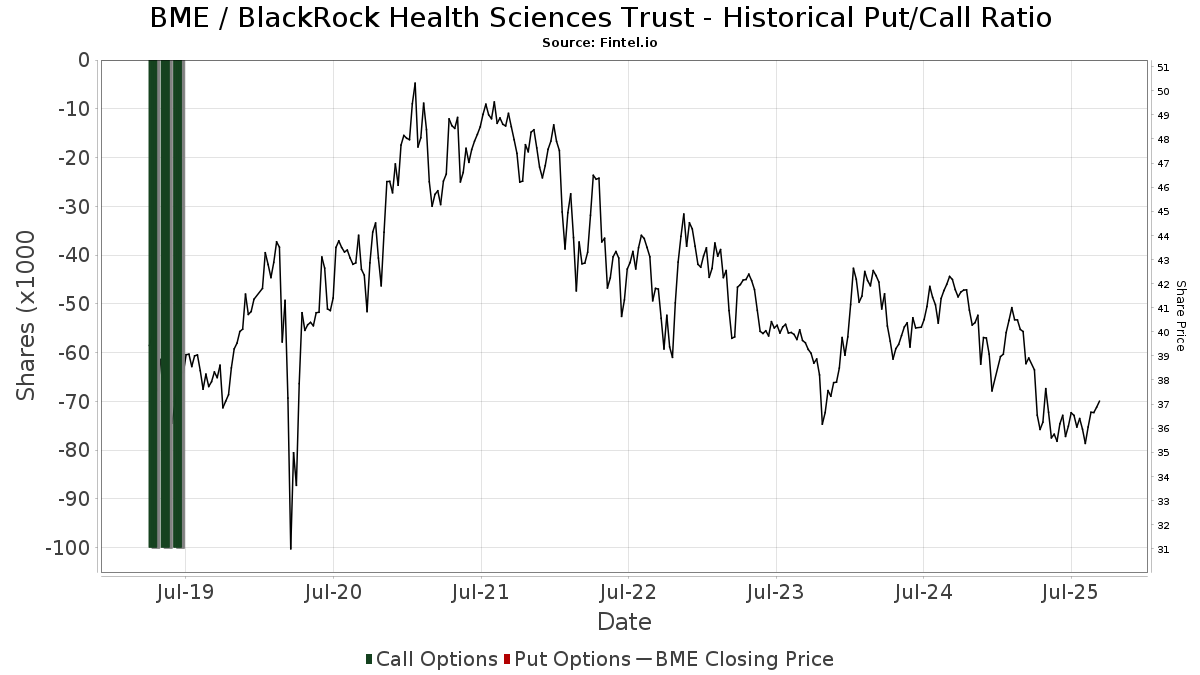
Rapporto put/call istituzionale
Oltre a segnalare le emissioni standard di titoli azionari e di debito, gli istituti con più di 100 milioni di asset in gestione devono anche dichiarare le loro partecipazioni in opzioni put e call. Poiché le opzioni put indicano generalmente un sentiment negativo e le opzioni call un sentiment positivo, possiamo avere un'idea del sentiment istituzionale complessivo attraverso il rapporto tra put e call. Il grafico a destra mostra il rapporto storico put/call per questo strumento.
L'utilizzo del rapporto put/call come indicatore del sentiment degli investitori consente di superare una delle principali lacune dell'utilizzo della proprietà istituzionale totale, ovvero il fatto che una quantità significativa di asset in gestione viene investita passivamente per seguire gli indici. Generalmente, i fondi a gestione passiva non acquistano opzioni, per cui il rapporto put/call riflette più fedelmente il sentiment dei fondi a gestione attiva.
Depositi 13F e NPORT
Le informazioni relative ai depositi 13F sono gratuite. Per accedere alle informazioni relative ai depositi NP è necessario un'abbonamento premium. Le righe verdi indicano le nuove posizioni. Le righe rosse indicano le posizioni chiuse. Fai clic sull'icona del link per visualizzare la cronologia completa delle transazioni.
Esegui l'upgrade
per sbloccare i dati premium ed esportarli in Excel ![]() .
.
| Data di deposito | Fonte | Investitore | Tipo | Prezzo medio (Stima) |
Azioni | Δ Azioni (%) |
Valore dichiarato ($ 1000) |
Δ Valore (%) |
Allocazione del portafoglio (%) |
|
|---|---|---|---|---|---|---|---|---|---|---|
| 2025-08-14 | 13F | Comerica Bank | 4.807 | 0,00 | 175 | -5,41 | ||||
| 2025-08-11 | 13F | Brown Brothers Harriman & Co | 590 | 0,00 | 22 | -4,55 | ||||
| 2025-07-18 | 13F | Consolidated Portfolio Review Corp | 38.879 | 34,68 | 1.418 | 27,09 | ||||
| 2025-07-11 | 13F | Farther Finance Advisors, LLC | 2.050 | 75 | ||||||
| 2025-07-25 | NP | FCEF - First Trust CEF Income Opportunity ETF This fund is a listed as child fund of First Trust Advisors Lp and if that institution has disclosed ownership in this security, then these positions will not be double counted when calculating total shares and total value | 8.586 | 62,71 | 308 | 45,28 | ||||
| 2025-08-08 | 13F | City Of London Investment Management Co Ltd | 0 | -100,00 | 0 | |||||
| 2025-09-04 | 13F/A | Advisor Group Holdings, Inc. | 39.633 | -1,39 | 1.445 | -6,95 | ||||
| 2025-07-29 | 13F | Mb, Levis & Associates, Llc | 0 | -100,00 | 0 | |||||
| 2025-08-04 | 13F | AlphaStar Capital Management, LLC | 11.441 | 6,91 | 163 | 2,52 | ||||
| 2025-08-08 | 13F | Calamos Advisors LLC | 5.764 | -11,19 | 210 | -16,00 | ||||
| 2025-07-29 | 13F | Primoris Wealth Advisors, Llc | 0 | -100,00 | 0 | |||||
| 2025-08-14 | 13F | GWM Advisors LLC | 14.185 | 8,50 | 517 | 2,38 | ||||
| 2025-08-15 | 13F | Morgan Stanley | 359.820 | -2,47 | 13.119 | -7,97 | ||||
| 2025-07-21 | 13F | Ameriflex Group, Inc. | 1.000 | 0,00 | 36 | -5,26 | ||||
| 2025-08-04 | 13F | Spire Wealth Management | 188 | 0,00 | 7 | -14,29 | ||||
| 2025-08-12 | 13F | LPL Financial LLC | 54.354 | -0,49 | 1.982 | -6,11 | ||||
| 2025-08-04 | 13F | Wolverine Asset Management Llc | 46.935 | -18,40 | 1.711 | -23,00 | ||||
| 2025-08-08 | 13F | Cetera Investment Advisers | 12.206 | -1,68 | 445 | -7,10 | ||||
| 2025-08-14 | 13F | Wells Fargo & Company/mn | 352.171 | 2,82 | 12.840 | -2,98 | ||||
| 2025-07-25 | 13F | Summa Corp. | 0 | -100,00 | 0 | |||||
| 2025-08-14 | 13F/A | Rockefeller Capital Management L.P. | 15.987 | -8,42 | 583 | -13,65 | ||||
| 2025-08-14 | 13F | Royal Bank Of Canada | 141.204 | -1,63 | 5.149 | -7,16 | ||||
| 2025-08-15 | 13F | Kestra Advisory Services, LLC | 29.522 | 19,28 | 1.076 | 12,55 | ||||
| 2025-07-28 | NP | PCEF - Invesco CEF Income Composite ETF This fund is a listed as child fund of Invesco Ltd. and if that institution has disclosed ownership in this security, then these positions will not be double counted when calculating total shares and total value | 161.831 | -12,16 | 5.811 | -21,79 | ||||
| 2025-05-19 | 13F | Smith Asset Management Co., LLC | 6.530 | 252 | ||||||
| 2025-08-11 | 13F | Principal Securities, Inc. | 447 | 0,00 | 16 | 0,00 | ||||
| 2025-08-13 | 13F | Jones Financial Companies Lllp | 0 | -100,00 | 0 | |||||
| 2025-08-05 | 13F | GPS Wealth Strategies Group, LLC | 195 | 2,09 | 7 | 0,00 | ||||
| 2025-07-28 | 13F | BRYN MAWR TRUST Co | 400 | 0,00 | 15 | -6,67 | ||||
| 2025-08-11 | 13F | Elequin Capital Lp | 1.595 | -29,49 | 58 | -33,33 | ||||
| 2025-04-16 | 13F | Hoey Investments, Inc | 0 | -100,00 | 0 | |||||
| 2025-08-14 | 13F | Balyasny Asset Management Llc | 10.594 | 386 | ||||||
| 2025-07-08 | 13F | Nbc Securities, Inc. | 11.686 | 0,21 | 0 | |||||
| 2025-07-31 | 13F | Oppenheimer & Co Inc | 6.342 | 0,75 | 231 | -4,94 | ||||
| 2025-08-06 | 13F | Legacy Investment Solutions, LLC | 1.522 | 22 | ||||||
| 2025-05-12 | 13F | Fmr Llc | 0 | -100,00 | 0 | |||||
| 2025-08-05 | 13F | Huntington National Bank | 0 | |||||||
| 2025-05-14 | 13F | Jane Street Group, Llc | 0 | -100,00 | 0 | |||||
| 2025-05-15 | 13F | Millennium Management Llc | 0 | -100,00 | 0 | -100,00 | ||||
| 2025-07-17 | 13F | Janney Montgomery Scott LLC | 38.475 | 9,70 | 1 | 0,00 | ||||
| 2025-08-18 | 13F | N.E.W. Advisory Services LLC | 420 | 0,00 | 15 | -6,25 | ||||
| 2025-08-08 | 13F | Pnc Financial Services Group, Inc. | 3.240 | -0,49 | 118 | -5,60 | ||||
| 2025-06-27 | NP | Calamos ETF Trust - Calamos CEF Income & Arbitrage ETF | 8.079 | -13,74 | 304 | -20,63 | ||||
| 2025-08-14 | 13F | Stifel Financial Corp | 6.227 | -5,24 | 227 | -10,28 | ||||
| 2025-08-07 | 13F | Allworth Financial LP | 5 | 0 | ||||||
| 2025-08-06 | 13F | Legacy Wealth Managment, LLC/ID | 1.522 | 22 | ||||||
| 2025-08-13 | 13F | Northwestern Mutual Wealth Management Co | 1.160 | 0,78 | 42 | -4,55 | ||||
| 2025-08-12 | 13F | NFP Retirement, Inc. | 44.510 | -21,53 | 1.623 | -25,97 | ||||
| 2025-07-31 | 13F | Cambridge Investment Research Advisors, Inc. | 26.739 | -47,21 | 1 | -100,00 | ||||
| 2025-08-07 | 13F | Readystate Asset Management Lp | 6.934 | 253 | ||||||
| 2025-07-14 | 13F | UMA Financial Services, Inc. | 232 | 0,00 | 8 | 0,00 | ||||
| 2025-05-15 | 13F | Hrt Financial Lp | 0 | -100,00 | 0 | |||||
| 2025-08-13 | 13F | Invesco Ltd. | 201.788 | 0,52 | 7.357 | -5,14 | ||||
| 2025-08-14 | 13F | Raymond James Financial Inc | 97.135 | 9,00 | 3.542 | 2,85 | ||||
| 2025-08-11 | 13F | HighTower Advisors, LLC | 22.477 | -13,50 | 820 | -18,43 | ||||
| 2025-08-04 | 13F | HBK Sorce Advisory LLC | 11.602 | 27,13 | 423 | 19,89 | ||||
| 2025-08-27 | NP | RYMSX - Guggenheim Multi-Hedge Strategies Fund Class P | 51 | -32,89 | 2 | -50,00 | ||||
| 2025-05-14 | 13F | Yakira Capital Management, Inc. | 0 | -100,00 | 0 | |||||
| 2025-07-30 | 13F | Cornerstone Advisory, LLC | 139.395 | -7,40 | 5.082 | -7,68 | ||||
| 2025-07-29 | 13F | Stratos Wealth Partners, LTD. | 6.883 | -2,19 | 251 | -7,75 | ||||
| 2025-05-05 | 13F | IFP Advisors, Inc | 0 | -100,00 | 0 | |||||
| 2025-05-16 | 13F | Coppell Advisory Solutions LLC | 0 | -100,00 | 0 | -100,00 | ||||
| 2025-08-12 | 13F | Founders Financial Alliance, LLC | 17.051 | 622 | ||||||
| 2025-08-14 | 13F | 1607 Capital Partners, LLC | 153.502 | 8,78 | 5.597 | 2,64 | ||||
| 2025-07-16 | 13F | Diversified Enterprises, LLC | 11.981 | 0,87 | 437 | -4,80 | ||||
| 2025-08-12 | 13F | Landscape Capital Management, L.l.c. | 0 | -100,00 | 0 | |||||
| 2025-08-14 | 13F | Karpus Management, Inc. | 52.672 | 1,85 | 1.920 | -3,90 | ||||
| 2025-08-27 | NP | RYDEX VARIABLE TRUST - Multi-Hedge Strategies Fund Variable Annuity | 86 | -12,24 | 3 | 0,00 | ||||
| 2025-07-16 | 13F | Owen LaRue, LLC | 6.798 | 248 | ||||||
| 2025-08-12 | 13F | MAI Capital Management | 422 | 2,18 | 15 | 0,00 | ||||
| 2025-04-25 | 13F | Smallwood Wealth Investment Management, LLC | 25 | 1 | ||||||
| 2025-05-15 | 13F | Parvin Asset Management, LLC | 0 | -100,00 | 0 | |||||
| 2025-07-24 | 13F | Us Bancorp \de\ | 0 | -100,00 | 0 | |||||
| 2025-08-05 | 13F | Shaker Financial Services, LLC | 224.516 | 3.224 | ||||||
| 2025-08-14 | 13F | UBS Group AG | 116.223 | -13,86 | 4.237 | -18,72 | ||||
| 2025-08-04 | 13F | Waterfront Wealth Inc. | 5.575 | 0,00 | 203 | -5,58 | ||||
| 2025-08-14 | 13F | Ameriprise Financial Inc | 70.952 | 4,94 | 2.587 | -0,88 | ||||
| 2025-08-18 | 13F | Geneos Wealth Management Inc. | 4.899 | 200,00 | 179 | 182,54 | ||||
| 2025-05-01 | 13F | Corrado Advisors, Llc | 0 | -100,00 | 0 | -100,00 | ||||
| 2025-08-19 | 13F | Advisory Services Network, LLC | 9.412 | 334 | ||||||
| 2025-08-14 | 13F | Beaird Harris Wealth Management, LLC | 5.000 | 182 | ||||||
| 2025-05-15 | 13F | Rivernorth Capital Management, Llc | 0 | -100,00 | 0 | |||||
| 2025-07-07 | 13F | Investors Research Corp | 150 | 5 | ||||||
| 2025-07-30 | 13F | Bogart Wealth, LLC | 14 | -93,43 | 1 | -100,00 | ||||
| 2025-08-06 | 13F | Commonwealth Equity Services, Llc | 27.660 | -9,48 | 1 | 0,00 | ||||
| 2025-08-14 | 13F | Two Sigma Securities, Llc | 6.524 | 238 | ||||||
| 2025-08-14 | 13F | Bank Of America Corp /de/ | 182.186 | 5,24 | 6.642 | -0,70 | ||||
| 2025-08-07 | 13F | Cypress Capital Management LLC (WY) | 38.545 | 1.405 | ||||||
| 2025-08-14 | 13F | Two Sigma Investments, Lp | 35.110 | 1.280 | ||||||
| 2025-08-12 | 13F | Park Square Financial Group, LLC | 38 | 0,00 | 1 | 0,00 | ||||
| 2025-08-14 | 13F | Hara Capital LLC | 15.713 | -8,71 | 573 | -13,98 | ||||
| 2025-08-12 | 13F | PSI Advisors, LLC | 0 | -100,00 | 0 | |||||
| 2025-08-12 | 13F | Proequities, Inc. | 0 | 0 | ||||||
| 2025-08-07 | 13F | Fountainhead AM, LLC | 0 | -100,00 | 0 | |||||
| 2025-08-04 | 13F | L.m. Kohn & Company | 5.948 | -10,58 | 217 | -15,95 | ||||
| 2025-07-18 | 13F | SOA Wealth Advisors, LLC. | 2.311 | 0,00 | 84 | -5,62 | ||||
| 2025-08-12 | 13F | Steward Partners Investment Advisory, Llc | 0 | -100,00 | 0 | |||||
| 2025-08-12 | 13F | Global Retirement Partners, LLC | 100 | 0,00 | 4 | 0,00 | ||||
| 2025-08-12 | 13F | Nemes Rush Group LLC | 0 | -100,00 | 0 | |||||
| 2025-08-13 | 13F | First Trust Advisors Lp | 14.930 | 108,05 | 544 | 96,39 | ||||
| 2025-07-17 | 13F | Nova R Wealth, Inc. | 281.349 | -10,35 | 10.258 | -15,42 |